Dudley Strategy for Tackling Health Inequalities 2010-15
Dudley Strategy for Tackling Health Inequalities 2010-15
Dudley Strategy for Tackling Health Inequalities 2010-15
- No tags were found...

You also want an ePaper? Increase the reach of your titles
YUMPU automatically turns print PDFs into web optimized ePapers that Google loves.
<strong>2010</strong>F<strong>Dudley</strong> <strong>Strategy</strong> <strong>for</strong><strong>Tackling</strong> <strong>Health</strong><strong>Inequalities</strong>: <strong>2010</strong>-<strong>15</strong>Full strategy includingEvidence Review andDetailed Action PlansThe <strong>Dudley</strong> Group of HospitalsNHS Trust0
FOREWORDSince our last <strong>Health</strong> <strong>Inequalities</strong> <strong>Strategy</strong> was produced in 2005, <strong>Dudley</strong> has seenreductions in mortality <strong>for</strong> all of the main causes of ill health, including cancer, heartdisease and respiratory disease. Life expectancy <strong>for</strong> all sections of society hasimproved, but the gap between the richest and poorest has increased slightly.<strong>Tackling</strong> health inequalities is as much about tackling the social determinants of illhealth as it is about changing our own behaviour to live healthier lives. The currenteconomic climate will see some jobs disappear and unemployment is set to rise.Everyone in the borough will be impacted on by the reduction in public spending. Arobust strategy and a collective determination from all our partners will be necessaryto implement some of the tough choices that lie ahead if we are to ensure thateveryone in <strong>Dudley</strong> is able to live out their lives in the best possible health.I welcome this new strategy with its strong focus on social determinants and onidentifying the priority actions that will have the greatest impact on reducing healthinequalities in <strong>Dudley</strong>.Andy GrayChair of <strong>Dudley</strong> Community PartnershipSeptember <strong>2010</strong>1
ENDORSEMENT OF THE <strong>2010</strong> – 20<strong>15</strong>HEALTH INEQUALITIES STRATEGYThis revised <strong>Health</strong> <strong>Inequalities</strong> <strong>Strategy</strong> has been produced in the light of newnational policy to reduce health inequalities. It has been in<strong>for</strong>med by feedback fromthe Department of <strong>Health</strong>‟s National Support Team (NST) <strong>for</strong> <strong>Health</strong> <strong>Inequalities</strong> whovisited us in 2009.The Local Authority, <strong>Health</strong> and Voluntary sector jointly endorse the plans.John PolychronakisChief Executive, <strong>Dudley</strong> Metropolitan Borough CouncilDr Stephen CartwrightManaging Director, NHS <strong>Dudley</strong>Paula ClarkChief Executive, <strong>Dudley</strong> Group of Hospitals NHS Foundation TrustDennis HodsonDirector, <strong>Dudley</strong> Community PartnershipAndy GrayChief Officer, <strong>Dudley</strong> Council <strong>for</strong> Voluntary Services2
ACKNOWLEDGEMENTSThe production of this strategy has involved a large number of contributors andauthors. The editorial team would like to thank everyone who has given their time toread, write and amend the drafts.EDITORIAL TEAMValerie LittleTony CollinsBrendan Clif<strong>for</strong>dSue HolmyardDiane McNultyIan McGuffDirector of Public <strong>Health</strong>, NHS <strong>Dudley</strong>Deputy Director of Public <strong>Health</strong>, NHS <strong>Dudley</strong>Assistant Director Policy, Per<strong>for</strong>mance and Resources,Directorate of Adult, Community and Housing Service, <strong>Dudley</strong> MBCAssistant Director of Planning and Environmental <strong>Health</strong>, <strong>Dudley</strong> MBCPublic <strong>Health</strong> Manager – <strong>Health</strong> Improvement, NHS <strong>Dudley</strong>Assistant Director <strong>for</strong> Quality & Partnership, Childrens Services,<strong>Dudley</strong> MBCCONTRIBUTING AUTHORSKaren JacksonAngela MossRuth OldingJody PritchardAmarjot BirdiAndrew HindleSue CooperTessa NorrisSteve CortonConsultant in Public <strong>Health</strong>, NHS <strong>Dudley</strong>Public <strong>Health</strong> In<strong>for</strong>mation Analyst Manager, NHS <strong>Dudley</strong>Programme Manager <strong>for</strong> Tobacco Control, NHS <strong>Dudley</strong>Programme Manager <strong>for</strong> Community <strong>Health</strong> Improvement, NHS<strong>Dudley</strong><strong>Health</strong> Improvement Programme Manager <strong>Health</strong> Inclusion/PublicMental <strong>Health</strong> Promotion, NHS <strong>Dudley</strong>Strategic Commissioning Lead - Older People and Long TermConditions, NHS <strong>Dudley</strong>Associate Director, Primary Care Commissioning, NHS <strong>Dudley</strong>Director of Community Services & Integrated Care, CommunityServices, <strong>Dudley</strong> Group of Hospitals NHS Foundation TrustHead of Community Engagement, NHS <strong>Dudley</strong>3
CONTENTSFOREWORD…………………………………………………………………………..…..….ACKNOWLEDGEMENTS……………………………………………………………….…..CONTENTS……………………………………………………………………………….…..1. EXECUTIVE SUMMARY……………………………………………………..…....62. VISION STATEMENT…………………………………………………………......183. INTRODUCTION………………………………………………………………......194. HEALTH INEQUALITIES AND THE SOCIAL DETERMINANTS OFHEALTH…………………………………………………………………………….235. LEADERSHIP AND PARTNERSHIP……………………………………………526. COMMUNITY ENGAGEMENT…………………………………………………...567. PRIORITY ACTIONS TO IMPACT ON HEALTH INEQUALITIES……………617.1 Secondary Prevention Cardiovascular Disease……………………… 617.2 Acute Cardiovascular Disease (CVD), Transient Ischaemic Attack (TIA)and Stroke…………………………………………………………………..747.3 Tobacco Control ..….………..…….......……………………………..... 927.4 Alcohol Harm Reduction ………………………………………………1047.5 Cancer…………………………………………………………………..…1187.6 Chronic Obstructive Pulmonary Disease (COPD)……………………1367.7 Seasonal Excess Deaths (SED)…………………………………..……1437.8 Other Contributory Causes………………………………………..….…<strong>15</strong>48. DELIVERING THE SERVICES THAT WILL MAKE A DIFFERENCE……...1788.1 Primary Care…………………………………………………………...…1788.2 Social Care……………………………………………………………..…1838.3 Trans<strong>for</strong>ming Community Services………………………………….…1858.4 Developing the Role of the Voluntary and Community Sector………1898.5 Volunteers, <strong>Health</strong> Champions and <strong>Health</strong> Trainers…………………1928.6 The Prevention Role of the Acute Sector………………………………1969. KEY RECOMMENDATIONS…………………………………………………....1989.1 <strong>Dudley</strong> <strong>Health</strong> <strong>Inequalities</strong> High Level Action Plan 10/11 – 14/<strong>15</strong>….201REFERENCES……………………………………………………………………...........2084
.Appendix 1 Per<strong>for</strong>mance Indicators ……………………………………………….....2<strong>15</strong>Appendix 2 Delivery Plans <strong>for</strong> Priority Actions………………………………………219Appendix 3 <strong>Health</strong> <strong>Inequalities</strong> Checklists………………………………………...…2355
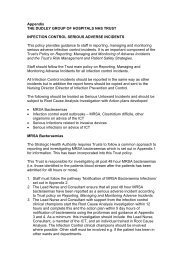
Standardised Rate per 100,000 Population1983-19851984-19861985-19871986-19881987-19891988-19901989-19911990-19921991-19931992-19941993-19951994-19961995-19971996-19981997-19991998-20001999-20012000-20022001-20032002-20042003-20052004-20062005-20072006-20081. EXECUTIVE SUMMARYBACKGROUNDThis strategy replaces and builds on the previous strategy to tackle healthinequalities in <strong>Dudley</strong>, Closing the Gap – <strong>Tackling</strong> <strong>Health</strong> <strong>Inequalities</strong> in <strong>Dudley</strong>(<strong>Dudley</strong> MBC and PCT, 2005). In the five years since the strategy was written wehave seen mortality rates from the main contributory diseases all reduce slowly andlife expectancy <strong>for</strong> <strong>Dudley</strong> residents has increased from 75.7 years <strong>for</strong> men and 80.3years <strong>for</strong> women in 2003 to 80.3 years <strong>for</strong> men and 81.9 <strong>for</strong> women by 2008.180Directly Standardised Mortality Rates from All Causes by Year3-Year Rates, <strong>Dudley</strong>, Both Sexes All Ages, 1983-1985 to 2006-20081601401<strong>2010</strong>0806040200However the gap in life expectancy <strong>for</strong> the most affluent residents in the boroughcompared with those living in the poorest areas still persists. There are also genderdifferences associated with health inequalities and males bear the bigger burden ofmorbidity from disease and premature death.The previous strategy from 2005 set a target based on a national Public ServiceAgreement to;‘’Reduce health inequalities by 10% by <strong>2010</strong> as measured by infant mortalityand life expectancy at birth.’’6
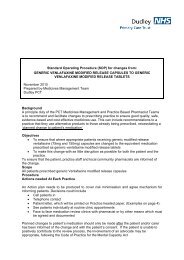
Standardised Rate per 100,000 PopulationIt is not possible to say whether we have achieved this target yet, since <strong>2010</strong> data isnot available. However the gap is no longer widening at the same rate.Life expectancy <strong>for</strong> the whole population has improved, but the gap between thenational average and the spearhead authorities (the most deprived Local Authorities)has widened by 7% <strong>for</strong> men and 14% <strong>for</strong> women since 1995-97. Life expectancy <strong>for</strong>the whole population in England is now 77.9 years <strong>for</strong> men and 82.0 years <strong>for</strong>women. Life expectancy in <strong>Dudley</strong> is improving, but there are still significantdifferences across the borough1,400Directly Standardised Mortality Rates from All Causes by Ward5-Year Rates, <strong>Dudley</strong> MBC, Males & Females, All Ages, 2004-20081,2001,0008006004002000Whilst it is pleasing to see the reduction in premature mortality the inequalities gap isstill very evident and it is <strong>for</strong> this very powerful reason that this strategy seeks toaddress the social determinants of health as well as focusing on improving the healthof the most deprived populations within the borough.STRATEGIC PRIORITIESThe 2005 strategy identified three key priorities:Reduce povertyTobacco controlIncrease educational attainment7
There were three principles that underpinned the delivery of the strategy:A systematic approach to planningStrengthened partnerships to maximise planningProviding equitable services:Significant progress has been made against the three key priorities with someactions achieved and some progress made against others. The notable successeshave been in tobacco control with the introduction of the smoking ban in publicplaces and the effectiveness of the local quit smoking services. Educationalattainment has also improved over the last five years with 76% of pupils achievinggrades A to C in <strong>2010</strong>, compared with 56% in 2006. Improvements have also beenseen in housing, reducing fuel poverty and the regeneration of deprivedneighbourhoods, all of which have contributed to the reduction in health inequalities.The challenge <strong>for</strong> the refreshed strategy is to build on this foundation in a verydifferent economic environment and ensure that we continue to implement plans thatsupport the health and economic well being of the most vulnerable groups in theborough.In July 2009 the Department of <strong>Health</strong>‟s <strong>Health</strong> <strong>Inequalities</strong> National Support Teamvisited <strong>Dudley</strong> to assess our per<strong>for</strong>mance in reducing health inequalities. Their reportwas very favourable in a number of areas, particularly partnership, strategic visionand community engagement. However they did identify five key priority actions <strong>for</strong><strong>Dudley</strong>.Strengthening leadership <strong>for</strong> health and health inequalities across thepartnership and particularly within the Local Authority and Acute TrustImproving the quality and capacity of primary careRefreshing the <strong>Health</strong> <strong>Inequalities</strong> <strong>Strategy</strong>, developing detailed delivery plansand agreeing a common frame of reference <strong>for</strong> monitoring progress onaddressing health inequalities.The continued market development of the voluntary, community and faithsector.The simplification of neighbourhood community engagement structures.These recommendations, and other specific recommendations relating to priorityactions known to have a significant impact on reducing health inequalities, havebeen taken into account in the development of the refreshed strategy. They havebeen summarised as high level actions in the delivery plan, together with theoutcomes and indicators that will be used to monitor progress.8
Whilst this strategy has been in development a key report was released and anumber of important policy changes have taken place that will impact on how healthinequalities will be addressed in the future. Firstly, The Marmot Review, <strong>2010</strong> wasreleased in February <strong>2010</strong>. This review emphasised the persistent nature of healthinequalities in England and suggested that ef<strong>for</strong>ts should be made to tackle thesocial gradient in health, but focusing solely on the disadvantaged will not reduce thegradient sufficiently. Marmot introduces the concept of „proportionate universalism‟where actions must be universal, but with a scale and intensity that is proportionateto the level of deprivation. He identifies a number of policy areas that will have thegreatest impact on reducing health inequalities and these have been adapted tobecome the key strategic aims of this strategy.STRATEGIC AIMS Give every child the best start in life Create fair employment and good work <strong>for</strong> all Ensure a healthy standard of living <strong>for</strong> all Create and develop healthy and sustainable places andcommunities Strengthen the role and impact of ill health preventionThe first policy change that impacts on health inequalities is the role of the „BigSociety‟, which encourages people to take more control over their own lives, rely lesson the state and help other people. This could be a really positive change in oursociety, but could also have the unintended consequence of leaving the mostvulnerable at risk of further inequities in health and social care.The other major policy shift has been reflected in the White Paper, Liberating theNHS (Great Britain. Department of <strong>Health</strong>, <strong>2010</strong>), which sets out radical change <strong>for</strong>the way in which NHS services will be commissioned and delivered in the future. Theresponsibility <strong>for</strong> improving health and wellbeing and reducing health inequalities willbe transferred to Local Authorities along with delivering some other Public <strong>Health</strong>functions by 2013.LEADERSHIP AND PARTNERSHIPIn the midst of these changes we need to safeguard the strong partnershipsdeveloped with people living in local communities in <strong>Dudley</strong>. Long be<strong>for</strong>e statutoryrequirements like the „Duty to Involve‟ came into being, public and voluntary sectoragencies in <strong>Dudley</strong> have been working alongside local communities to ensure thatpeople can affect decision making, influence change in the delivery of health andsocial services, gain experience and skills which may lead to a better quality of life<strong>for</strong> them and their families, and take ownership of their own health improvement.9
This work has been built on trusting relationships, which takes time to develop. Anincreasing focus on market-driven, cost-efficient models of service delivery brings aninevitable tension in keeping local people at the <strong>for</strong>efront of our thoughts and ourplans. In this climate we need to work particularly hard at valuing and sustainingthese relationships and ensuring they continue to be based on trust, respect,empathy and reciprocity.GIVE EVERY CHILD THE BEST START IN LIFEWhile data systems exist to look at progress, at a population level, on immunisation,breast feeding, and attainment at reception year of primary school, there are nosystems which enable the full picture to be obtained of the developmental progressof our children in the vital early years. Equally, the systems <strong>for</strong> tracking fidelity to the<strong>Health</strong>y Child Programme and fidelity to important <strong>for</strong>mal manual-based parentingprogrammes are not well developed. Undoubtedly, each individual child‟s progressis recorded in a health, education, children‟s centre record or parenting programmedatabase but the systems to extract this and examine progress across the childpopulation as a whole or <strong>for</strong> disadvantaged sub-groups of the population is notalways there. This is a priority <strong>for</strong> development. It is not a small job and will requiretime to implement. Nevertheless, we will not be able to assess whether ourinterventions in early years are producing the outcomes we desire if we do not havesystems to allow us to view progress.It has not been possible in the timescale <strong>for</strong> production of this strategy to amass dataon the relative spend on children in the early years versus spend on the school yearsand the adolescent years in <strong>Dudley</strong>. Marmot (<strong>2010</strong>) acknowledged that this is notwholly possible at national level either. However, it should be possible to at leastreproduce <strong>for</strong> <strong>Dudley</strong> an analysis of the type presented in the national data in theMarmot Review. It is recommended that investment in school and adolescent yearsshould be examined to see if there is any way in which efficiency can be improved torelease resource to be invested in the vital early years.<strong>Dudley</strong> has no structured intensive home visiting service, such as that deliveredwithin a Family Nurse Partnership Programme, though intensive family support isbeing delivered through children‟s social care, children‟s centres and the FamilyIntervention Programme to some of the Borough‟s most disadvantaged families. Afurther nurse based programme is essential <strong>for</strong> some families. Any investmentreleased from other areas <strong>for</strong> early years should be channelled into thecommissioning of a Family Nurse Partnership Programme <strong>for</strong> families on a definedset of eligibility criteria, with a clear means of auditing outcomes.The structured approach to implementation of <strong>for</strong>mal parenting programmes set outin <strong>Dudley</strong>‟s Parenting Support and Family Learning <strong>Strategy</strong> (<strong>Dudley</strong> Children‟sTrust, 2009) should continue but with full tracking of adherence to eligibility criteriawhich ensure that those who need them most get them. Impact in terms of outcomemeasures must be tracked.Undoubtedly, productivity would be improved and potentially some resourcereleased, if there was more <strong>for</strong>mal integrated working between the <strong>Health</strong> Visiting10
service the midwifery service and the Children‟s Centres, particularly between theoutreach workers and <strong>Health</strong> Visitors.Ensuring that paid parental leave is available <strong>for</strong> workers within <strong>Dudley</strong> may not bewithin the compass of the statutory agencies to deliver, but all statutory agenciesshould ensure that their own policies embrace this and economic regenerationinitiatives should promote this.Pre and immediately post-natal periods are crucial <strong>for</strong> a child‟s development and theimprovements required in the antenatal care service are highlighted in <strong>Dudley</strong>‟scomplementary Infant Mortality Reduction Action Plan. The action plan must beimplemented in full.Child care <strong>for</strong> working mothers with children aged 2 – 5 years can be extremelybeneficial but may not be benign if the child care is of a poor quality. Children whoexperience high quality early years childcare provision are well placed to achievebetter outcomes in school and beyond and develop better social emotional andcognitive abilities necessary <strong>for</strong> lifelong learning. Independent inspection dataidentifies that 81% of childcare providers in <strong>Dudley</strong> have achieved good oroutstanding grade. Quality assurance of the child care provision in <strong>Dudley</strong> remains ahigh priorityCREATE FAIR EMPLOYMENT AND GOOD WORK FOR ALLMaximising fair employment <strong>for</strong> all in <strong>Dudley</strong> has the potential <strong>for</strong> making a majorcontribution to a reduction in inequality of health outcomes. <strong>Dudley</strong> is currentlydeveloping a local economic strategy, designed to develop the local economy andmaximize employment. It will be important <strong>for</strong> this strategy to focus not only on totaljobs gained but also on attracting high quality jobs <strong>for</strong> <strong>Dudley</strong> people to access. Thefull set of measures to achieve this is being set out in the <strong>Dudley</strong> Local Economic<strong>Strategy</strong> and is not repeated here. For maximum impact on reducing healthinequalities <strong>Dudley</strong> needs to:Ensure that data systems <strong>for</strong> tracking the impact of economic strategyinitiatives use a consistent approach to assessment across the socialgradient.Ensure that public and private sector employers adhere to equality guidanceand legislation.Develop means of implementing guidance on stress management and theeffective promotion of wellbeing and physical and mental health at work, both<strong>for</strong> public sector and private sector employees.Consider the potential <strong>for</strong> incentivising employers to adapt jobs to providesuitable employment <strong>for</strong> lone parents, carers and people with physical mentalhealth problems.Ensure that <strong>Dudley</strong> participates to the maximum in any available wellevidenced active labour market programmes11
ENSURE A HEALTHY STANDARD OF LIVING FOR ALLAs things stand, the extent to which all people in <strong>Dudley</strong> will have disposable incomewhich provides sufficient <strong>for</strong> them to have a standard of living <strong>for</strong> a healthy life is verydependent on national policies adopted by central governments. In particular, theextent to which central governments are prepared to shift the taxation systemtowards being more progressive; the extent to which welfare policy initiatives aredesigned to remove the „cliff edge‟ and the extent to which measures areimplemented to ensure full take up of entitlement to state benefits.In the meantime, all public service agencies in <strong>Dudley</strong> should be ensuring that thoseeligible and entitled to benefit are receiving it.It is a legal requirement <strong>for</strong> the <strong>Dudley</strong> MBC to produce a strategy to reduce childand family poverty and the key actions <strong>for</strong> poverty reduction in <strong>Dudley</strong> are containedin that document and are not reproduced within the strategy. The Child and FamilyPoverty Reduction <strong>Strategy</strong> must be implemented in full.CREATE AND DEVELOP HEALTHY AND SUSTAINABLE PLACES ANDCOMMUNITIESThe creation of healthy, sustainable places and communities combined with themitigation of climate change can have an impact in reducing health inequalities.Good policies will include plans to increase opportunities <strong>for</strong> walking and recreationin green spaces, sporting and cultural facilities complementing strategies to reduceobesity and increase physical activity which contribute to improved mental andphysical health.The priorities <strong>for</strong> <strong>Dudley</strong> are:Increase opportunities <strong>for</strong> active travel across the social gradientMaintain access and quality of open and green spaces across the socialgradientContinue to improve the energy efficiency of housing and reducing fuelpovertySupport locally developed and evidence based community regenerationprogrammes that reduce barriers to community participation and reduce socialisolationSTRENGTHEN THE ROLE AND IMPACT OF ILL HEALTH PREVENTIONMost of the NHS budget is spent on treating illnesses which in many cases arepreventable. It is estimated that approximately 4% of the national NHS budget isspent on prevention and in times of economic pressure it is often the healthimprovement programmes that suffer because of the more immediate need to treatpeople who are ill. The evidence base <strong>for</strong> prevention is better developed in someareas than others; indeed the public health benefits <strong>for</strong> immunisation programmesand screening programmes are well established and there is strong evidence to12
support the prescribing of statins <strong>for</strong> lowering cholesterol and <strong>for</strong> the use <strong>for</strong> bloodpressure lowering medication in the treatment of heart disease.Interventions that rely on changing the behaviour of populations are also known towork, but they take a long time to become established and their impact may not beable to be measured <strong>for</strong> many years. The action plans <strong>for</strong> reducing mortality fromcardio-vascular disease, cancer, chronic obstructive pulmonary disease, which arethe three biggest causes of mortality in <strong>Dudley</strong>, are supported by actions that includeprimary and secondary prevention measures. Separate plans to reduce alcohol andtobacco consumption are included because of their known impact on mortality rates.Actions <strong>for</strong> Secondary Prevention Cardiovascular DiseaseReduction in the gaps between actual and expected prevalence <strong>for</strong> the keyvascular diseases via- The implementation of NHS health checks, to ensure a high uptake fromthose who are most at risk and more unlikely to take up a health checke.g. men, minority ethnic communities and low income groups. Targetedpromotions, out-reach services and case-finding especially in relation tohypertension should be part of this response.- Investigate practice outliers with low levels of prevalence <strong>for</strong> the CoronaryHeart Disease (CHD) and stroke registersVariation in per<strong>for</strong>mance across practices <strong>for</strong> treatment outcomes: Investigateper<strong>for</strong>mance <strong>for</strong> practice outliers starting with blood pressure and cholesterolmanagement.Develop an on-going programme of health equity audits supported by theincorporation of a health equity element into all planned primary care/serviceaudits. E.g. medicines management audits, service reviews, improvedethnicity monitoring across primary care/ community services.Put strategies in place to increase referrals to Lifestyle Risk ManagementService (LRMS) <strong>for</strong> those on practice registers and improve outcomes <strong>for</strong>patients from deprived areas.Develop and implement a self care strategy as part of the long term conditionsstrategy so there is a menu of quality assured options <strong>for</strong> all newly diagnosedvascular patients.Actions <strong>for</strong> Acute CHDThe National Support Team (NST) identifies a number of priority areas <strong>for</strong> action andthis section draws on those in conjunction with the main findings from the <strong>Health</strong>Needs Assessment:Introduce public awareness campaigns with a targeted approach to groups withhigher needs; over 65s, minority ethnic groups, women and deprived areas.<strong>Health</strong> care professionals should take every opportunity to advise all patients13
with, or at high risk of vascular disease to call 999 should they experienceunexplained chest pain.Continue to embed delivery of expanded services <strong>for</strong> acute myocardial infarction(MI) diagnostics and revascularisation and review the equity of provision in afurther 5 years time.Repeat the cardiac rehabilitation equity audit with larger numbers to establish afuller picture and implement recommendations made from this. This shouldinclude a review of Did Not Attends (DNAs) and Do Not Responds (DNRs) <strong>for</strong>cardiac rehabilitation and the establishment of routine procedure to follow-upthese groups.Actions <strong>for</strong> Acute Stroke/Transient Ischaemic Attacks(TIA)The NST identified a number of priority areas <strong>for</strong> action:Continue Facial weakness, Arm weakness, Speech problems, Time to call 999(FAST) awareness programmes with an emphasis on segmentation and use ofsocial marketing to ensure the message reaches all communities, to include thedevelopment of targeted campaigns <strong>for</strong> minority ethnic groups and the over 65sContinue implementation of current stroke/TIA workstreams to increase speed ofaccess to diagnostics and treatment to meet the national targets set out in theaccelerating stroke improvement programme in all cases, specifically:If any metrics remain significantly below target, consider equity auditing tocompare demographics of patients receiving optimum versus not optimum care.Audit GP TIA referrals data <strong>for</strong> consistencyReview GP practice per<strong>for</strong>mance <strong>for</strong> outlying practices in relation to admissionsdataActions <strong>for</strong> Chronic Obstructive Pulmonary Disease(COPD)Although the HINST did not hold a specific workshop on COPD when they visited us,they have since produced a series of recommendations on delivering bettermanagement of COPD based on the experiences of the Spearhead PCTs. Theserecommendations have been reviewed and concur with the COPD pathway that isimplemented in <strong>Dudley</strong>.The local priorities <strong>for</strong> development are:-As part of the National COPD <strong>Strategy</strong> and to increase prevalence numbers in<strong>Dudley</strong> a „Missing Millions‟ (previously undiagnosed COPD) pilot that hascommenced: Audit of 800 patients via GP surgeries, community pharmacists,<strong>Dudley</strong> Stop SmokingImplement the new NICE guidelines <strong>for</strong> COPD Mild, Moderate, Severe and VerySevereThere is an application via Strategic <strong>Health</strong> Authority (SHA) End of life work<strong>for</strong>ceprojects <strong>for</strong> an end of life care lead/nurse <strong>for</strong> COPDThere is a concerted focus to improve under diagnosis and increase prevalenceof asthma in <strong>Dudley</strong> via an education and training programme. There will also beactions to reduce the numbers of recurrent admissions with asthma14
Actions <strong>for</strong> tobacco controlThe NST identified a number of priority areas <strong>for</strong> action and an action plan has beendeveloped to be included ensure that they will <strong>for</strong>m part of the tobacco controlprogramme. The recommendations have been outlined in conjunction with currentlocal action and priorities:Strategic approach to Tobacco Control is best co-ordinated by an effectivemulti-agency partnership:- Continued strong senior level support and leadership <strong>for</strong> Tobacco Controlagenda- Review role of Tobacco Action Group (TAG)- TAG continued accountability to <strong>Dudley</strong> Community Partnership via the<strong>Health</strong> and Wellbeing Partnership- Refresh the Tobacco <strong>Strategy</strong> and action plan in line with new National<strong>Strategy</strong>- Development of advocacy role of the Alliance around Second HandSmoke and Illicit tobaccoFurther develop an evidenced based and proactive approach to illicit tobacco- Plan local prioritiesThe PCT, Acute Trust, Local Authority and other partners should exploreways in which data can be collected and shared to improve local intelligenceon key areas e.g. smoking in pregnancy, illicit tobacco, under age salesIntention to commission Environmental <strong>Health</strong> to carry out additionalsmokefree compliance checks in routine and manual workplaces to includeillicit tobacco and stop smoking in<strong>for</strong>mationThere would be a benefit in developing a programme of ongoing testpurchasing to explore the issue of supply of tobacco to young peopleThe early adoption of Department of <strong>Health</strong> Stop Smoking in Secondary Caretoolkit provides an opportunity to ensure effective care pathways are in place<strong>for</strong> smokers – this will impact on the key contributors to tackling healthinequalities.- This would also provide an opportunity to ensure a <strong>for</strong>mally agreed carepathway <strong>for</strong> smoking in pregnancy to be used by all staff.The Department of <strong>Health</strong> Stop Smoking Interventions in Primary Care toolkitis rolled out to ensure strengthened infrastructure <strong>for</strong> quality briefinterventions.All tobacco control initiatives will require senior level support and agreementbetween Primary and Secondary Care organisations to ensure a seamlessquality service <strong>for</strong> clients.It will be beneficial to have Varenicline as a first line smoking cessationmedication.Actions <strong>for</strong> alcohol harm reductionThe national health inequalities team have identified four key actions that will impacton health inequalities and result in both short term and longer term health gainsthrough:<strong>15</strong>
<strong>Tackling</strong> underage/illegal alcohol consumption and encouraging the industryto promote responsible drinkingCombating crime related disorderRaising awareness of, and educating about, safe and sensible drinkingFacilitating identification of at risk individuals and enabling access to alcoholtreatment services which are consistent with national standardsIn addition there is a commitment to implement the high impact changes thatare known to impact on reducing premature mortalityActions to reduce cancer inequalities:The key priorities <strong>for</strong> impacting on cancer inequalities are:Promote healthier lifestylesRaise awareness of cancer signs and symptoms and increase the uptakeof screening programmesReduce cancer waits <strong>for</strong> all patientsEnhance quality and timeliness of in<strong>for</strong>mationProvide financial and psychological supportIMPLEMENTING THE HEALTH INEQUALITIES STRATEGYSuch a broad ranging strategy can only be achieved by a whole range of partnersworking together in a co-ordinated and planned way. The strategy brings togethermany individual action plans that are already being delivered through existing multiagencypartnerships.The progress on reducing health inequalities is currently overseen by the <strong>Health</strong>Improvement Modernisation Management Team (HIMMT) which reports to the<strong>Health</strong> and Wellbeing Board, which in turn reports to <strong>Dudley</strong> Community Partnership.Independent scrutiny of the strategy is done by the <strong>Health</strong> Overview and ScrutinyCommittee. It is likely that these structures will change in the future and a newlystructured <strong>Health</strong> and Wellbeing Board will take responsibility <strong>for</strong> monitoring healthimprovement plans and reducing health inequalities.There are important roles <strong>for</strong> all statutory agencies. Local Authority directorates,including Adult Social Care, Children‟s Services, Environmental <strong>Health</strong> and Housingwill take a lead role in delivery of the strategic aims and the Local Authority willensure the involvement of the new GP Commissioning Cluster in implementing thestrategy when its new public health role becomes functional. The prevention role ofthe Foundation Trust needs to be developed as they become the providers of somecommunity health services and the work on developing the role of the third sectorneeds to be advanced. As part of the Big Society vision the role of Community<strong>Health</strong> Champions, Public <strong>Health</strong> Volunteers and <strong>Health</strong> Trainers will become moreprominent over time.The role <strong>for</strong> Community Engagement and consultation will remain an importantfeature in delivering this strategy and will influence the priorities and future direction16
of the work. The development of the strategy has been in<strong>for</strong>med by a comprehensivejoint strategic needs assessment.17
2. VISION STATEMENTThe mission statement of <strong>Dudley</strong> <strong>Health</strong> and Well-being Partnership:„‟We will work together to improve the health and well-being of thepopulation of <strong>Dudley</strong> and reduce the gap in health inequalities toimprove life expectancy and health outcomes <strong>for</strong> all by 20<strong>15</strong>‟‟.Our vision <strong>for</strong> our services as a <strong>Dudley</strong> <strong>Health</strong> and Well-being Partnership is that wewill:1. Listen to the needs of our local population and promote good health and wellbeing<strong>for</strong> all through effective commissioning <strong>for</strong> health improvement.2. Meet the health and social care needs of our most vulnerable residents.3. Recognise the diversity of local needs and empower individuals andcommunities to take responsibility <strong>for</strong> their health and well-being by targetingresources effectively.4. Ensure that the citizens of <strong>Dudley</strong> receive quality local services that will protectand care <strong>for</strong> the vulnerable and those at risk from harm.5. Improve the health of all children and the life chances of looked after childrenand care-leavers as a result of stronger partnership working.6. Promote enhanced citizenship and improve the ordinary life experiences ofolder people.7. Improve mental health and well-being and actively promote independence andsocial inclusion.8. Encourage and support innovation in developing better services <strong>for</strong> <strong>Dudley</strong>people through developing and supporting our work<strong>for</strong>ce.18
3. INTRODUCTIONBackgroundDifferences in health status and life expectancy between the wealthiest and thepoorest in society are not a new phenomenon. Identifying differences in lifeexpectancy according to social status has been done <strong>for</strong> at least two hundred years.The real concern is that these differences have persisted despite the dramatic fall inmortality rates over the last decade, brought about by improvements in medicinesand treatment and an improvement in living standards.Although life expectancy has increased, healthy life expectancy, described as themeasure of average length of life free from ill health and disability, has not increased.The number of years gained have been years living with a chronic disease ordisability. So not only do poorer people have a shorter life expectancy they can alsoexpect to spend more of their shorter lives with a disability.The health gap between socioeconomic groups cannot simply be explained by „bad‟health behaviours in the lower social classes and poorer access to services,although they do play an important part. The gap is caused by social and economicinequalities in the conditions in which people are born, grow, live, work and age andthe drivers that give rise to them, which are inequities in power, money andresources (Marmot, <strong>2010</strong>). Reducing health inequalities requires national action onsocial, economic and health policy and local action by local government, the NHS,the voluntary sector, the private sector and local communities.The policy contextIn 1998 Sir Donald Acheson published the Independent Inquiry into <strong>Inequalities</strong> in<strong>Health</strong> (Acheson, 1998) which emphasised the importance of social conditionsthroughout the course of life and its impacts on health outcomes. He identified threeimportant priorities: To assess the impact on health inequality of all health policies To give priority to women of child bearing age, expectant mothers and youngchildren To reduce the gap in living standards between the worst off and the averageThe government‟s response to the Acheson report was a national health inequalitiesstrategy, <strong>Tackling</strong> <strong>Health</strong> <strong>Inequalities</strong>: A programme <strong>for</strong> action (Great Britain.Department of <strong>Health</strong>, 2003). The national strategy had twin aims: to deliver anational health inequalities target by <strong>2010</strong> (reducing inequalities in infant mortalityand life expectancy at birth) and to support a long term sustainable reduction inhealth inequalities. In 2003, following a review, a new funding <strong>for</strong>mula was approvedwhich included a specific allocation <strong>for</strong> health inequalities.2004 saw the release of Choosing <strong>Health</strong>: Making healthy choices easier. (GreatBritain. Department of <strong>Health</strong>, 2004) which set out the national strategy <strong>for</strong> improvinghealth. Reducing health inequalities was included in the 2004 NHS planningguidance. The following year „Spearhead‟ authorities were established in order to19
tackle health inequalities in the twenty most deprived PCTs. These PCTs receivedadditional funding in addition to the Choosing <strong>Health</strong> allocations. <strong>Dudley</strong> was not aSpearhead authority.<strong>Dudley</strong>‟s response was to produce its own strategy, Closing the gap – <strong>Tackling</strong><strong>Health</strong> <strong>Inequalities</strong> in <strong>Dudley</strong> (<strong>Dudley</strong> MBC and <strong>Dudley</strong> PCT, 2005). This strategyreflected the current policy and thinking at the time and reflected the national targets:Starting with children under one year, by <strong>2010</strong> to reduce by at least 10% thegap in mortality between manual groups and the population as a wholeStaring with local authorities, by <strong>2010</strong>, to reduce by at least 10% the gapbetween the fifth of areas with the lowest life expectancy at birth and thepopulation as a wholeAt the time of writing it seems that we are unlikely to have achieved these targets.<strong>2010</strong> data is not yet available but the gap in life expectancy has not narrowed overthe last ten years and may in fact be increasing slightly.Three local priorities were chosen based on national evidence <strong>for</strong> what works, localneeds and views expressed by the community.The priorities were:Reduce povertyDevelop a joint anti-poverty action plan that maximises the potential <strong>for</strong> all agenciesto reduce povertyOutcomesAn anti-poverty strategy was produced in 2006/07 and has been implementedin partTobacco controlSupport and implement a „smoke free generation‟ programme in <strong>Dudley</strong> with a focuson deprived areasOutcomesThe smoke free generation programme has been very successful and has madesubstantial progress in:Reducing exposure to second hand smokeReducing tobacco promotion by en<strong>for</strong>cing legislationEnsuring compliance with relevant tobacco regulation legislationReducing availability and supply of illegal tobacco productsStop smoking services have increased and have focused on deprived areas,vulnerable groups, pregnancy and the early yearsSuccessful media campaigns have been implemented and evaluatedpositively20
Improve educational attainmentAction to increase the educational attainment, aspirations, life skills of adults,children and young people in deprived areas and of key vulnerable groups throughthe implementation of Every Child MattersGood progress has been made in:Implementing the Children‟s Centres programmeImplementing the Extended Schools programmeFurther develop the <strong>Health</strong>y Schools programme (100% achievedaccreditation)Focusing on parenting skills and family support networksGreater focus on vulnerable children e.g. looked after children, teenagemothers<strong>Tackling</strong> health inequalities beyond <strong>2010</strong>The previous strategy was due to be refreshed in <strong>2010</strong>. In July 2009 the <strong>Health</strong><strong>Inequalities</strong> National Support Team (HINST) visited <strong>Dudley</strong> to assess how we wereprogressing in reducing health inequalities. They had amassed a wealth ofexperience in assessing the Spearhead PCTs and the evidence base <strong>for</strong>interventions known to impact on reducing health inequalities had been developedas a result of the Spearheads‟ work.The team assessed our per<strong>for</strong>mance in a number of areas and maderecommendations <strong>for</strong> us to consider and implement. This strategy refresh focuses onthose recommendations and brings together a number of different strategies andplans from across organisations that impact on health inequalities. There was also aper<strong>for</strong>mance review by the Strategic <strong>Health</strong> Authority late in 2009, followed by adesk top review undertaken by the Audit Commission earlier in <strong>2010</strong>. The findings ofall the reviews were generally very positive with some helpful suggestions on wherethe focus of our ef<strong>for</strong>ts <strong>for</strong> greatest impact over the next five years should be.HINST recommendations <strong>for</strong> five key priority actions <strong>for</strong> <strong>Dudley</strong>Strengthening leadership <strong>for</strong> health and health inequalities across thepartnership and particularly within the Local Authority and Acute Trust.Improving the quality and capacity of primary care.Refreshing the <strong>Health</strong> <strong>Inequalities</strong> <strong>Strategy</strong>, developing detailed delivery plansand agreeing a common frame of reference <strong>for</strong> monitoring progress onaddressing health inequalities.The continued market development of the voluntary, community and faithsector.The simplification of neighbourhood community engagement structures.21
These recommendations are addressed throughout the document and theproduction of this refreshed strategy is the result of one of their recommendations.STRATEGIC AIMSThe main policy driver <strong>for</strong> this strategy is the Marmot Review, Fair Society, <strong>Health</strong>yLives (Marmot, <strong>2010</strong>) which is the biggest review of <strong>Health</strong> <strong>Inequalities</strong> since theAcheson report in 1998. As well as focusing on the causes of mortality; heartdisease, cancer, chronic obstructive pulmonary disease, and the causes of thediseases, smoking, alcohol, physical activity and nutrition, Marmot also drawsattention to the „causes of the causes‟ of disease which are the social determinantsof ill health. He has identified a number of policy areas that directly impact on healthinequalities and we have adapted these to become the strategic aims of thisrefreshed strategy. Give every child the best start in life Create fair employment and good work <strong>for</strong> all Ensure a healthy standard of living <strong>for</strong> all Create and develop healthy and sustainable places andcommunities Strengthen the role and impact of ill health preventionThe following chapters address all of these key issues and there are a series ofrecommendations and delivery plans that show how we intend to address theseproblems over the next five years.22
4. HEALTH INEQUALITIES AND THE SOCIAL DETERMINANTS OF HEALTHSOCIAL DETERMINANTS OF HEALTH„Social determinants‟ are those economic and social conditions which shape thehealth of individuals and communities as a whole. Often referred to as „the causesof the causes‟ of ill health, they have an important and substantial influence on theexistence and distribution of inequalities in health. The most recent and definitivereview to date of social determinants of ill health in England is that undertaken by SirMichael Marmot (<strong>2010</strong>) in his review Fair Society, <strong>Health</strong>y Lives whose report toGovernment was published in February <strong>2010</strong>. Marmot sets out some keyprinciples:- „Serious health inequalities do not arise by chance and cannotbe attributed simply to genetic make up, „bad‟, unhealthybehaviour or difficulties in access to medical care, thoughthese factors remain important. Social and economicdifferences in health status reflect and are caused by socialand economic inequalities in society.‟- „<strong>Health</strong> inequalities that are preventable by reasonable meansare unfair and correcting them is a matter of social justice‟.- „Action should be taken across the social gradient and shouldnot be aimed at the most worst off (proportionateuniversalism).‟- „<strong>Tackling</strong> health inequalities means tackling climate change.Actions to create a sustainable future will have health benefitsacross society.‟Addressing <strong>Inequalities</strong><strong>Inequalities</strong> exist in many contexts <strong>for</strong> individuals, groups and communities whetherrelated to broad socio-economic factors such as poverty and unemployment, or withregard to age, culture, disability, ethnicity, gender, race, religion, sexual orientation,spirituality or any other status. The socio economic position of individuals andfamilies shapes their access to material resources, to every aspect of experience inthe home, neighbourhood, and workplace and is a major determinant of healthinequalities.If wellbeing can be defined as, „a positive state of mind and body, feeling safe andable to cope, with a sense of connection with people, communities and the widerenvironment‟ (Great Britain. Department of <strong>Health</strong>, 2009c), then poor physical healthis a significant risk factor <strong>for</strong> poor mental health. Conversely, mental well-beingprotects physical health and improves health outcomes and recovery rates,particularly <strong>for</strong> coronary heart disease and stroke. Evidence shows that poor mentalhealth results in poor self-management of chronic illness and is also linked to arange of health damaging behaviours, such as smoking, drug and alcohol abuse,poor diet and unwanted pregnancy (NMHDU, <strong>2010</strong>). High levels of inequality, social23
injustice and deprivation impact negatively on mental health and wellbeing, thusreducing individual and community resilience to cope positively with life‟s changes,challenges, and adversities (Friedli 2009, Foresight Project Report, 2008). Certaingroups often referred to as marginal, vulnerable or socially excluded groups andcommunities, are there<strong>for</strong>e more at risk of experiencing inequalities in health.Equality is about creating a fairer society where everyone can participate and hasthe opportunity to fulfil their potential, and social inclusion is the process by whichef<strong>for</strong>ts are made to ensure that everyone, regardless of their experiences andcircumstances, can achieve their potential in life. Under the new Equality Act <strong>2010</strong>which became law in October <strong>2010</strong> and covers the same groups that were protectedby previous equality legislation (age, disability, gender reassignment, marriage andcivil partnership, pregnancy and maternity, race, religion or belief, sex, sexualorientation), public bodies are accountable in terms of the equality and diversityagenda with clear duties to work towards eliminating discrimination and promotingequality of opportunity.A social gradient in health exists in that, better social and economic position resultsin better health (Marmot, <strong>2010</strong>). Marmot advocates a universal approach which alsorecognises the need <strong>for</strong> „a greater intensity of action‟ <strong>for</strong> those at „greater social andeconomic disadvantage‟. Some groups and communities experience limited or noaccess to a wide range of support, <strong>for</strong> example, older people, children and youngpeople, homeless people, people from minority ethnic communities, asylumseekers/refugees, economic migrants, prisoners, single parents, carers, looked afterchildren, mental health service users, people with physical/learning disabilities, gay,lesbian, bisexual and transgender peoples, and many others who are vulnerable andat risk. This is not a definitive list by any means and may vary depending on theparticular strategy, policy or service, but it gives an idea of which communities mayneed to be targeted to make a real difference to health inequalities.Key issues that have been identified in relation to work with all vulnerable groupsinclude, improving data collection and analysis, scoping of services to identify gaps,improving access, developing culturally relevant services, and working to eliminatestigma and discrimination. Strategies <strong>for</strong> health and wellbeing need to consider theseissues from the outset, and services need to address them in planning, development,delivery and review, in order to mainstream and integrate the diverse needs of alocal community.In this section of the strategy, the evidence from the Marmot Review is summarised;selected data available on the position in <strong>Dudley</strong> is presented; and finallyrecommendations are made on what needs to happen in <strong>Dudley</strong>.Based on Marmot‟s assessment of key policy areas to impact on the socialdeterminants of health, 4 areas are examined here <strong>for</strong> <strong>Dudley</strong>;- Early years; giving every child the best start in life.- Fair employment and good work <strong>for</strong> all.- A healthy Standard of Living- <strong>Dudley</strong> as a healthy and sustainable place.24
THE EARLY YEARS: GIVING EVERY CHILD THE BEST START IN LIFEEarly Years: What does the evidence tell us?A child‟s physical, social and cognitive development during the early years stronglyinfluences their school readiness and educational attainment, economic participationand health. It is demonstrated in the literature that in-utero environments affect adulthealth and that these programmed changes may be the origins of a number ofdiseases in later life. Low birth weight in particular is associated with poorer longterm health outcomes and disadvantaged mothers are more likely to have babies oflow birth weight. Maternal health including stress, diet, drug, alcohol and tobaccouse during pregnancy influences foetal and early brain development. The biologicaleffects of birth weight on brain development interact with other social positioninfluences to impact on cognitive development.The first year of life is crucial. Neuro-development during this time provides thefoundation <strong>for</strong> children‟s cognitive capacities and if they fall behind at this stage theyare more likely to fall further behind at subsequent educational stages. Poordevelopment of cognitive ability has been shown to be a powerful determinant notonly of earnings but of propensity to get involved in crime. It is likely that a levellingup of cognitive function across the social gradient will lead to narrower socialinequalities in health.Similarly, the early years are important <strong>for</strong> the development of non-cognitive skills(application, self regulation and empathy). If these skills are not developed, childrenfail to develop the capabilities that enable them to make and sustain positiverelationships as they grow up into the school years and in later life. Pre-schoolinfluences remain evident even after 5 years spent in full time primary school.Children who do not develop fully in the early years are not „school ready‟ and thisimpacts on their subsequent educational attainment and hence economicparticipation and health. Children of educated or wealthy parents may score poorlyin tests but will still catch up, whereas children with worse off parents are veryunlikely to do so and there is no evidence that early entry into schooling reverses thispattern.The key set of interacting factors which impact on educational outcomes are:-‣ birth weight‣ post-natal depression‣ being read to every day‣ having a regular bed time at age 3Reviewing the evidence of effectiveness of interventions, Marmot (<strong>2010</strong>) concludesthat the following are the key requirements <strong>for</strong> England:- Increasing the proportion of overall expenditure allocated to the earlyyears and ensuring that it is focused progressively across the socialgradient.25
- Giving priority to pre and post-natal interventions such as intensivehome visiting programmes (eg. family nurse partnership) that reduceadverse outcomes of pregnancy in infancy).- Providing paid parental leave in the first year of life with a minimumincome <strong>for</strong> healthy living.- Providing support to families through evidence based parentingprogrammes.- Developing programmes <strong>for</strong> the transition to school.Early Years; What Do We Know About <strong>Dudley</strong>?Maternal health and antenatal care:There is an apparently high rate of late booking <strong>for</strong> antenatal care in <strong>Dudley</strong>especially among women from minority ethnic communities. Data from <strong>Dudley</strong>Group of Hospitals Foundation Trust and Royal Wolverhampton NHS Trust indicatesthat in 2009-10 only 64% of pregnant women had had an assessment of their healthand social care risks and needs by 13 weeks.<strong>Dudley</strong>‟s smoking in pregnancy rate at the time of birth is not different from the WestMidlands average and is declining, but in 2009/10 there were almost a fifth ofmothers (18.3%) smoking at delivery.Under 18 conception rate <strong>for</strong> <strong>Dudley</strong> is declining but remains above the Englandrate. The under 18 years conception rate <strong>for</strong> the three years 2004-2006 was 47.7per 1.000. There were 819 conceptions over the three years, 53% of which werebirths (435). So there are an average of 145 births to teenage mothers in <strong>Dudley</strong>each year.26
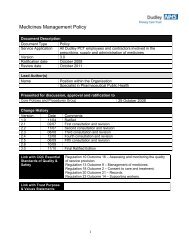
Low birthweight:Figure 1Low Birth Weight Births, All Maternal Ages, 2008ENGLAND ANDWALESWEST MIDLANDS<strong>Dudley</strong>BirminghamSandwellSolihullWalsallWolverhampton0.0 2.0 4.0 6.0 8.0 10.0 12.0% of Live and Still Births
Percentage of live and still births199419951996199719981999200020012002200320042005200620072008Percentage of live and stillbirths
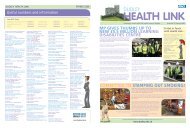
Number of Pupils AchievingEarly cognitive development:Although the <strong>Health</strong>y Child Programme <strong>for</strong>ms the basis <strong>for</strong> the <strong>Dudley</strong> Antenatal,Neonatal and Child <strong>Health</strong> Surveillance Protocol, (implemented across <strong>Dudley</strong> withthe <strong>Health</strong> Visitor as the lead professional), there are no audits currently availablewhich give an indication of the level and distribution of cognitive development acrossthe early years child population in <strong>Dudley</strong>. Indeed, to date, the computerised recordsystems available have not even allowed fidelity to the protocol to be audited, as therequisite patient based system with appropriate coding has not been in place.Data on children‟s attainment at the Early Years Foundation Stage (EYFS), which isassessed at reception year in primary school, is available. The data <strong>for</strong> <strong>Dudley</strong>children <strong>for</strong> 2009 show a skewed distribution (Figure 5)Figure 5EYFSP 2009 <strong>for</strong> <strong>Dudley</strong>1<strong>2010</strong>08060402001 5 9 13 17 21 25 29 33 37 41 45 49 53 57 61 65 69 73 77 81 85 89 93 97 101 105 109 113 117EYFSP Total ScoreHowever, if the distributions are looked at by IMD quintile there is evidence of asocial gradient in median scores29
EYFS Median Scores by National Deprivation Quintile <strong>Dudley</strong>2009Q1 Q2 Q3 Q4 Q580 82 89 89 90Source DMBCThere is a difference of 10 in the median score between quintile 1, the most deprivedand quintile 5, the least deprived.Whilst there is an assessment <strong>for</strong> EYFS undertaken pre-school, there is no centralcollection of data on this so it is not possible to assess the profile <strong>for</strong> <strong>Dudley</strong> childrenat this pre-school stage.Parenting:<strong>Dudley</strong> has developed a multi-agency Parenting Support and Family Learning<strong>Strategy</strong> (<strong>Dudley</strong> Children‟s Trust, 2009) and in the development of this undertook anaudit of <strong>for</strong>mal manual-based parenting support within the Borough.The audit of parenting support was carried out and sought to find out the extent towhich practitioners had been trained in and implemented programmes at 4 levels ofsupport need:Tier 1 Universal need: prevention focused on whole population whereproblems are not obvious (67,196 dependent children)Tier 2 Need <strong>for</strong> support: problems may be beginning to show and action isneeded to prevent them worsening (24,245 children in 2008)Tier 3 Child Welfare Concern: prevention strategies required to focus onmultiple, complex and longstanding difficulties requiring individually tailoredservices (2055 children in need in June 2008)Tier 4 Protection need: prevention at this level requires clear interagencyfocus which seeks to safeguard the child/young personThe audit of parenting support offered by providers was carried out and its keyfindings were:Tier 1 - All Children‟s Centres offer a universally available parenting programme,most commonly the NCH Handling Children‟s Behaviour (Finch, 1995). Someschools also offer this programme but coverage is patchy. <strong>Dudley</strong> PCT Children‟sservices staff are trained in the Solihull Approach, as are teachers in the SpecialistEarly years Service and many Children‟s Centre staff. Some Children‟s Centres usethe Family Links Nurturing Programme. All schools were planning to offer FamilySEAL (Social and Emotional Aspects of Learning) by 2011.30
Tier 2 - There is a gap in availability of Tier 2 <strong>for</strong>mal parenting programmes. WhereChildren‟s Centres or schools identify that parents have Tier 2 needs the practice isto encourage parents to attend Tier 1 programmes and provide some additionalsupport during and after the programme.At Tiers 3 and 4 - the DMBC Senior Parenting Practitioner delivers the Triple Pparenting programme, working in close co-operation with a range of multi-agencyservices. The Senior Parenting Practitioner is also trained in Webster Stratton andStrengthening Families and Communities, so is able to select from a menu ofprogrammes.There is no readily available data on the numbers of families in receipt of theseprogrammes, the numbers of sessions delivered or outcome of intervention.All parenting programmes should include the key components recommended byNICE (National Institute <strong>for</strong> <strong>Health</strong> and Clinical Excellence, 2006) and there shouldbe clear eligibility criteria, fidelity to the programme and delivery at the correctintensity. There are currently no systems in place which allow a regularaudit/assessment of these items. Ensuring that the investment in parentingprogrammes is effective will require these.Surestart Children’s Centres:These centres are intended to be service hubs where children under 5 and theirfamilies receive integrated services and in<strong>for</strong>mation. Children‟s Centres across theBorough provide access to a range of services.While the <strong>Health</strong> Visiting Service now has a named <strong>Health</strong> Visitor relating to each ofthe Children‟s Centres, fully integrated working remains underdeveloped. The earlyyears‟ work<strong>for</strong>ce may not be being used to maximum effect.There is no intensive home visiting support service (such as the evidence –basedFamily Nurse Partnership recommended by Marmot).<strong>Dudley</strong> provides a web-based Children and Young People‟s Service Directory andgives access to in<strong>for</strong>mation on support the parents can access <strong>for</strong> their families.There are 50 in<strong>for</strong>mation champions based in children‟s centres and neighbourhoodlearning facilities and contributing to the <strong>Dudley</strong> Families In<strong>for</strong>mation Services.Paid Parent Leave During the First Year:For 1- 5 year olds there are no adverse effects of maternal employment on cognitivedevelopment, but if children are in poor quality child care <strong>for</strong> long hours there may besome negative effects on behaviour. Changes in parental employment patterns arenot inevitably benign and there is some work linking maternal employment to lowerlevels of breast feeding, increased levels of obesity at 3 years and poorer indicatorsof diet and physical activity at 5 years. Paid parental leave is associated with lowerrates of maternal depression, lower rates of infant mortality, fewer lower birth ratebabies, more breast feeding and more use of preventive healthcare. There is no31
data which shows us locally what access parents across the social gradient have topaid parental leave during the first years of their children‟s life.Early Years: What Needs to be Done in <strong>Dudley</strong>?While data systems exist to look at progress, at a population level, on immunisation,breast feeding, and attainment at reception year of primary school, there are nosystems which enable the full picture to be obtained of the developmental progressof our children in the vital early years. Equally, the systems <strong>for</strong> tracking fidelity to the<strong>Health</strong>y Child Programme and fidelity to important <strong>for</strong>mal manual-based parentingprogrammes does not exist. Undoubtedly, each individual child‟s progress isrecorded in a health, education or children‟s centre record but the systems to extractthis and examine progress across the child population as a whole or <strong>for</strong>disadvantaged sub-groups of the population is not there. This is a priority <strong>for</strong>development. It is not a small job and will require time to implement. Nevertheless,we will not be able to assess whether our interventions in early years are producingthe outcomes we desire if we do not have systems to allow us to view progress.It has not been possible in the timescale <strong>for</strong> production of this strategy to amass dataon the relative spend on children in the early years versus spend on the school yearsand the adolescent years in <strong>Dudley</strong>. Marmot (<strong>2010</strong>) acknowledged that this is notwholly possible at national level either. However, it should be possible to at leastreproduce <strong>for</strong> <strong>Dudley</strong> an analysis of the type presented in the national data in theMarmot Review. It is recommended that investment in school and adolescent yearsshould be examined to see if there is any way in which efficiency can be improved torelease resource to be invested in the vital early years.<strong>Dudley</strong> has no structured intensive home visiting service, such as that deliveredwithin a Family Nurse Partnership Programme. This is essential <strong>for</strong> some families.Any investment released from other areas <strong>for</strong> early years should be channelled intothe commissioning of a Family Nurse Partnership Programme <strong>for</strong> families on adefined set of eligibility criteria, with a clear means of auditing outcomes.The structured approach to implementation of <strong>for</strong>mal parenting programmes set outin <strong>Dudley</strong>‟s Parenting Support and Family Learning <strong>Strategy</strong> (<strong>Dudley</strong> Children‟sTrust, 2009) should continue but with full tracking of adherence to eligibility criteriawhich ensure that those who need them most get them Impact in terms of outcomemeasures must be tracked.Undoubtedly, productivity would be improved and potentially some resourcereleased, if there was more <strong>for</strong>mal integrated working between the <strong>Health</strong> Visitingservice and the Children‟s Centres, particularly between the outreach workers and<strong>Health</strong> Visitors.Ensuring that paid parental leave is available <strong>for</strong> workers within <strong>Dudley</strong> may not bewithin the compass of the statutory agencies to deliver, but all statutory agenciesshould ensure that their own policies embrace this and economic regenerationinitiatives should promote this.32
Pre and immediately post-natal periods are crucial <strong>for</strong> a child‟s development and theimprovements required in the antenatal care service are highlighted in <strong>Dudley</strong>‟scomplementary Infant Mortality Reduction Action Plan. The action plan must beimplemented in full.Child care <strong>for</strong> working mothers with children aged 2 – 5 years can be extremelybeneficial but may not be benign if the child care is of a poor quality. Qualityassurance of the child care provision in <strong>Dudley</strong> remains a high priority.FAIR EMPLOYMENT AND GOOD WORK FOR ALLFair Employment and Good Work <strong>for</strong> All: What Does the Evidence Tell Us?The evidence presented in the Marmot (<strong>2010</strong>) report shows clearly that patterns ofemployment reflect and rein<strong>for</strong>ce the social gradient. Unemployment is unequallydistributed across socio-economic groups, with those in the lower groups at higherrisk. Unemployment has both short term and long term impact on health. Whilethere are immediate adverse health consequences of being made redundant, studieshave shown steady negative effects proportional to the duration of unemploymentwhich damage health progressively. Long term unemployment has the greatestadverse effect on health. Unemployment has been consistently associated with anincrease in overall mortality and, in particular, suicide. The unemployed have muchhigher use of medication and much worse prognosis and recovery rates.Marmot (<strong>2010</strong>) suggests 3 ways in which unemployment affects levels of morbidityand mortality.‣ Loss of employment leads to lower living standards which may reduce socialintegration and lower self esteem.‣ Unemployment as a trigger <strong>for</strong> distress, anxiety and depression.‣ Negative impact on health behaviour which is associated with increasedsmoking and alcohol consumption and decreased physical exercise.Conversely limiting illness and disability can lead to a higher risk of unemployment,though the extent to which these act as a barrier to work is dependent oneducational qualifications.The evidence reviewed by Marmot leaves little doubt that recent rises inunemployment, and particularly youth unemployment, are likely to significantlyworsen health inequalities. This makes getting people into employment an importantstrategy <strong>for</strong> improving health and reducing inequalities.However, it is only an effective strategy if working conditions are good. Exposure tophysical hazards, physically demanding or dangerous work, long or irregular workinghours or health adverse posture at work can all adversely affect health. Poorworking conditions are most prevalent amongst those in „precarious jobs‟ that aredefined by a lack of safety at work, by exposure to multiple stresses includingstrenuous tasks which the worker has little control over, low wages and high job33
instability. Factors such as job security, job satisfaction, supervisor and peersupport, are related to both psychological and physical health impacts includingdepression, cardiovascular disease, coronary heart disease and musculo-skeletaldisorders.Psycho-social hazards of low worker control, having a large number of demands andlittle support at work combine these factors into „isostrain‟. Work stresses measuredby isostrain have been shown to increase the risk of the metabolic syndrome (acombination of risk factors <strong>for</strong> diabetes and heart disease).On the basis of the evidence reviewed, Marmot (<strong>2010</strong>) concludes that getting peopleinto work is of critical importance <strong>for</strong> reducing health inequalities but these jobs needto be sustainable and offer a minimum level of quality including not only a decentliving wage but opportunities <strong>for</strong> in-work development and flexibility to balance workand family life with protection from adverse working conditions that can damagehealth.The importance of getting people into work has been recognised <strong>for</strong> almost twodecades now by policy makers and a variety of schemes referred to as „active labourmarket programmes‟ have been implemented to integrate the unemployed into work,rather than simply providing passive income support when people are out of work.The Marmot Review (<strong>2010</strong>) of effectiveness shows that active labour marketprogrammes implemented since the middle 1990s have had some success in termsof labour market outcomes. It is of particular note that the groups <strong>for</strong> whom noprogramme of assistance was available over this period, young people aged 16 and17, saw unemployment rise steadily even through a period of economic growth. 1 in4 of the economically active in this age group was unemployed in 2007. The currentrecession obviously poses a major threat <strong>for</strong> progress made up until 2007.There is some evidence that active labour market programmes have contributed toincreasing income amongst recipients, though they are most effective whencombined with other fiscal and benefit measures to „make work pay‟. There hasbeen little research on the subsequent effect of those improved labour marketoutcomes on health outcomes. There is some limited evidence that participation ingovernment training programmes can have positive effect on the psychologicalhealth and subjective wellbeing of the participants compared with unemployedpeople not involved in such programmes. The effects of active labour marketprogrammes seem to vary in relation to a range of individual factors including theinitial attitude of participants to work („job readiness‟) and the effectiveness of theirallocated advisors. The evidence <strong>for</strong> a positive impact of active labour marketprogrammes <strong>for</strong> people with mental health difficulties is much stronger. Vocationalrehabilitation services, particularly individual placement and support services (IPS)can significantly increase rates of employment <strong>for</strong> those with mental illness.34
PercentageFair Employment and Good Work <strong>for</strong> All: What do we know <strong>for</strong> <strong>Dudley</strong>?As elsewhere, unemployment levels in <strong>Dudley</strong> reflect the prevailing economicconditions. Figure 1 shows unemployment levels from 1992 - <strong>2010</strong> as measured byJob Seekers Allowance (JSA) claimants. (Note from August 10 th <strong>2010</strong> all ratesdownloaded are as % of age 16-64 <strong>for</strong> males and females previously age 16-64 <strong>for</strong>men and 16-59 <strong>for</strong> women thus the percentage shows a reduction from previouslevels).Figure 1People claiming Job Seekers Allowance as a percentage of the working-agepopulation (aged 16-64), 1992 - <strong>2010</strong>10987<strong>Dudley</strong>West MidlandsGB6543210Apr-1992 Jan-1998 Oct-2003 Jul-2009Source: ONS claimant count NomisNote: % is a proportion of resident population of area aged 16-64The impact of the most recent recession has been sharper in <strong>Dudley</strong> than in theWest Midlands and Great Britain.If this is analysed by deprivation quintile (Figure 2) it can be seen that since May2008, there has been an increasing trend in the proportion of people claiming JSAacross all deprivation quintiles, but this trend increased at a faster rate in the moredeprived areas. There has been an increase of over 3% in the most deprivedquintile, compared with an increase of 1.5% in the least deprived quintile over thesame time period from May 2008 to May 2009.35
Proportion of population claiming Job seekers allowanceFigure 2Proportion of Working Age Population of <strong>Dudley</strong> Claiming Job Seekers Allowance byIndex of Multiple Deprivation (IMD) 2007 National Quintile of Residence10%9%8%7%6%5%4%3%2%1%0%IMD1 (most deprived) IMD2 IMD3 IMD4 IMD5 (least deprived)The spatial distribution of unemployment, as measured by key out of work benefits,is shown in Figure 3.36
Figure 3Proportion of the working-age population who are in receipt of key out-of-workbenefits <strong>for</strong> <strong>Dudley</strong> (Feb 2009)XXXXIn the highest 1,677 wards <strong>for</strong> Great Britain as a whole (i.e. highest sixth of wards)In the next 1,677 wards (i.e. second sixth)In the next 1,677 wards (i.e. third sixth)below the Great Britain average - remaining 5,033 wardsSource: Poverty.org.uk (accessed 02/08/<strong>2010</strong>)Data on the impact of all of the most recent Active Labour Market Policy (ALMPs) onlabour market outcomes <strong>for</strong> residents of <strong>Dudley</strong> is not readily available and it has notbeen possible to assess their success or otherwise at a working population level.37
Data is available <strong>for</strong> those ALMPs <strong>for</strong> which <strong>Dudley</strong> MBC is the provider and <strong>for</strong> therecently completed Local Area Agreement (LAA). (<strong>Dudley</strong> Community Partnership,2008). The results <strong>for</strong> the LAA undertaken over the 3 years 2007-08 to 2009-10 areshown in Table 1 below.Table 138
At the time of writing 2 ALMP schemes are being delivered through <strong>Dudley</strong> MBC –the Future Jobs Fund and the Flexible New Deal. It aims to create <strong>15</strong>0,000 jobs.The Future Jobs Fund is a fund of around £1 billion nationally to support the creationof jobs <strong>for</strong> long term unemployed young people and others who face significantdisadvantage in the labour market.The Fund was announced in Budget 2009. As the Future Jobs Fund is a challengefund, not all organisations that submitted bids were successful. The fund is run bythe Department <strong>for</strong> Work and Pensions (DWP) in partnership with the Department <strong>for</strong>Communities and Local Government (CLG) and with input from Jobcentre Plus andRegional Government Offices in England.Future Jobs Fund <strong>for</strong>ms part of the Young Person‟s Guarantee. From early <strong>2010</strong>,everyone between the ages of 18 and 24 who has been looking <strong>for</strong> work <strong>for</strong> a yearwill get an offer of a job, work experience, or training lasting at least 6 months.Future Skills <strong>Dudley</strong> (FSD) project manage the Future Jobs Fund programme.Phase 1October 2009 to June<strong>2010</strong>Starts 203Job Outcomes <strong>15</strong>Phase 2 runs from April <strong>2010</strong> to March 2011.The previous Government introduced the Flexible New Deal in January 2008.It was a fundamental part of the Government‟s wider welfare re<strong>for</strong>m andunderpinned the principles of working towards eradicating child poverty by 2020. TheFlexible New Deal replaced New Deal 18 – 24 and 25+ and Employment Zoneprogrammes. It provides opportunities <strong>for</strong> Prime Contractor organisations (of whichFuture Skills <strong>Dudley</strong> MBC is one) from the private, public and third sectors to worktogether to deliver this new programme across all Jobcentre Plus districts fromautumn 2009.The Coalition Government has announced that Flexible New Deal will be replaced bya Single Work Programme. All Prime Contractors have been in<strong>for</strong>med that FlexibleNew Deal will stop by June 2011. Future Skills <strong>Dudley</strong> will continue to be one of twoPrime Contractors delivering the Flexible New Deal programme <strong>for</strong> the BlackCountry up to June 2011.39
Labour market outcomes to date are shown in table 2 below.Table 2Flexible New Deal Oct 2009 – Aug <strong>Dudley</strong> Borough<strong>2010</strong>Referrals from Jobcentre Plus 2385Starts on programme 1695Job starts 32413 weeks sustained employment 9926 weeks sustained employment 21Source: <strong>Dudley</strong> MBC Econ Regeneration Dept.For people with mental health problems the data is sparse. The current NationalIndicator set tracks employment in those aged 18-69 years who are in receipt ofsecondary care mental health services and receiving the Care ProgrammeApproach. There is some indication of recent improvement in this indicator <strong>for</strong><strong>Dudley</strong> (Table 3)Table 3<strong>Dudley</strong> Borough% 18-69 yrs receiving Care ProgrammeApproach from secondary care servicesin employment at last review2008-09 2009-10Apr-Dec1.0 4.3Source: NHS and Social Care In<strong>for</strong>mation centreAcross England the percentage <strong>for</strong> Local Authorities <strong>for</strong> Apr-Dec 2009 ranged from1.4% (Newcastle upon Tyne) to 22.7% (Windsor and Maidenhead), reflecting notonly the success at keeping/moving mental health clients into employment but alsolocal labour market conditions.Fair Employment and Good Work <strong>for</strong> All: What Needs to be Done in <strong>Dudley</strong>?Maximising fair employment <strong>for</strong> all in <strong>Dudley</strong> has the potential <strong>for</strong> making a majorcontribution to a reduction in inequality of health outcomes. <strong>Dudley</strong> is currentlydeveloping a local strategy, designed to develop the local economy and maximizeemployment. It will be important <strong>for</strong> this strategy to focus not only on total jobsgained but also on attracting high quality jobs <strong>for</strong> <strong>Dudley</strong> people to access. The fullset of measures to achieve this are being set out in the <strong>Dudley</strong> Local Economic<strong>Strategy</strong> and are not repeated here. For maximum impact on reducing healthinequalities <strong>Dudley</strong> needs to:40
Ensure that data systems <strong>for</strong> tracking the impact of economic strategyinitiatives use a consistent approach to assessment across the socialgradient.Ensure that public and private sector employers adhere to equality guidanceand legislation.Develop means of implementing guidance on stress management and theeffective promotion of wellbeing and physical and mental health at work, both<strong>for</strong> public sector and private sector employees.Consider the potential <strong>for</strong> incentivising employers to adapt jobs to providesuitable employment <strong>for</strong> lone parents, carers and people with physical /mentalhealth problems.Ensure that <strong>Dudley</strong> participates to the maximum in any available wellevidenced active labour market programmes.A HEALTHY STANDARD OF LIVING FOR ALLA <strong>Health</strong>y Standard of Living <strong>for</strong> All: What does the Evidence Tell Us?Marmot‟s review shows that both income and wealth have an effect on healthinequalities. People on low income do not buy goods and services that maintain andimprove their health and often have to purchase cheaper goods and services thatmay increase their risk of ill health. Low income can also mean that people do notparticipate in ordinary social and community life, leaving them with low self esteemor feelings of being less worthy. There is also a psycho-social adverse effectderiving from perceived position in the social hierarchy. Further evidence shows thatthe degree of inequality in income in society affects not only the poor, but society asa whole. Countries with marked income inequality have worse health and higherrates of crime and other adverse social outcomes. In high income countries, theevidence suggests that more generous social protection (benefit) systems lead tobetter population health outcomes and increased life expectancy.In the UK income inequality rose rapidly between 1984 and 1990. Since theninequality in equivalised disposable income remained constant till approximately2001, when it began to fall. The fall halted in 2004/05 and inequality in equivaliseddisposable income remained at a steady level from then until 2007/08.Data from ONS presented in the Marmot Report (<strong>2010</strong>) shows that In 2007/08 thetop fifth of all households earned 16 times more than the bottom fifth. Transferpayments (cash benefits paid through the welfare system) mitigated thisconsiderably so that once these are taken into account; the top fifth of all householdsearned 7 times the lowest fifth. However, the UK tax system is overall regressive(given the high proportion of taxation taken as indirect taxes), which means that <strong>for</strong>final disposable income the top fifth of all households have 6 times the bottom fifth.It can be seen from these figures that the mitigation of income inequality is mainly41
achieved through transfer payments, rather than the taxation system. It is there<strong>for</strong>eparticularly important to ensure that those entitled to benefits take them up.Marmot (<strong>2010</strong>) concludes that, in the current UK system, benefits are inadequate toprovide a healthy standard of living or have failed to reach those in need. They tendto be based on a black and white distinction between being reliant and non-reliant onvarious components of support, creating the so called „cliff edge‟ which discouragespeople from seeking work or staying in work.First time pregnant mothers in receipt of benefit remain vulnerable particularly if theyare under 25 and only receive lower age benefit rates, making it difficult to maintain ahealthy standard of living.The introduction of the minimum wage has had some effect on the distribution o<strong>for</strong>iginal income and the introduction of tax credits has increased support <strong>for</strong> workingpeople on low incomes. The working family tax credit introduction has been shownto be associated with reduction in single parent anxiety and improvement in afamily‟s income has been shown to have a particular impact on adolescent children;the gaps between them and other teenager‟s behaviour narrowed. (Rates of poorself esteem, unhappiness, truancy, smoking and the desire to leave school at 16 allhalved).However the initiatives have not succeeded in reaching all those who are entitledand there remain many citizens who do not have a sufficient income to live a healthylife. Marmot (<strong>2010</strong>) commends the concept of a minimum income standard (MIS) asa basis <strong>for</strong> assessing the adequacy of the benefits system. MIS includes sufficientincome <strong>for</strong> consuming a healthy diet; some allowance <strong>for</strong> expenses related toexercise costs; and costs related to social integration and support networks; inaddition to the items customarily included in the calculation of minimum income. TheMIS is different <strong>for</strong> people in different circumstances. For some groups the MIS ishigher than the currently defined poverty line (60% median income). Using the MIS,only 2/5ths of those with no children in receipt of income support meet MIS. Forcouples and single parents with children income support levels are approximately2/3 rd of MIS.A <strong>Health</strong>y Standard of Living <strong>for</strong> All: What do we know <strong>for</strong> <strong>Dudley</strong>?Table 4 below shows the average weekly household income <strong>for</strong> <strong>Dudley</strong> andEngland, by national quintile. (Using national quintiles, it should be noted that thereare no households in <strong>Dudley</strong> which fall into the top quintile <strong>for</strong> England).42
Gross earnings per week (£)Table 4TABLE 4: Summary of the effects of taxes and benefits by quintile groups on ALL households, 2007-08Quintile groups of ALL households 1Bottom 2nd 3rd 4th Top AllhouseholdsRatioTop/BottomquintileIncome per household (£ per week) 2Ave Total household weekly income (unequivalised)3 England 480 569 639 737 946 674 2.0<strong>Dudley</strong> 504 595 676 790 N/A 575 1.6Ave Net household weekly income (unequivalised)4England 407 470 523 588 709 539 1.7<strong>Dudley</strong> 423 484 554 6<strong>15</strong> N/A 473 1.51 Households are ranked by Ave Weekly Household Net Income equivalised be<strong>for</strong>e housing costs2 This table shows unequivalised income. Equivalised income has only been used in the ranking process to produce the quintile groups3 Total household weekly income (unequivalised) - is the sum of the gross income of every member of the household plus any income from benefitssuch as Working Families Tax Credit.4 Net household weekly income (unequivalised) - is the sum of the net income of every member of the household. It is calculated using the samecomponents as gross income but income is net of direct taxes such as income tax, national insurance and council taxData source: Income: Model-Based Estimates at MSOA Level, 2007/08, ONSThe income gradient <strong>for</strong> <strong>Dudley</strong> is further illustrated by looking at gross weekly pay(Figure 4) where both male and female pay show a gradient, with a slightly steepergradient <strong>for</strong> men. The gender gap in pay is immediately apparent.Figure 4700600Centiles <strong>for</strong> Gross Weekly Pay by Gender, <strong>Dudley</strong>, 2009<strong>Dudley</strong> Male<strong>Dudley</strong> FemaleMale meanFemale mean500400300200100010 20 25 30 40 60 70 75 80 90Centiles (%)Data source: www.nomisweb.co.uk, Annual Survey of Hours and Earnings, 200943
% share of equivalised incomeA comparison of the household income gradient in <strong>Dudley</strong> with that in England isshown in Figure 5.Figure 530%Percentage Shares of Equivalised Income by Quintile Groups <strong>for</strong> Households, 2007/825%20%<strong>15</strong>%10%5%0%bottom top bottomtop bottom top bottom topGross Weekly household income(<strong>Dudley</strong>)Gross Weekly household income(England)Net Weekly Household income(<strong>Dudley</strong>)Net Weekly Household income(England)Data source: Income: Model-Based Estimates at MSOA Level, 2007/08, ONSHouseholds are ranked by net equivalised income be<strong>for</strong>e housing costs and groupedinto quintiles. In this chart, the data <strong>for</strong> <strong>Dudley</strong> has been grouped into quintiles <strong>for</strong><strong>Dudley</strong> only, whereas the England level data is grouped into quintiles <strong>for</strong> the wholeof England.The income received by households is affected by direct taxation such as incometax, national insurance and council tax. The ratio of the top/bottom quintile <strong>for</strong> grossincome is 1.5 <strong>for</strong> <strong>Dudley</strong> and 2.0 <strong>for</strong> England, whereas this ratio is slightly reduced<strong>for</strong> net income, when taking account of direct taxes, to 1.4 and 1.7 respectively. Asteeper gradient is seen between the bottom and top quintiles <strong>for</strong> England than <strong>for</strong><strong>Dudley</strong>.The spatial distribution of income deprivation in <strong>Dudley</strong> is shown in Figure 6. Thismap shows income deprivation in <strong>Dudley</strong>, based on in<strong>for</strong>mation from the Index ofMultiple Deprivation (IMD) 2007. The income deprivation index is the proportion ofpeople who are income deprived in an area, ranked nationally.44
Figure 6Income Deprivation Index by Lower Super Output Area45
Figure 7 shows the income distribution across <strong>Dudley</strong> at MSOA level, based onmodelled estimates <strong>for</strong> 2007-8.Figure 7Modelled Estimates of Average Weekly Household Income by Middle SuperOutput AreaAve Weekly Household Income (£)440 to 518 (14)518 to 596 (14)596 to 674 (11)674 to 752 (2)752 to 830 (2)SedgleyCoseley WestCoseley EastGornal WoodCastle & PrioryKingsw in<strong>for</strong>d North &Wall HeathSt JamesSt ThomasKingsw in<strong>for</strong>d SouthBrockmoor &PensnettNetherton &WoodsideWordsleyBrierley HillSt Andrew sAmblecoteHalesow en NorthWollaston &Stourbridge WestLye &WollescoteQuarry Bank &CradleyBelle Vale &HasburyNortonPedmore &StourbridgeEastHayley GreenHalesow en SouthSource: Income: Model-Based Estimates at MSOA Level, 2007/08, ONSThe proportion of income support claimants in the working age population varies byIMD quintile, showing a gradient from most deprived (highest proportion ofclaimants) to the least deprived (Figure 8). IMD is a general measure of deprivation46
Proportion of population claiming income supportin the round and may be seen as a proxy <strong>for</strong> social position, although it should beborne in mind that there is a small degree of autocorrelation in that levels of incomesupport <strong>for</strong>m part of one component of the index. Nevertheless the trend linessuggest that the inequality gap appears to be narrowing slightly, with the proportionof claimants of income support in the 2 most deprived quintiles showing a decreasingtrend from August 2008. In the 3 least deprived quintiles, the proportion of claimantshas stayed fairly constant from February 2005 to May 2009.Figure 814%Proportion of Working Age Population of <strong>Dudley</strong> Claiming Income Support by Index ofMultiple Deprivation (IMD) 2007 National Quintile of Residence12%10%8%6%4%2%0%IMD1 (most deprived) IMD2 IMD3 IMD4 IMD5 (least deprived)Note: the steep decline in the number of claimants between November 2004 and February 2005 isdue to changes in the benefits system which resulted in some claimants having income supportreplaced by tax credits.An indication of pensioner poverty may be gained from examination of theguaranteed part of pension credit. Figure 9 shows the spatial distribution <strong>for</strong> <strong>Dudley</strong>.47
Figure 9Proportion of the population aged 60+ who are in receipt of the Guaranteedpart of Pension Credit <strong>for</strong> <strong>Dudley</strong> (Feb 2009)X In the highest 1,677 wards <strong>for</strong> Great Britain as a whole (i.e. highest sixth of wards)X In the next 1,677 wards (i.e. second sixth)X In the next 1,677 wards (i.e. third sixth)X below the Great Britain average - remaining 5,033 wardsSource: Poverty.org.uk (accessed 02/08/<strong>2010</strong>)48
The Marmot report showcases examples of CAB in GP practices projects throughoutEngland. The Marmot (<strong>2010</strong>) report comments that „many of these programmes areoffered on a project by project basis and receive short term funding. Few financialsupport interventions are mainstreamed into PCT or local authority budgets, yetmany are consistently effective in improving incomes and reducing debt‟. The GPcommissioners in <strong>Dudley</strong> have mainstreamed the funding of Citizen Advice Bureausin GP surgeries into a 3 year agreement. With a service provided from 12 of theBorough‟s 53 practices. The siting of the CAB centres is in centres serving deprivedcommunities. The service sees between 500 and 600 clients per year (althoughclients will have multiple appointments), gaining in the region of £0.5m per yearadditional income <strong>for</strong> poor people in the Borough.A <strong>Health</strong>y Standard of Living <strong>for</strong> All: What Needs to be Done in <strong>Dudley</strong>?As things stand, the extent to which all people in <strong>Dudley</strong> will have disposable incomewhich provides sufficient <strong>for</strong> them to have a standard of living <strong>for</strong> a healthy life is verydependent on national policies adopted by central governments. In particular, theextent to which central governments are prepared to shift the taxation systemtowards being more progressive; the extent to which welfare policy initiatives aredesigned to remove the „cliff edge‟ and the extent to which measures areimplemented to ensure full take up of entitlement to state benefits.In the meantime, all public service agencies in <strong>Dudley</strong> should be ensuring that thoseeligible and entitled to benefit are receiving it.It is a legal requirement <strong>for</strong> the <strong>Dudley</strong> MBC to produce a strategy to reduce childand family poverty and the key actions <strong>for</strong> poverty reduction in <strong>Dudley</strong> are containedin that document and are not reproduced here. The Child and Family PovertyReduction <strong>Strategy</strong> must be implemented in full.<strong>Dudley</strong> as a healthy and sustainable place: what does the evidence tell us?One of the major features of The Marmot Review (<strong>2010</strong>) is the alignment of climatechange and health inequalities.The Marmot Review stated that climate change will have the greatest impact on theurban poor, elderly and children – “lowest level of income, quality homes and health”.The recently published report <strong>Health</strong> Effects of Climate Change in the WestMidlands (May, <strong>2010</strong>) also explains the need to actively reduce health inequalitiesthereby reducing those at most risk as a result of climate change.Within the West Midlands, coronary heart disease, strokes and infant mortalitytogether with respiratory disease are all linked to extremes of temperature.49
Although temperature variations during the life of this strategy are minimal, effectiveadaptation measures should be identified to reduce the impact of increased summertemperatures of (0.5°c – 2.5°c) by <strong>2010</strong>. In urban areas the „Urban Heat IslandEffect‟ will exacerbate the increase in temperatures.Research has demonstrated that the fewest deaths occur in summer with atemperature range of 17°c – 20°c (Fisher, 2009).In the next decade, summer temperatures will increase and those within the wintermonths, this may lead to reduced winter mortality but an increased summer mortalityrate. With temperatures in excess of 20°C increasing coronary heart disease andrespiratory incidents are likely to increase.Other issues of health will relate to an increase in food borne and water bornediseases in warmer weatherFlooding will impact on both physical and mental wellbeing, although summer rainfallis set to reduce, intensity of showers is set to increase. Drier summers will alsoincrease ozone pollution which will have a negative impact on respiratory disease.Within this context, reducing health inequalities, together with recognition of the need<strong>for</strong> adaptation strategies to address the impact of climate change at a servicedelivery level are a priority.There are numerous policies derived from government that have aimed to improvethe quality of community environments e.g. New Deal <strong>for</strong> Communities, Bikeability,The Housing and Regeneration Act, Green Flag Awards and World Class Places.Few of these have examined their impact on reducing health inequalities or reducingthe social gradient. All policies seeking to promote active travel or improve thequality of the environment should also assess their impact on reducing the socialgradient.<strong>Dudley</strong> as a healthy and sustainable place: what do we know <strong>for</strong> <strong>Dudley</strong>?The Climate Change group has been in existence since 2008. The three main areasof work <strong>for</strong> this group are:Carbon managementResource efficiencyClimate changeThe National Indicator that the group seeks to address is the per capita reduction inCO 2 emissions in the local authority area. <strong>Dudley</strong> is the lowest in the Black Countryregion and second lowest in the Black Country region. Table 5 shows the targets <strong>for</strong>reducing carbon emissions in the borough.50
Table 5NI 86Per capitareduction inCO 2 emissionsin the LA area(source:DEFRA)NationalratingLowest inBC region2 nd lowestin WMregion42 ndlowestnationallyDirectionof travelCO 2 levelsimprovingBaselineand year6.1 tonnesper capita(2005)2008/09 2009/10 <strong>2010</strong>/11-3.2% -6.4% -9.7%(Source: <strong>Dudley</strong> Community Partnership Strategic Plan)<strong>Dudley</strong> as a healthy and sustainable place: what needs to be done in <strong>Dudley</strong>?The key actions from the climate change delivery plan are:Gaining strategic buy-in and partner collaboration in the fields of resourceefficiency and carbon managementBuilding knowledge and capacity to take action within a ready community ofinterestBuilding knowledge within a geographical community of energy and climatechange issues and raising capacity to take actionBanish the inefficient community buildingImplementing <strong>Dudley</strong> Heroes awardsRaising awareness of climate change and its impactsIn addition Marmot (<strong>2010</strong>) recommends a number of policy areas <strong>for</strong> local action:Increase opportunities <strong>for</strong> active travel across the social gradientMaintain access and quality of open and green spaces across the socialgradientContinue to improve the energy efficiency of housing and reducing fuelpovertySupport locally developed and evidence based community regenerationprogrammes that reduce barriers to community participation and reducesocial isolation51
5. LEADERSHIP AND PARTNERSHIP<strong>Dudley</strong> Community PartnershipReducing health inequalities requires action by all services and agencies that havean impact on the economic, environmental and social determinants of health. The<strong>Dudley</strong> Community Partnership (DCP) provides cross agency leadership by bringingtogether key partners from the public, voluntary, community and business sectors,and is currently chaired by the Chief Executive of NHS <strong>Dudley</strong>.The DCP has a key role to play in reducing health inequalities, as one of its mainaims is to ensure that all of the partners can work together effectively to improve thequality of life of everyone in <strong>Dudley</strong> Borough. The Community <strong>Strategy</strong> provides themain vehicle <strong>for</strong> doing this.The <strong>Dudley</strong> Community <strong>Strategy</strong> (<strong>Dudley</strong> Community Partnership, 2005) outlines aset of key partnership priorities based on a <strong>15</strong> year vision. This vision is based onthe expressed concerns of local people and agencies‟ own awareness of specificissues affecting the borough. It was shaped by over 5000 local people and morethan 40 community groups. The vision <strong>for</strong> 2020 is one of sustainable, inclusive andconnected communities across the <strong>Dudley</strong> Borough.The Community <strong>Strategy</strong> is revisited every three years. The most recent versionoutlines the aspirations <strong>for</strong> improvements under six themes, many of which impacton health inequalities, and one of which specifically focuses on health and wellbeing.The Community <strong>Strategy</strong> provides the overarching plan <strong>for</strong> all partners to work to. Ithighlights where inequalities exist <strong>for</strong> certain sections of the population and whereadditional action is required to promote equality. It is based on 5 principles whichshape the way that partners work together. They are:o Promoting equality – tackling inequalityo Safeguarding the futureo Reflecting priorities through physical changeo Delivery in partnershipo Involving people<strong>Dudley</strong> Community Partnership is supported by a sub structure of borough widethematic strategic partnerships, which are responsible <strong>for</strong> developing action plans<strong>for</strong>, and overseeing delivery of the priorities within the Community <strong>Strategy</strong>. The<strong>Health</strong> and Wellbeing Partnership takes a strategic overview of health inequalities,including per<strong>for</strong>mance monitoring and regular review of the metrics. It also managesand monitors joint working arrangements between the NHS and the Local Authority.This work is underpinned by the <strong>Dudley</strong> <strong>Health</strong> & Social Care CommissioningFramework and <strong>Strategy</strong> 2008-13, (NHS <strong>Dudley</strong> and <strong>Dudley</strong> MBC, 2008) and astrong track record of commissioning older people‟s, learning disability and mentalhealth services.52
Next Generation Local Area Agreement„<strong>Dudley</strong>‟s Next Generation Local Area Agreement 2008/11 (<strong>Dudley</strong> CommunityPartnership, 2008) focuses on creating a vibrant and sustainable economy andreducing inequalities. This vision is intended to support the much broader vision ofthe Community <strong>Strategy</strong> by recognising that a strong economy is key to deliveringstronger communities. The commitment to tackling inequality, vulnerability anddifferences in opportunities is viewed as a cross cutting theme across all fourpriorities – wealthy communities; healthy communities; environmentally-awarecommunities and safe and cohesive communities.Key partners were involved throughout the process of identifying these priorities, andthe partnership agreed a range of criteria to assist in the process, which included anassessment of whether or not the priority in question would contribute to narrowingthe gap.A structural review of the partnership has resulted in Task and Finish Groups being„charged‟ with the responsibility of delivering agreed outcomes and taking ownershipof agreed indicators. This approach will ensure that the expertise and knowledge of acore group of partners, who are already involved in the Thematic Partnerships,remains central to the work, but will also enable broader involvement of otherpartners.‟ (Next Generation LAA 2008 -11, 4 th Submission, <strong>Dudley</strong> CommunityPartnership May 2008)Strong leadership and a strategic partnership with agreed priorities andresponsibilities needs to be underpinned by partnerships which are effective <strong>for</strong>middle management and frontline staff.In <strong>Dudley</strong>, work to address health inequalities is further supported by:A strong and well organised voluntary, community and faith sector.A Director of Public <strong>Health</strong> (DPH), who has been jointly appointed by NHS<strong>Dudley</strong> and the Local Authority. The DPH is a member of the CouncilCorporate Board and has access to the council cabinet. Regular board-toboardmeetings take place between NHS <strong>Dudley</strong> and the Local Authority andthe DPH provides a strong lead on health inequalities.Strong relationships between commissioners in NHS <strong>Dudley</strong> and the LocalAuthority, and also with providers.A number of joint appointments and secondments between NHS <strong>Dudley</strong> andthe Local Authority.Strong commitment within the Council Plan and NHS <strong>Dudley</strong>‟s strategic planto address health inequalities.53
A Community Renewal team which coordinates agency and communityactivity in identified neighbourhoods, with a focus on deprivation. This hasresulted in considerable joint working between all partners at a neighbourhoodlevel, and has led to improvements in basic „place‟ based issues such ascrime, the environment and housing. Local communities are now, in general,ready to move on to addressing „people‟ based issues such as health,education, skills and jobs.NHS <strong>Dudley</strong>‟s Public <strong>Health</strong> teams and the Council‟s Community Renewalteam are in the early stages of developing Neighbourhood <strong>Health</strong> Plans.These will provide a very focussed and coordinated approach to addressinghealth inequalities in localised areas and will help to maximise the capacity ofpartner agencies to deliver against the priorities identified.In addition:<strong>Health</strong> inequalities will now feature on the Overview and Scrutiny agenda andper<strong>for</strong>mance against health inequalities targets will be reported to this groupwhen a new per<strong>for</strong>mance framework has been agreed.Consideration is being given to appointing a lead member <strong>for</strong> healthinequalities. <strong>Dudley</strong> PCT has identified a post <strong>for</strong> a GP Champion <strong>for</strong> „stayinghealthy‟.The new Chief Executive of the <strong>Dudley</strong> Group of Hospitals Foundation Trustwill take <strong>for</strong>ward the health promoting role of the hospital and take a positiverole in reducing health inequalities.<strong>Dudley</strong> has a strong tradition of partnership working and is well placed to tackle thehealth inequalities that exist within the borough. However, recent changes introducedby the new coalition government and substantial budget cuts will present futurechallenges, and changing circumstances may impact on agencies priorities andactivities. This comes at a time when strengthening partnership arrangements evenfurther is necessary to maximise the potential <strong>for</strong> tackling health inequalities.The <strong>Health</strong> <strong>Inequalities</strong> National Support Team that visited in July 2009 recognisedthe strength of partnership working in the borough, but identified a need tostrengthen leadership across the partnership, including the engagement of electedmembers and non-executive directors.The Trans<strong>for</strong>ming Community Services agenda and the transfer of public healthfunctions to the Local Authority also present key challenges in relation to redefiningand clarifying responsibilities and accountabilities and (re)building trustingrelationships.GPs have always had a role to play in addressing health inequalities as practitioners,community leaders and commissioners. With new responsibilities <strong>for</strong> commissioning,close partnership working arrangements between GP consortia and local authorities54
will need to be developed to ensure an improvement in public health and a reductionin health inequalities.In the midst of these changes we need to safeguard the strong partnershipsdeveloped with people living in local communities in <strong>Dudley</strong>. Long be<strong>for</strong>e statutoryrequirements like the Duty to Involve came into being, public and voluntary sectoragencies in <strong>Dudley</strong> have been working alongside local communities to ensure thatpeople can affect decision making, influence change in the delivery of health andsocial services, gain experience and skills which may lead to a better quality of life<strong>for</strong> them and their families, and take ownership of their own health improvement.This work has been built on trusting relationships, which takes time to develop. Anincreasing focus on market-driven, cost-efficient models of service delivery brings aninevitable tension in keeping local people at the <strong>for</strong>efront of our thoughts and ourplans. In this climate we need to work particularly hard at valuing and sustainingthese relationships and ensuring they continue to be based on trust, respect,empathy and reciprocity.55
6. COMMUNITY ENGAGEMENTCommunity EngagementThe very process of community engagement, when done well and appropriately, cancontribute beneficially to people‟s health and well-being. In short, communityengagement is a healthy activity.BackgroundEngaging and empowering local people and groups has been a requirement of localpublic sector bodies and councils <strong>for</strong> some time now. Recently the Strong andProsperous Communities, The Local Government White Paper (Great Britain.Department of <strong>Health</strong>, 2006) has called <strong>for</strong> a „more comprehensive approach toengagement‟ and Communities in control. Real people, real power (Communitiesand Local Government, 2008) continued this theme calling on Local StrategicPartnerships to „streamline consultation and engagement‟.The Marmot Review (<strong>2010</strong>) puts empowerment of individuals and communities at thecentre of action to reduce health inequalities.‟ It goes on to say that „there needs tobe a more systematic approach to engaging communities <strong>for</strong> Local StrategicPartnerships at both district and neighbourhood levels, moving beyond often routine,brief consultations to effective participation in which individuals and communitiesdefine the problems and develop community solutions.An empowering approach to engaging communitiesIn <strong>Dudley</strong>, a multi-agency programme of work called „In it together‟ (<strong>Dudley</strong>Community Partnership, <strong>2010</strong>) was initiated in 2007, led by Dosti, <strong>Dudley</strong>‟sCommunity Empowerment Network. Over 250 local people, primarily drawn from<strong>Dudley</strong>‟s voluntary, community and faith sector networks contributed to an initialdiscussion and consultation document which explored the issues at the heart ofcommunity engagement. Following this, 92 professionals participated in workshopsto help shape a local community engagement training and support package.„In it together‟ is a partnership approach to empowering community engagement. Itencourages and supports organisations and people to bring together theircommunity engagement work and plans, to enable them to move beyondconsultation and jointly deliver/facilitate meaningful and empowering communityengagement activity. An empowering community engagement approach facilitatesparticipation and promotes inclusion, and thus acts as a protective factor <strong>for</strong> mentalwell-being (NMHDU, <strong>2010</strong>)<strong>Dudley</strong> Community Partnership agency leads, including the <strong>Health</strong> and WellbeingPartnership, have signed up to and fully endorsed the „In it together‟ workprogramme which encompasses the following:A Comprehensive Community Engagement <strong>Strategy</strong> (Pendry, Prescot andPritchard, 2009) – written as an interactive document and tailored into four56
different versions to support practitioners, managers, elected members andrepresentatives;A Community Engagement guide and toolkit (Pendry, Roberts and Walker,2009) which takes people through each step in undertaking an engagementactivity. This work has been led by DMBC.A consultation database which seeks to coordinate community engagementactivity, avoid duplication and share learning. This has been developed byDMBC and is now being rolled out to partners.Three levels of training –o Level 1: Understanding Engagement is core training which supportspeople to understand <strong>Dudley</strong>‟s empowering approach to engagingcommunities.o Level 2: Practising Engagement offers a range of modules includingfacilitation skills, cultural awareness and community consultation tools.o Level 3: Supporting others to engage will be developed over time tooffer support <strong>for</strong> people to develop their own and others communityengagement practice, through <strong>for</strong> example, mentoring, buddying orAction Learning Sets.A Community Engagement Network which supports people to understand,practice and develop their engagement practice.The strong partnership approach which underpins „In it together‟ has enabled thesharing of key in<strong>for</strong>mation and resources across agencies, including corporatetraining, previously only available to staff from the employing organisation.The „In it together‟ work programme is coordinated and progressed by a multiagencyCommunity Engagement Working Group, which reports into the StrongerCommunities Thematic Partnership group of the Local Strategic Partnership - <strong>Dudley</strong>Community Partnership.Further in<strong>for</strong>mation on the „In it together‟ work programme and supportingdocuments are available to download from the dosti websitewww.dosti.org.uk/downloads.Shared principles and valuesTo achieve an empowering approach to engaging communities, agencies need towork in line with shared principles and values. „In it together‟ (<strong>Dudley</strong> CommunityPartnership, <strong>2010</strong>) promotes a common language and understanding in relation tocommunity engagement, which links the principles in the Community <strong>Strategy</strong>, thevalues in the Local Compact and is reflected in the PCT‟s Communications andEngagement <strong>Strategy</strong> (NHS <strong>Dudley</strong>, 2009) and DMBC‟s Corporate EngagementPrinciples (<strong>Dudley</strong> MBC, 2009)Shared principles and values will support closer collaborative work betweenorganisations, of which there are already several existing and emerging examples,such as:57
o DMBC sharing their community engagement database with the NHS economy in<strong>Dudley</strong> to facilitate learning and sharing of practice, improve the effectiveness ofcommunity engagement activity and reduce duplication. This is a prelude toextending access to other statutory and voluntary sector organisations.o NHS <strong>Dudley</strong> and DMBC <strong>Dudley</strong> <strong>Health</strong> & Social Care Commissioning Frameworkand <strong>Strategy</strong> 2008-13 was underpinned by a wide-ranging engagement through anationally recognised „Think Tank‟ process and health inequalities wasestablished as a theme to guide commissioning activity.o Follow-on work from the „Think Tank‟ activities through a two phase engagementexercise – phase one utilised a mobile film unit to elicit views about health andsocial care, and phase two will utilise the film from this to stimulate furtherdiscussion and comment from a diverse range of audiences across the borough.A planned and systematic approach„To effectively tackle health inequalities and avoid the vast amount of waste and / oradditional costs incurred from under-used services, poor self-management of longterm conditions and commissioned activity and services which fail to move beyondpilot / short term funding, a planned and systematic approach (to communityengagement) is crucial,‟ (Smithies, <strong>2010</strong>).In <strong>Dudley</strong>, the strategic approach taken through „In it together‟ (<strong>Dudley</strong> CommunityPartnership, <strong>2010</strong>) is helping to ensure that community engagement activity impactson change at all levels. The National Support Team also recognised that we haveextensive, regular and secure arrangements <strong>for</strong> community engagement on healthand social care issues.The Five Elements model proposed by the <strong>Health</strong> <strong>Inequalities</strong> National SupportTeam (Smithies, <strong>2010</strong>) provides a framework to plan, deliver, monitor and evaluatecommunity engagement work (Figure 1). Applying this model to both cross-agencystrategic approaches and individually commissioned initiatives and services will helpto ensure that the sustainability, reach and impact of community engagement work ismaximised.58
Figure 1 – The Five Elements Model (Smithies, J., <strong>2010</strong>)1. „Grassroots‟community work3. Professionalinfrastructure5. Overview &coordination2. Communityinfrastructure4. OrganisationdevelopmentIn <strong>Dudley</strong> we have extensive, regular and secure arrangements <strong>for</strong> communityengagement. „In it together‟ is paving the way to connect much of the communityengagement work at a cross-agency strategic level. The challenge now is to ensurethat all community engagement activity considers each stage of the model in itsplanning and delivery. This will require better access to decision making structures,and strategic leadership roles being built into community engagement work to ensurethat work directly with local communities in<strong>for</strong>ms areas such as work<strong>for</strong>cedevelopment, commissioning and service redesign.Public <strong>Health</strong> and the Local Authority (Community <strong>Health</strong> Improvement andCommunity Renewal respectively) are using the Five Element Model to reviewcurrent activity, identify gaps and plan <strong>for</strong> a more coordinated and strategic approachto community health improvement in the most deprived neighbourhoods in theborough through the development of Neighbourhood <strong>Health</strong> Plans.The <strong>Health</strong> <strong>Inequalities</strong> National Support Team recommended that localcommunities are made more aware of health inequalities and are engaged moreeffectively in setting local priorities, and that neighbourhood engagement structuresare simplified. Collaborative working between the Local Authority and NHS <strong>Dudley</strong> isongoing to ensure that community engagement structures and activity is simplifiedand streamlined to avoid duplication and gain maximum benefit from the processesalready in place. The development of Neighbourhood <strong>Health</strong> Plans will also help toensure that grassroots community work is better coordinated and that it in<strong>for</strong>ms localpriorities within each element of the model.59
Transferring power to communitiesNICE guidance on community engagement recognises that different levels ofcommunity engagement can directly and indirectly affect health in both theintermediate and longer term. „Community engagement approaches which enablecommunities to work as equal partners, or delegate some power to them – or, indeedprovide them with total control – may lead to more positive health outcomes.‟ (NICE,2008a.)During the <strong>Health</strong> <strong>Inequalities</strong> National Support Team visit in July 2009, it wasidentified that very few mechanisms exist locally <strong>for</strong> empowering communitiesthrough democratic means (e.g. town / community Councils), community investment(e.g. Community Land Trusts), or through service provision (e.g. through a<strong>Health</strong>care social enterprise).„In it together‟ supports people to identify the most appropriate level / method ofcommunity engagement according to the purpose of their engagement activity andwill help to ensure that whichever method (mechanism) is used, people undertaking,managing and resourcing engagement activities in <strong>Dudley</strong> do so in the mostempowering way possible.However, without a shift of power towards individuals and communities it will bedifficult to achieve the penetration of interventions needed to impact effectively onhealth inequalities. (Marmot, <strong>2010</strong>)The coalition Government has set out their driving ambition to put more power andopportunity into people‟s hands by „Building the Big Society.‟ This agenda presentsmany opportunities and supports existing work in <strong>Dudley</strong> which is aiming to increasethe number of people who participate in meaningful engagement and are able tomake a difference. If this agenda is to support progress in reducing the healthinequalities gap we must not underestimate the scale of the challenge ahead.Those experiencing the greatest inequalities are likely to be the least able to solveproblems and improve life <strong>for</strong> themselves and their communities. While inequalitiespersist, people who have the least will benefit the least from the transfer of powerand responsibility.Energy and commitment to social action underpinned by strong partnership workingand a move towards co-production, whereby providers and users work together inequal and reciprocal partnerships will be required to make sure that everyone canparticipate in a way which will improve their health and wellbeing, and help them tohelp themselves and each other.60
7. PRIORITY ACTIONS TO IMPACT ON HEALTH INEQUALITIESBuilding on its experience of supporting the spearhead areas to reduce healthinequalities, the <strong>Health</strong> <strong>Inequalities</strong> National Support Team has been able to developa number of priority actions that have been shown to have the greatest impact onmortality targets. Their recommendations <strong>for</strong> <strong>Dudley</strong> included a number of importantactions <strong>for</strong> us to implement in order to address our inequality gap. This sectionfocuses on the key disease areas that contribute to the biggest gaps locally.7.1 SECONDARY PREVENTION CARDIO-VASCULAR DISEASEIntroduction:Cardiovascular Disease (CVD) is a collective term <strong>for</strong> a group of related conditionsaffecting the heart, arteries or blood vessels. It includes Coronary Heart Disease(CHD) (about 50%) and stroke (about 25%).Nationally there has been a steady and marked decline in death rates from CVD. Infact the overall reduction has surpassed the government target:„substantially reduce mortality rates by <strong>2010</strong> from heart disease and stroke andrelated diseases by at least 40% in people under 75, with a 40% reduction in theinequalities gap between the fifth of areas with the worst health and deprivationindicators and the population as a whole from a 1996/7 baseline‟.The health inequalities gap in relation to CVD mortality and prevalence is welldocumented with higher levels <strong>for</strong> men than women, lower income levels than higherand <strong>for</strong> specific ethnic groups. Deaths from CHD are three times higher amongunskilled men than professionals and around 50% higher in South Asiancommunities than the general population and early onset of the disease two to threetimes higher (CQC, 2009).Nationally the CVD inequalities gap is reducing, with latest data (2007) showing areduction of 36% in the absolute gap between the Spearhead PCTs and the Englandaverage. The national gap in 2007 was 23.5 deaths/100,000. (CQC, 2009, p. 12).<strong>Dudley</strong> reflects the national picture overall but our inequalities gap is widening <strong>for</strong>men. CVD levels have declined steadily, but remain the biggest single cause ofpremature death in <strong>Dudley</strong> accounting <strong>for</strong> around <strong>15</strong>0 deaths in the under 75s eachyear. There is some evidence that <strong>for</strong> men the rate of decline is beginning to slow.CVD continues to be a major factor in overall health inequalities, with rates in somewards being more than 3 times those in other wards. The gap between the wardswith the highest and lowest rates has widened <strong>for</strong> men but not <strong>for</strong> women. Thedeprivation gradient in premature mortality from circulatory diseases is much steeperin men than in women. (Little and Moss, 2009)61
Standardised Rate per 100,000 PopulationStand ardised R ate per 100,000 Population1985-19831986-19841987-19851988-19861989-19871990-19881991-19891992-19901993-19911994-19921995-19931996-19941997-19951998-19961999-19972000-19982001-19992002-20002003-20012004-20022005-20032006-20042007-20052008-20062009-2007<strong>2010</strong>-2008Figure 1Directly Standardised Mortality Rates from All Circulatory Diseases by Year3 year rates, <strong>Dudley</strong>, Males & Females Aged Under 75, 1983-1985 to 2008-<strong>2010</strong>-Target: Reduce mortality from All Circulatory Diseases by 20% by 2009 from 1996400350Standardised Rate per 100,000 Population300250200<strong>15</strong>0100500Figure 2200Directly Standardised Mortality Rates from All Circulatory Diseases by IMD 2007 NationalQuintile5-Year Rates, <strong>Dudley</strong> MBC, Males & Females Aged Under 75, 2004-20081801601401<strong>2010</strong>0806040200There has been a slow-down in the rate of decline in mortality <strong>for</strong> stroke, particularly<strong>for</strong> men in the last few years. The rate of premature mortality <strong>for</strong> stroke in men isnow significantly higher than the England and Wales average (Figure 3).62
Standardised Rate per 100,000 PopulationStandardised Rate per 100,000 Population1983-19851984-19861985-19871986-19881987-19891988-19901989-19911990-19921991-19931992-19941993-19951994-19961995-19971996-19981997-19991998-20001999-20012000-20022001-20032002-20042003-20052004-20062005-20072006-20082007-20092008-<strong>2010</strong>Figure 380Directly Standardised Mortality Rates from Stroke by Year3-Year Rates, <strong>Dudley</strong>, Males & Females Aged Under 75, 1983-1985 to 2008-<strong>2010</strong>Target: Reduce mortality from Stroke by 20% by 2009 from 19967060504030<strong>2010</strong>0Figure 4Directly Standardised Mortality Rates from Stroke by IMD 2007 National Quintile5-Year Rates, <strong>Dudley</strong> MBC, Both Sexes Aged Under 75, 2004-200835302520<strong>15</strong>105063
Secondary Prevention of CVDOptimum management of the vascular long term conditions within primary care is akey strategy in the reduction of CVD health inequalities. The numbers of peopleliving with a chronic disease are set to rise substantially because our population isgrowing, ageing and lifestyle risk factors such as obesity are becoming morecommon.<strong>Health</strong> inequalities may result due to deprivation, ethnicity, age, sex and occupation.This section focuses on deprivation as the in<strong>for</strong>mation is available and deprivationhas been found to be linked with occupation and ethnicity.<strong>Health</strong> inequalities in relation to the secondary prevention of CVD can occur atdifferent points:- Are people coming <strong>for</strong>ward in the first place? The gap in expected to actualprevalence <strong>for</strong> the key disease registers gives an indication- Once identified are people accessing treatment?o Are exclusions from the register justifiable? Exception reporting <strong>for</strong> thedisease registers gives an indicationo Are patients reviewed regularly and their risk factors measured andrecorded? QOF clinical indicators on recording gives an indicationo Are drugs prescribed where indicated? QOF clinical indicators onprescribing gives an indicationo Is there access to supportive services? Referrals to Lifestyle RiskManagement Services (LRMS) gives an indication- Are outcomes from treatment equitable?o Are risk factors controlled to target levels? QOF clinical indicators oncontrol gives an indicationo Are prescribed drugs titrated to optimum levels? Bespoke medicinemanagement audits can give an indicationo Are LRMS outcomes equitable? Outcomes monitoring data from LRMSgives an indicationPrevalence recording of vascular diseases and precursor conditionsThe quality and outcomes framework (QOF) of GP contracts requires GPs to reportthe number of people on the various special disease registers. The actual diseaseprevalence reported from QOF can be compared to expected disease prevalenceestimated from national disease prevalence models. Expected and actualprevalence <strong>for</strong> the key vascular diseases/conditions <strong>for</strong> <strong>Dudley</strong> as a whole is shownin Table 1.Table 1: Expected and Actual Prevalence. <strong>Dudley</strong> Average.Disease/condition Expected Prevalence Actual PrevalenceCHD 5% 4%Stroke 2% 2%Hypertension 25% 16%Diabetes 6% 5%Source: Doncaster PHIU April 2009 QOF Benchmarking tool64
Ratio of obsevred vs. expected prevalenceThere is an under-reporting of prevalence, especially <strong>for</strong> hypertension (Table 1).Looking at practice level data, there is an association between deprivation andpractice per<strong>for</strong>mance in the recording of prevalence <strong>for</strong> some of the vasculardiseases. Practices in more deprived areas tended to have higher levels ofunrecorded prevalence <strong>for</strong> CHD and stroke (Figure 5 & 6) resulting in poorer accessto treatment. An opposite association was seen <strong>for</strong> diabetes (Figure 7) with practicesin the least deprived areas more likely to have higher levels of unrecordedprevalence.Figure 5:Prevalence Recording Ratios <strong>for</strong> CHD (r=0.537,r 2 = 28%)38491.131.030.930.83218316412 3142 3330 10 3275243475126462145535410.730.630.5313520644141319371724828948252739362322403411<strong>15</strong>500.430 10 20 30 40 50 60 70Percentage of GP population in most deprived IMD quintile29CHD Ratio Mid Range IMD1 CHD <strong>Dudley</strong> Average Ratio CHD England Average RatioSource: Quality Outcomes Framework disease register 2008/09Primary Care Mortality Data GP Registered PopulationDepartment of Communities & Local Government Indices of Deprivation 200765
Ratio of obsevred vs. expected prevalenceRatio of o bsevred vs. exp ect ed prevalen ceFigure 6: Prevalence Recording Ratios <strong>for</strong> Stroke/TIA (r=0.413, r 2 =17%)1.98161.781.581.381.180.980.780.580.3843 30 186322 1012143335 4431 20421 38753522443222<strong>15</strong>13 26849 51 172747 4819 4645369372839 232541 34 40<strong>15</strong>11290 10 20 30 40 50 60 70Percentage of GP population in most deprived IMD quintile50Stroke Ratio Mid Range IMD1 Stroke <strong>Dudley</strong> Average Ratio Stroke England Average RatioSource: Quality Outcomes Framework disease register 2008/09Primary Care Mortality Data GP Registered PopulationDepartment of Communities & Local Government Indices of Deprivation 2007Figure 7: Prevalence Recording Ratios <strong>for</strong> Diabetes (r=0.6, r 2 = 40%)481.9840Ratio of observed vs. expected prevalence1.78411.58461.38231.182791144728 292185360.98175322<strong>15</strong>19 4316 6341412 3849 13 512425353326390.7820 44730 185231 1034542 321370.5820 10 20 30 40 50 60 70Percentage of GP population in most deprived IMD quintile50Diabetes Ratio Mid Range IMD1 Diabetes <strong>Dudley</strong> Average Ratio Diabetes England Average RatioSource: Quality Outcomes Framework disease register 2008/09Primary Care Mortality Data GP Registered PopulationDepartment of Communities & Local Government Indices of Deprivation 200766
There is great variation in per<strong>for</strong>mance between practices, with a number ofpractices consistent poor per<strong>for</strong>mers. Where practices differ significantly, this couldbe due to poor data recording, a need to improve case finding, higher exceptionreporting which would need investigating or alternatively a higher or lower actualprevalence in that GP practice population. These are important areas to concentrateon in order <strong>for</strong> the PCT to have an impact on reducing health inequalities in theborough.Exception ReportingException reporting is the process by which patients are excluded from chronicdisease registers <strong>for</strong> reasons such as failing to attend an appointment after 3reminders, or refusing treatment. Nationally GPs working in more deprived areastend to show higher exception reporting (CQC, 2009, p.17), but this was not the casein <strong>Dudley</strong> <strong>for</strong> any of the vascular disease registers.Exception reporting <strong>for</strong> all vascular disease registers was extremely varied acrossthe practices. Although the overall <strong>Dudley</strong> average was lower than the Englandaverage <strong>for</strong> all registers, there were a number of practices with very high exceptionlevels compared to other practices. It is important to review per<strong>for</strong>mance in this area,especially with the practice outliers to ensure that exclusion criteria are fair and arenot inadvertently contributing to health inequity.Management of Hypertension <strong>for</strong> Vascular Diseases in Primary CareThere is high variation in per<strong>for</strong>mance between practices <strong>for</strong> both the recording andcontrol of blood pressure across all vascular disease/ condition registers: CHD,stroke, diabetes, hypertension and Chronic Kidney Disease (CKD). The range ofper<strong>for</strong>mance gaps are detailed in Table 2. The percentage gap represents thenumbers of patients that are not being treated at optimum level.Table 2: Range of per<strong>for</strong>mance gapDisease/condition registerQOF Clinical IndicatorPercentagegap range<strong>Dudley</strong>averageCHD 5 (Bp record
Per<strong>for</strong>mance variation cannot be explained by deprivation <strong>for</strong> <strong>Dudley</strong>, as there wasno association found between practice deprivation level and either blood pressurerecording or control <strong>for</strong> any of the vascular disease/ condition registers, whichreflects the national picture. (Craig.and Mindell, 2008).There are a number of practices that consistently appear below average inper<strong>for</strong>mance. Differences may be due to poor data recording, a need to improvedisease register management i.e. patients not invited <strong>for</strong> annual reviews or high nonattendancerates, poor prescribing regimens and low levels of lifestyle referrals, orthey may be due to poor patient compliance with drug or lifestyle therapies. Theseare important areas to concentrate on in order <strong>for</strong> the PCT to have an impact onreducing health inequalities in the borough.Cholesterol Management <strong>for</strong> Vascular Diseases in Primary CareThere is high variation in per<strong>for</strong>mance between practices <strong>for</strong> both the recording andcontrol of cholesterol across the vascular disease/ condition registers - CHD, stroke,and diabetes. The range of per<strong>for</strong>mance gaps are detailed in Table 3.Table 3: Range of per<strong>for</strong>mance gapDisease/condition registerQOF Clinical IndicatorPer<strong>for</strong>mancegap range<strong>Dudley</strong>averageCHD7 cholesterol record
Percentage per<strong>for</strong>mance gapBlood Sugar Control in DiabetesPer<strong>for</strong>mance gaps <strong>for</strong> optimum blood sugar control in diabetes are high and rangedfrom 16.5% to 51.3% against a <strong>Dudley</strong> average of 32% and an England average of33.5%. (Figure 8)There is a weak association between deprivation and practice per<strong>for</strong>mance withpoorer control being evident <strong>for</strong> practices in more deprived areas.Figure 8: Blood sugar control (HbA1c< 7.5) (r=0.43,r 2 =19%)4948294046.541.514235447194539362341<strong>15</strong>5036.52082853431.526.521.516.5373174392611210512718 3212 3013 2452 5314474631212564221633380 10 20 30 40 50 60 70Percentage of GP population in most deprived IMD quintileDM20 % Gap Mid Range IMD1 DM20 <strong>Dudley</strong> Average % Gap DM20 England Average % GapSource: Quality Outcomes Framework disease register 2008/09Primary Care Mortality Data GP Registered PopulationDepartment of Communities & Local Government Indices of Deprivation 2007Cardio-protective PrescribingPractice QOF per<strong>for</strong>mance <strong>for</strong> the prescribing of cardio-protective drugs is alsoextremely varied <strong>for</strong> all vascular disease/condition registers and was not associatedwith deprivation. QOF per<strong>for</strong>mance data does not give detail on whether drugs aretitrated to the optimum levels, only that they are prescribed so giving an insight intoaccess to treatment not equity of treatment outcomes. <strong>Dudley</strong>‟s averageper<strong>for</strong>mance is similar to the England average - slightly better <strong>for</strong> all indicators.Per<strong>for</strong>mance gaps were much lower <strong>for</strong> the prescribing of the clot preventing drugs(antiplatelet/anticoagulant).69
Table 4: Range of per<strong>for</strong>mance gapDisease/condition registerQOF clinical indicatorPercentagegap range<strong>Dudley</strong>averageCHD 11 (ACE-I/A2 Antagonist) 0% to 23.1% 10.0% 10.7%Diabetes <strong>15</strong>(ACE-I/A2 Antagonist) 0% to 100% 8.3% 10.3%CKD5(ACE-I/ARB) 0% to 100% 13.3% 13.3%Heart Failure 3(ACE-I/ARB) 0% to 20% 7.1% 10.0%CHD10 (Beta blocker) 0% to 46.1% 22.8% 27.5%CHD 9 (aspirin/anti-platelet or anticoagulate)Stroke12 (aspirin/anti-platelet or anticoagulate)AF3 (aspirin/anti-platelet or anticoagulate)Englandaverage0% to 14.5% 5.3% 5.8%0% to 13.5% 4.9% 5.9%0% to 10.6% 5.2% 6.3%Lifestyle Risk Management Service Referrals (LRMS)An important element of chronic disease management and secondary prevention isassessment of the patient‟s lifestyle and referral to LRMS where appropriate.Referral rates/practice were reviewed <strong>for</strong> physical activity referrals and 4 weeksmoking quitter rates. It was not possible to separate out primary and secondaryprevention referrals.Outcomes <strong>for</strong> stop smoking services in relation to 4-week quit rates were alsoreviewed to give an indication of the equity of treatment outcomes. Outcomes fromphysical activity referrals are not routinely available.Practice referral rates <strong>for</strong> physical activity were extremely varied and not related todeprivation. They were also very low across practices ranging from 0 to 16/1,000adult population with a <strong>Dudley</strong> average of 2.7/1,000. Overall 4 week quit outcomes<strong>for</strong> stop smoking were high, ranging from 250 to 721/1,000 referred adult populationwith a <strong>Dudley</strong> average of 500/1,000. (Figure 9)Practice referral rates <strong>for</strong> smoking showed a medium positive relationship todeprivation, with practices in deprived areas having higher referral rates. Thismatches need and suggests equitable provision as prevalence of smoking is greaterin areas of higher deprivation. However outcomes across practices were very variedwith practices in deprived areas having lower 4 week quit rates. So although peoplein deprived areas are more likely to be referred, they are less likely to stop smoking.(Figure 10)70
Referrals/1000 Adult Population4-week quitters rate/1000 referred populationFigure 9 : 4-week quit rates per practice IMD (r=0.3)7006506005505004504003504 143264246183347138321663019123735 4420 43213171017132495124528452895339272553623224029<strong>15</strong>11344<strong>15</strong>03002500 10 20 30 40 50 60 70Percentage of GP population in most deprived IMD quintile484-week quitters/1000 referred adult populationMid Range IMD1<strong>Dudley</strong> Average of 4-week quitters/1000 referred adult populationEngland Average of 4-week quitters/1000 referred adult populationSource: <strong>Dudley</strong> Stop Smoking ServicePrimary Care Mortality Data GP Registered PopulationDepartment of Communities & Local Government Indices of Deprivation 2007Figure 10: Stop Smoking Service Referrals per Practice IMD (2008/9data)(r=0.49)40354941302520445247512495393611<strong>15</strong>20<strong>15</strong>1053130121 23613423332 4335 10 438718141619372617462145828532548232229405000 10 20 30 40 50 60 70 80Percentage of GP population in most deprived IMD quintileReferrals/1000 adult population<strong>Dudley</strong> Average of referrals/1000 registered adult populationMid Range IMD1England Average of Referrals/1000 registered adult population (Est)Source: <strong>Dudley</strong> Stop Smoking ServicePrimary Care Mortality Data GP Registered PopulationDepartment of Communities & Local Government Indices of Deprivation 200771
Conclusions:The general conclusions from the analysis of QOF outcomes is that practiceper<strong>for</strong>mance variance is very high and is not explained to a great extent bydeprivation factors. In summary:- There is a high level of under-reporting of prevalence, <strong>for</strong> all key vasculardiseases/conditions, particularly <strong>for</strong> hypertension- Deprivation factors are associated with lower prevalence recording <strong>for</strong> stroke andCHD- There is a great variation in practice per<strong>for</strong>mance <strong>for</strong> all vascular diseaseregisters <strong>for</strong> all indicators - prevalence recording, exception reporting, clinicaltreatment and control- There are a number of practices that are consistent poor per<strong>for</strong>mers.- There are high numbers of patients that are not being treated to optimum levels<strong>for</strong> blood pressure, cholesterol or blood sugar across the CHD, hypertension,stroke, diabetes and CKD registers- Differences in access due to deprivation was not evident in the access totreatment once a patient is on a disease register. This was highlighted by theQOF indicators on exception reporting, blood pressure and lipid measurement,drug prescribing and referral to LRMS.- Deprivation was a factor in relation to differences in outcome of treatment <strong>for</strong>some risk factors specifically the control of blood sugar and success at stoppingsmoking. It did not have an impact <strong>for</strong> the control of blood pressure or lipids.- Low access rates were noted <strong>for</strong> exercise referral programmes, but access tostop smoking services was high.RecommendationsThe <strong>Tackling</strong> <strong>Inequalities</strong> in life expectancy in areas with the worst health anddeprivation (Great Britain. Department of <strong>Health</strong>, <strong>2010</strong>) recommends 3 keyinterventions to provide a cost-effective way of reducing the gap in life expectancy inrelation to CVD:Increase the prescribing of drugs to control blood pressure by 40%Increase the prescribing of drugs to reduce cholesterol by 40%Double the capacity of stop smoking servicesThese have been taken into consideration in the following recommendations whichfocus in 3 areas:Ensuring strategies are in place <strong>for</strong> risk factor reduction, case-finding and earlydetection of the key vascular diseasesEnsuring that high risk groups can access and use services and achieveequitable treatment outcomes<strong>Tackling</strong> the variation in practice per<strong>for</strong>mance and raising the level of overallper<strong>for</strong>mance to ensure more patients are treated to optimum levels. This prioritywill be covered in Section 8.1 on primary care.72
The key priorities <strong>for</strong> action include:1. Reduction in the gaps between actual and expected prevalence <strong>for</strong> the keyvascular diseases via:The implementation of NHS health checks, to ensure a high uptakefrom those who are most at risk and more unlikely to take up a healthcheck e.g. men, BME communities and low income groups. Targetedpromotions, out-reach services and case-finding especially in relationto hypertension should be part of this response.Investigate practice outliers with low levels of prevalence <strong>for</strong> the CHDand stroke registers2. Variation in per<strong>for</strong>mance across practices <strong>for</strong> treatment outcomes:Investigate per<strong>for</strong>mance <strong>for</strong> practice outliers starting with bloodpressure and cholesterol management3. Develop an on-going programme of health equity audits supported by theincorporation of a health equity element into all planned primary care/serviceaudits. E.g. medicines management audits, service reviews, improved ethnicitymonitoring across primary care/ community services.4. Put strategies in place to increase referrals to LRMS <strong>for</strong> those on practiceregisters and improve outcomes <strong>for</strong> patients from deprived areas.5. Develop and implement a self care strategy as part of the long term conditionsstrategy so there is a menu of quality assured options <strong>for</strong> all newly diagnosedvascular patients.73
7.2 ACUTE CARDIO-VASCULAR DISEASE (CVD), TRANSIENT ISCHAEMICATTACK (TIA) AND STROKEThis section focuses on the priority areas of acute care <strong>for</strong> CHD, specifically acutemyocardial infarction (AMI) or heart attack, TIA and stroke.Coronary Heart Disease (CHD)A heart attack is said to have occurred when the myocardium (heart muscle) isdamaged as a result of impaired blood supply. This is known as a myocardialinfarction. The amount of damage is greatest when the blood supply to part of theheart is cut off altogether as a result of a thrombus (blood clot <strong>for</strong>mation) within oneof the coronary arteries (blood vessels) supplying that area of the heart. Under thesecircumstances, the electrocardiogram (ECG) recorded after the onset of occlusionwill usually show an abnormality termed „ST elevation‟. Patients suffering from thiscondition are said to have sustained „ST elevation myocardial infarction‟, abbreviatedto STEMI and require emergency reperfusion treatment with either thrombolyticdrugs or, the preferred option, primary percutaneous coronary intervention (PCI) byangioplasty and stenting, aiming to treat within 1 hour of the onset of symptoms.Non-ST elevation myocardial infarction or NSTEMI does not require very rapidemergency reperfusion treatment, but does require specialist cardiologyinvolvement, access to angiography and coronary intervention in the <strong>for</strong>m of drugs orrevascularisation. STEMI accounts <strong>for</strong> approximately 40% and NSTEMI 60% of allMIs, although the number of STEMI is falling and NSTEMI remaining static (MINAP,2009).Establishing the level of health equity involves investigating if differences exist inaccess and treatment/ treatment outcomes based on deprivation, ethnicity, age, sexand occupation. The extent to which this can be achieved easily depends on thelevel of data available especially within routine data sets and also thecoverage/reach of a service or programme. Routine hospital activity data has beenused to examine equity of access, treatment/treatment outcomes. Areas reviewedinclude:AdmissionsTotal admissions <strong>for</strong> CVDAdmissions, and access to diagnostics and interventional treatment <strong>for</strong>acute myocardial infarction( AMI)Secondary Prevention Prescribing <strong>for</strong> AMICardiac rehabilitationTotal admissions <strong>for</strong> all CVD increased by a small but statistically significant amount<strong>for</strong> the 3 year rate (2006/7-2008/9) This increase was due to an increase in electiveadmissions, particularly <strong>for</strong> women. (Figure 1). Emergency admissions remainedconstant. (Figure 2). All increases relate to hypertension admissions both electiveand emergency particularly <strong>for</strong> men and also to elective diabetes admissionsparticularly <strong>for</strong> women. The admissions data <strong>for</strong> CVD and AMI shows that at themacro level, admissions generally reflected the higher risk and needs of specific74
Standardised Rate per 100,000 PopulationStandardised Rate per 100,000 Population2003/04-2005/062003/04-2005/062004/05-2006/072004/05-2006/072005/06-2007/082005/06-2007/082006/07-2008/092006/07-2008/09population groups including men, BME and deprived groups but that other factorsother than actual need, strongly influenced access to treatment once deprivation, sexand age were accounted <strong>for</strong>.Figure 1:1,000Directly Standardised Rates of Elective admissions All CVD by Year3-Year Rates, <strong>Dudley</strong> MBC, Males & Females All Ages, 2003/04-2005/06 to2006/07-2008/099008007006005004003002001000Figure 2:1,200Directly Standardised Rates of Emergency admissions All CVD by Year3-Year Rates, <strong>Dudley</strong> MBC, Males & Females All Ages, 2003/04-2005/06 to2006/07-2008/091,000800600400200075
Standardised Rate per 100,000 PopulationStandardised Rate per 100,000 PopulationFigure 3:2,500Directly Standardised Admission Rates from All admissions All CVD by IMD2007 National Quintile5-Year Rates, <strong>Dudley</strong> MBC, Males & Females Aged All Ages, 2004-20082,0001,5001,0005000Figure 4:4,000Directly Standardised Admission Rates from All admissions All CVD byEthnic group5-Year Rates, <strong>Dudley</strong> MBC, Both Sexes, All Ages, 2003-20073,5003,0002,5002,0001,5001,0005000Chinese and OtherEthnic GroupAsian Black White Mixed76
Standardised Rate per 100,000 PopulationStandardised Rate per 100,000 PopulationFigure 53500Directly Standardised Admission Rates from All admissions All CVD byPercentage of GP population in the Most Deprived IMD 2007 QuintileBoth Sexes, All Ages, 200830005325004840Correlationcoefficient0.5022000<strong>15</strong>0010005230121<strong>2010</strong>7423 433162 3135618 3214 4938444751462124 17192613 4384592852527392322361141 34 29<strong>15</strong>50DSR<strong>Dudley</strong> averageMid range IMD 13750000% 10% 20% 30% 40% 50% 60% 70% 80%Percentage of GP population in most deprived IMD quintileSource: Secondary Users Service (SUS) Hospital AdmissionsPrimary Care Mortality Data GP Registered PopulationDepartment of Communities & Local Government Indices of Deprivation 2007Figure 6:1800Relationship between Directly Standardised Admission Rates from Alladmissions CHD and Expected Disease Prevelance by GP PracticeBoth Sexes, All Ages, 2008Correlation coefficient = -0.253160014001200100080060040020000.0% 1.0% 2.0% 3.0% 4.0% 5.0% 6.0% 7.0% 8.0%Expected DiseasePrevalence (%)Source: Secondary Users Service (SUS) Hospital AdmissionsPrimary Care Mortality Data GP Registered PopulationQuality and Outcomes Framework 2008/0977
Timely ResponseApproximately 30% of patients who die of MI do so be<strong>for</strong>e reaching hospital. For theremainder, their prognosis is dependent on the time it takes to restore blood flow tothe ischaemic myocardium. The earlier reperfusion is achieved, the greater thebenefit. Mortality is twice as high in patients treated 4-6 hours after the onset ofsymptoms as it is in patients treated within 1-2 hours. There<strong>for</strong>e, it is imperative thatpatients suffering an MI should receive medical attention as quickly as possible (BHF,2006).Timely access to treatment <strong>for</strong> AMI is dependent on:o Public knowledge and awareness of signs, symptoms and speed ofresponseo Emergency response timeso Access to timely diagnostics and treatment - reperfusionPublic knowledge and awareness of the symptoms and need to call 999 is low in thegeneral population and pre-hospital delays are greater in older people, women,deprived, ethnic groups and patients with pre-existing conditions. Currently there areno national or local awareness campaigns running.Emergency reperfusion <strong>for</strong> <strong>Dudley</strong> patients is delivered by a tertiary level PrimaryPCI service <strong>for</strong> STEMI MI at the Heart and Lung Centre at New Cross Hospital(NCH) Wolverhampton. The Black Country is one of the first to roll out this service,with coverage across England currently at only 25% (MINAP, 2009). National goodpractice standards <strong>for</strong> PPCI have been set of 90 minutes between arrival atinterventional centre and reopening of artery (door to balloon) and <strong>15</strong>0 minutes fromcall <strong>for</strong> help to reopening of the artery (call to balloon). Door to balloon times aredependant on speed of access to diagnostics and treatment within the hospital andcall to balloon time incorporates ambulance response times and triage via otheradmission routes as well as hospital efficiency. Per<strong>for</strong>mance at NCH <strong>for</strong> 2008/9 wasclose to the average <strong>for</strong> England (Table 1).Table 1: Speed of Access Measures <strong>for</strong> PPCI (Source MINAP data 2009)PPCI measures ( door to balloon) (call to balloon)New cross hospital 82% 77%England average 84% 79%Source MINAP data 2009Door to balloon times are specifically influenced by the method of admission.Routine data analysis at New Cross shows a mean average door to needle time <strong>for</strong>999 ambulance admissions directly to the heart and lung centre as 67.8 minutescompared to 83.1 minutes <strong>for</strong> other admission methods e.g. via self presentation atNew Cross A&E. 28% of patients entered the pathway by the self presentation route.This reiterates the need <strong>for</strong> public awareness campaigns.Acute MI is dealt with as a Category A call with a target response time of 8 minutes.Weekly Category A response times <strong>for</strong> the WMAS during 09/10 ranged frombetween 55% to 85% with an average of 72.3%.78
Angiographies Ward Rate (Crude Rate per 100,000)IMD ScoreFigure 7: Angiogram Access Source: <strong>Dudley</strong> PCT (r=0.35)1000Relationship Between Angiography Rates and Coronary Heart DiseaseMortality Rates per 100,000 population <strong>for</strong> <strong>Dudley</strong> Wards 2008-0990080070060050040030020010000 50 100 <strong>15</strong>0 200 250 300 350CHD Mortality Rate (Crude Rate per 100,000)Office of National Statistics (ONS) Annual Deaths ExtractFigure 8: Angiogram Access (r=0.34)50Mostdeprived45Crude Angiographies Rate 2008/09 Compared With IMD(2007) Score <strong>for</strong><strong>Dudley</strong> Wards4035302520<strong>15</strong>105Leastdeprived00 100 200 300 400 500 600 700 800 900 1000Angiographies crude rate per 100,000 populationSource:Office of National Statistics (ONS) Annual Deaths ExtractOffice of National Statistics (ONS) Mid-Year Population EstimatesDepartment of Communities & Local Government Indices of Deprivation 200780
IMD ScoreRevascularisation Ward Rate (Crude Rate per 100,000)Figure 9: Revascularisation Access (r=0.34)400Relationship Between Revascularisation Rates and Coronary Heart DiseaseMortality Rates per 100,000 population <strong>for</strong> <strong>Dudley</strong> Wards 2008-09350300250200<strong>15</strong>01005000 50 100 <strong>15</strong>0 200 250 300 350CHD Mortality Rate (Crude Rate per 100,000)Source: Secondary Users Service (SUS) Hospital AdmissionsOffice of National Statistics (ONS) Annual Deaths ExtractOffice of National Statistics (ONS) Mid-Year Population EstimatesFigure10: Revascularisation Access (r=0.26)Mostdeprived5045403530Crude Revascularisations Rate per 100,000 <strong>Dudley</strong> Resident PopulationCompared With Index of Multiple Deprivation (IMD) 2007 Score For <strong>Dudley</strong>Wards, 2008/092520<strong>15</strong>1050Least0deprived50 100 <strong>15</strong>0 200 250 300 350 400Revascularisations crude rate per 100.000 populationSource: Office of National Statistics (ONS) Mid-Year Population EstimatesDepartment of Communities & Local Government Indices of Deprivation 200781
Cardiac Rehabilitation<strong>Dudley</strong> has a gold star cardiac exercise rehabilitation service providing a 26 weekstructured exercise programme at phase 3 followed by a further 26 weeksmaintenance programme at phase 4. All patients are offered cardiac exerciserehabilitation post MI, and post MI revascularization, PCI, PPCI and CABG, and <strong>for</strong>stable and unstable angina. Table 2 shows uptakes across the conditions werevariable <strong>for</strong> 2008/9 in <strong>Dudley</strong> reflecting the national picture.Table 2CardiacRehabilitationUptake Rates(2008/9)TotalpatientsdischargedwithprimarydiagnosisEstimated No ofpatientseligible/referred<strong>for</strong> cardiac rehab*Numberstartingcardiacrehab% of thoseeligiblestartingcardiacrehabAcute MI 362 304 131 43.1%CoronaryrevascularisationCABG/PCI388 326 <strong>15</strong>6 47.8%ACS unstable 147 124 30 24.2%anginaStable Angina 145 122 42 34.4%PPCI 114 95 68 71.6%Other (HF, 144 121 52 42.9%arrhythmias)*This data was not routinely available <strong>for</strong> 08/09, hence this is an estimation based onthe Black Country Cardiac Network uptake of cardiac rehabilitation study whichidentified an 84% uptake rate <strong>for</strong> Action Heart. This data will be routinely availablefrom 09/10.An uptake study was conducted across the Black Country during 2008/9 whichidentified that 16% of patients were not referred <strong>for</strong> Cardiac Rehabilitation in <strong>Dudley</strong>and showed significant differences in referral by age, diagnostic group, ethnicity,gender and employment status. The audit was repeated during 09/10 with largernumbers so that a more detailed analysis could be carried out at each healtheconomy level but this is not yet available.ConclusionsThe general conclusions from this acute CHD <strong>Health</strong> Needs Assessment are:The admissions data <strong>for</strong> CVD and AMI shows that at the macro level, admissionsgenerally reflect the higher risk and needs of specific population groups includingmen, BME and deprived groups but that other factors other than actual need,strongly influence access to treatment once deprivation, sex and age areaccounted <strong>for</strong>.Public knowledge and awareness of the symptoms and need to call 999 is low inthe general population and pre hospital delays are greater in older people,women and patients with pre-existing conditions. There are also health seekingbehaviour differences <strong>for</strong> ethnic and deprived groups82
That an increase in access to diagnostics and revascularisation <strong>for</strong> acute MIresulting from the opening of the tertiary PPCI service and general capacityimprovements within secondary care has improved the equity of access andnarrowed inequalities over the last five years. Some factors besides actual needare still an influence.That there are significant differences in referral to cardiac rehabilitation by age,diagnostic group, ethnicity, gender and employment status that needs to beinvestigatedRecommendations <strong>for</strong> Acute CHDThe NST identifies a number of priority areas <strong>for</strong> action and this section draws onthose in conjunction with the main findings from this health needs assessment:Introduce public awareness campaigns with a targeted approach to groups withhigher needs; over 65s, BME, women and deprived areas. <strong>Health</strong> careprofessionals should take every opportunity to advise all patients with, or at highrisk of, vascular disease to call 999 should they experience unexplained chestpain.Continue to embed delivery of expanded services <strong>for</strong> acute MI diagnostics andrevascularisation and review the equity of provision in a further 5 years time.Investigate reasons <strong>for</strong> „no procedures‟ being undertaken with the PPCI serviceRepeat the cardiac rehabilitation equity audit with larger numbers to establish afuller picture and implement recommendations made from this. This shouldinclude a review of DNAs and DNRs <strong>for</strong> cardiac rehabilitation and theestablishment of routine procedure to follow-up these groups.Transient Ischemic Attack (TIA) and StrokeUntil fairly recently society has been fatalistic about stroke seeing it as an inevitabilityof aging. However medical and technological advances have trans<strong>for</strong>med ourunderstanding of the brain and the treatments available <strong>for</strong> restoring blood flow andimproving brain function when areas of the brain get damaged. It is now recognizedthat time is critical – the faster someone reaches expert help, the greater theirchances of making a full recovery.The National Stroke <strong>Strategy</strong> (Great Britain. Department of <strong>Health</strong>, 2007a) waspublished with a view to introduce a comprehensive revolution of stroke services withthe implementation of rapid response systems that get people to centres of expertisequickly, directly to the scan they need and onwards to appropriate treatment andcare. Key priorities within the stroke strategy include:the need to speed up access to diagnostic scanning/imaging <strong>for</strong> TIAthe need to ensure stroke is treated as a medical emergency (hyper acutestroke) with access to diagnostics and thrombolysis within an appropriatetimeframe. „Time means brain‟.improving rehabilitation and long term careThe stroke strategy was followed by the Accelerating Progress in Stroke CareImprovement Programme in March <strong>2010</strong> which set a number of national indicators<strong>for</strong> stroke and TIA care with targets <strong>for</strong> achievement by April 2011 (Figure 11) to83
speed up delivery of the National Stroke <strong>Strategy</strong> within the worsening financialclimate. NICE have also produced a set of quality standards that dovetail into thenational indicators. Best practice tariffs have also been introduced from April <strong>2010</strong>incentivising hospitals to achieve targets and quality standards in relation to careprovided on an acute stroke unit and timely delivery of initial brain imaging.Figure 1184
Establishing the level of health equity involves investigating if differences exist inaccess and treatment/ treatment outcomes based on deprivation, ethnicity, age, sexand occupation. The extent to which this can be achieved easily depends on thelevel of data available especially within routine data sets and also thecoverage/reach of a service or programme. Developments within stroke/TIA arerelatively new - coverage of new service developments are low and data systems arein development or very recently implemented. As a result this section has gaps in itsanalysis and makes recommendations <strong>for</strong> future audits. Areas reviewed include:admissions <strong>for</strong> stroke and TIA,timely access to treatment <strong>for</strong> emergency stroke and TIA,access to timely diagnostics and treatment <strong>for</strong> urgent and non-urgent strokeand TIA.The pathways <strong>for</strong> stroke and TIA can be categorised into urgent and non urgent. Forurgent (hyper acute) patients should be admitted to a stroke ward, given theappropriate scans within 1 hour and thrombolysed within 3 hours. <strong>Dudley</strong> Group ofHospitals introduced a 24/7 thrombolysis service in 2007 to meet this requirement.For non urgent stroke, patients should be admitted to a stroke ward and scannedwithin 24 hours. TIA patients identified as urgent - at high risk of stroke, may or maynot be admitted, but should be scanned and treated within 24 hours. Those at lowrisk should be treated and managed within 7 days. In <strong>Dudley</strong>, a fast track referralsystem operates within the hospital and throughout primary care to ensure urgentand non urgent cases are treated at the TIA clinic within the necessary time frames.AdmissionsEmergency admissions have been relatively static over the last 5 years <strong>for</strong> both menand women, while elective admissions have risen, especially <strong>for</strong> men, although thisis not a statistically significant rise. Men have higher rates of admissions thanwomen overall, which reflects their higher risk of CVD. The admissions data <strong>for</strong>stroke and TIA shows that at the macro level, admissions generally reflected thehigher risk and needs of specific population groups including men, BME anddeprived groups but that factors other than actual need, strongly influenced accessto treatment once deprivation, sex and age were accounted <strong>for</strong>.85
Standardised Rate per 100,000 PopulationStandardised Rate per 100,000 Population2003/04-2005/062003/04-2005/062004/05-2006/072004/05-2006/072005/06-2007/082005/06-2007/082006/07-2008/092006/07-2008/09Figure 12160Directly Standardised Rates of Emergency admissions Stroke TIA by Year3-Year Rates, <strong>Dudley</strong> MBC, Males & Females All Ages, 2003/04-2005/06 to2006/07-2008/091401<strong>2010</strong>0806040200Figure 1335Directly Standardised Rates of Elective admissions Stroke TIA by Year3-Year Rates, <strong>Dudley</strong> MBC, Males & Females All Ages, 2003/04-2005/06 to2006/07-2008/09302520<strong>15</strong>105086
Standardised Rate per 100,000 PopulationStandardised Rate per 100,000 PopulationFigure 14700Directly Standardised Admission Rates from All admissions Stroke TIA byEthnic group5-Year Rates, <strong>Dudley</strong> MBC, Both Sexes, All Ages, 2003-20076005004003002001000Chinese and OtherEthnic GroupAsian Black Mixed WhiteFigure <strong>15</strong>250Directly Standardised Admission Rates from All admissions Stroke TIA byIMD 2007 National Quintile5-Year Rates, <strong>Dudley</strong> MBC, Males & Females Aged All Ages, 2004-2008200<strong>15</strong>010050087
Standardised Rate per 100,000 PopulationStandardised Rate per 100,000 PopulationFigure 16:500Directly Standardised Admission Rates from All admissions Stroke TIA byPercentage of GP population in the Most Deprived IMD 2007 QuintileBoth Sexes, All Ages, 200845040035050Correlationcoefficient0.454300482502791120046 242653630 184552 5323<strong>15</strong>07492183 2016134141925294742513410012 35104333 62841 <strong>15</strong>444011739503832222373100% 10% 20% 30% 40% 50% 60% 70% 80%Percentage of GP population in most deprived IMD quintileDSR<strong>Dudley</strong> averageMid range IMD 1Source: Secondary Users Service (SUS) Hospital AdmissionsPrimary Care Mortality Data GP Registered PopulationDepartment of Communities & Local Government Indices of Deprivation 2007Figure 17500450Relationship between Directly Standardised Admission Rates from Alladmissions Stroke TIA and Expected Disease Prevelance by GP PracticeBoth Sexes, All Ages, 2008Correlation coefficient = -0.302400350300250200<strong>15</strong>01005000.0% 0.5% 1.0% 1.5% 2.0% 2.5% 3.0% 3.5% 4.0%Source: Secondary Users Service (SUS) Hospital AdmissionsPrimary Care Mortality Data GP Registered PopulationQuality and Outcomes Framework 2008/09Expected DiseasePrevalence (%)88
Timely ResponseTimely access to treatment <strong>for</strong> stroke/TIA is dependent on:Public knowledge and awareness of signs, symptoms and speed of responseAmbulance response times and use of validated tools to diagnose stroke/TIAAccess to timely diagnostics and treatmentPublic knowledge and awareness of the symptoms and need to call 999 <strong>for</strong> stroke islow. The national F.A.S.T campaign was introduced in 2009 and evaluation of thiswas carried out in May 2009 by Central Office of In<strong>for</strong>mation on behalf of theDepartment of <strong>Health</strong> (Central Office of In<strong>for</strong>mation, 2009), and has shown somepositive results. Pre and post awareness levels were measured and showedincreases in the need to call 999 from 58% to 70% amongst the general population(52% to 62% amongst the black Caribbean and South Asian populations),awareness of early detection being beneficial from 53% to 66% in the generalpopulation (42% to 51% <strong>for</strong> black Caribbeans and South Asians) and in recognitionof symptoms from 79% to 89% in the general population (67% to 83% <strong>for</strong> blackCaribbeans and South Asians). The lower levels of awareness within key Black andMinority Ethnic communities needs to be addressed since they are at higher risk ofstroke. Lower levels of awareness has also been found <strong>for</strong> the over 65s (The StrokeAssociation, 2007). Local data <strong>for</strong> awareness in <strong>Dudley</strong> is not available; howeverone can assume a similar pattern of awareness. There have been a number of FASTcampaigns in <strong>Dudley</strong> which have been aimed at the general population, particularlyin lower income areas. There are currently no targeted campaigns <strong>for</strong> older people orBME communities.For those who call 999, thrombolysis can be an effective treatment <strong>for</strong> stroke ifdelivered within 3 hours of the on-set of symptoms, thus the patient needs to bediagnosed using FAST, receive a category A ambulance response (8 minuteresponse) with rapid referral to hospital <strong>for</strong> imaging within one hour and subsequentdrug administration. TIA patients that are of a high risk of stroke are also required tobe identified using the ABCD2 score and imaged within 24hours. The NICE qualitystandard measures the proportion of total stroke and TIA screened by ambulancestaff and transferred to a stroke unit within one hour. This is a new metric, and the 4months data <strong>for</strong> <strong>2010</strong> shows a slow increase to 25% in May <strong>2010</strong> against a target of100%.TIA and Stroke Diagnostics and ServicesThe accelerating stroke programme and associated targets was only recentlylaunched in March <strong>2010</strong> hence the metrics, and data collection processes andservice developments are relatively new. Table 3 gives a snapshot of <strong>Dudley</strong>‟sposition against April 2011 targets. Data available in most cases is just 4 months.The table indicates the month 4 position (May).89
Table 3Metric <strong>for</strong> May <strong>2010</strong>(unless stated)April2011targetHigh risk TIA treated within 24hours 64% (09/10 yr data) 60%Stroke patients scanned within 1 hour of hospital arrival 14% 50%Confirmed ischemic stroke thrombolysed 3% 10%Stroke patients scanned within 24 hrs of hospital arrival 55% 100%Patients spending 90% of time on stroke unit 71% 80%Eligible patients receiving first dose of aspirin ( or alt)within 24 hours71% 100%Stroke patients with AF anti-coagulated on discharge 35% 60%Generally, service and pathway developments are in the early stages ofadvancement and it is too early <strong>for</strong> a realistic focus on equity auditing. The priority isto continue to increase general capacity and speed of access to diagnostics andtreatment and achieve the April 2011 targets <strong>for</strong> the metrics above. If any metricsremain significantly below target, equity auditing can be considered to comparedemographics of patients receiving optimum versus non optimum care.Conclusions:The general conclusions from this acute stroke/TIA health inequalities health needsassessment are:The admissions data <strong>for</strong> stroke/TIA shows that at the macro level, admissionsreflect the higher risk and needs of specific population groups including men,BME and deprived groupsPublic knowledge and awareness of the symptoms and need to call 999 is lowerin certain high risk groups - particularly BME groups and over 65sService and pathway developments <strong>for</strong> acute stroke/TIA are in the early stages ofadvancement following the publication of the National Stroke <strong>Strategy</strong> (GreatBritain. Department of <strong>Health</strong>, 2007) in December 2007 and the acceleratingStroke Improvement Programme in March <strong>2010</strong> and it is too early <strong>for</strong> a realisticfocus on equity auditing. The priority is to continue to increase general capacityand speed of access to diagnostics and treatment as identified within thePCT‟s/health economy‟s current priorities and work-streams and driven bycontinual review of vital signs, national targets and sentinel audit data.Recommendations <strong>for</strong> Acute Stroke/TIAThe NST identifies a number of priority areas <strong>for</strong> action and this section draws onthose in conjunction with the main findings from the HNA:Continue FAST awareness programmes with an emphasis on segmentation anduse of social marketing to ensure the message reaches all communities, toinclude the development of targeted campaigns <strong>for</strong> BME and the over 65s90
Continue implementation of current stroke/TIA workstreams to increase speed ofaccess to diagnostics and treatment to meet the national targets set out in theaccelerating stroke improvement programme in all cases, specifically:If any metrics remain significantly below target, consider equity auditing tocompare demographics of patients receiving optimum versus non optimumcare.Audit GP TIA referrals data <strong>for</strong> consistencyReview GP practice per<strong>for</strong>mance <strong>for</strong> outlying practices in relation toadmissions data91
7.3 TOBACCO CONTROLIntroductionTobacco control is collective action taken to reduce smoking prevalence; as researchshows that no single approach to tackling smoking will be successful in isolation. TheGovernment has implemented a comprehensive range of measures over the lastdecade based on the World <strong>Health</strong> Bank recommendations known as the „six strand‟approach. The six strands are:1. Reducing exposure to secondhand smoke (SHS)2. Communication and education3. Reducing the availability and supply of cheap tobacco4. Support <strong>for</strong> stop smoking services5. Reducing tobacco promotion6. Tobacco regulationThis approach has been shown to be highly effective in England with some of themeasures being largely self sustaining, <strong>for</strong> example the health warnings on tobaccopacks and smokefree public places. Key areas that require continued funding andintervention at local level are the provision of stop smoking services, tackling illicittobacco and communications and education campaigns (APPG, <strong>2010</strong>).Cigarette smoking is closely and pervasively linked to a wide range of markers ofsocioeconomic and personal disadvantage resulting in increased well known healthrisks. Smoking also directly exacerbates poverty, by taking up a substantialproportion of disposable income and pre-empting expenditure on basic necessitiessuch as food and clothing (RCP, 2000).Nationally, around 35% (22,000) of all deaths due to respiratory diseases and 29%(37,500) of all cancer deaths were attributable to smoking. In addition, 14% (20,600)of deaths due to circulatory diseases and 6% (1,300) of deaths due to diseases ofthe digestive system were attributable to smoking (ONS, <strong>2010</strong>). In <strong>Dudley</strong>, it isestimated that between 2006-8, there were 1,497 deaths that were attributableto smoking (<strong>Dudley</strong> PCT, 2009a).Smoking in pregnancy can increase infant mortality by approximately 40% (GreatBritain. Department of <strong>Health</strong>, 2009b). Babies born into poorer households aresignificantly more heavily exposed to passive smoking throughout infancy andchildhood, and non-smokers living in more deprived circumstances remain moreheavily exposed to other people‟s smoke throughout life. Being born into anenvironment where smoking is modelled as the norm inevitably leads to higher ratesof smoking uptake in adolescents from poor backgrounds (RCP, 2000), there<strong>for</strong>eperpetuating smoking and health inequalities.Smoking prevalence in pregnant women nationally was 14% in 2008 as measuredby women‟s self-reporting at the time of delivery (this is widely thought to be anunderestimate since there is evidence of significant underreporting. (Great Britain.Department of <strong>Health</strong>, 2009b) . The PSA (<strong>2010</strong>) target was to:92
“reduce smoking during pregnancy to 11% by 20<strong>15</strong>In <strong>Dudley</strong> smoking prevalence at time of delivery reduced from 17% in 2005 to <strong>15</strong>%in 2009 then rose again in <strong>2010</strong> to 17%. (DGH, <strong>2010</strong>). However data from thePerinatal and Infant Mortality programme, shows <strong>Dudley</strong> to have a prevalence of9.5% at delivery <strong>for</strong> 2009 and 5.7% <strong>for</strong> <strong>2010</strong> (Q1&Q2), with <strong>Dudley</strong> achieving thehighest smoking cessation rates across the West Midlands. This data collection wasfunded by the NHS West Midlands „Investing <strong>for</strong> <strong>Health</strong>‟ programme and collectsroutine data from maternity handheld records, including smoking status at booking,delivery and smoking cessation rates, on a case by case basis. The aim is tounderstand the key reasons why perinatal and infant mortalities occur, and developearly interventions which will reduce their incidence. This data is audited regularlyand shows good quality case ascertainment and data collection. Work is ongoing inpartnership with Midwifery Services to understand the reasons <strong>for</strong> the data variationsbetween the two methods and improve data quality and reporting.Overall smoking prevalence in England has decreased from 28% in 1998 to 21% in2008, with 21% of men and 20% of women reporting smoking (NICE, 2008b).However, prevalence of smoking amongst people in the routine and manual socioeconomicgroup continues to be greater than amongst those in the managerial andprofessional group 26% and <strong>15</strong>% respectively in 2007. In 2008 the prevalence in theroutine and manual group rose slightly to 28% (ONS, <strong>2010</strong>) highlighting there is stillmore to be done to achieve the <strong>2010</strong> Public Service Agreement on smoking to:“reduce adult smoking rates to 21% or less by <strong>2010</strong>, with a reduction in prevalenceamong routine and manual groups to 26% or less”The overall smoking prevalence <strong>for</strong> <strong>Dudley</strong> as determined by the <strong>Dudley</strong> <strong>Health</strong>Survey 2009 is 18.5% (<strong>Dudley</strong> PCT, 2009b). Whilst the overall smoking prevalenceis lower than the national average, and has fallen from 21% in 2004 it variessignificantly with ward area, social deprivation, age, and gender.Smoking Prevalence by Ward AreaTable 1 shows smoking prevalence by ward in <strong>Dudley</strong>. The wards with smokingprevalence higher than both the national and local average in bold type are BrierleyHill (26%) closely followed by Castle and Priory, St Andrews, Quarry Bank andCradley (25%), Coseley West (24%), St Thomas (23%), Lye and Wollescote,Brockmoor and Pensnett and Gornal Wood (22%). Wall Heath and Kingswin<strong>for</strong>dNorth has the lowest prevalence at 9%.93
Table 1Ranking of <strong>Dudley</strong> Wards of Indices of Multiple Deprivation (IMD 2007)comparable to smoking prevalence 2009Ward NamesIMD 2007 National Rank1 = Most Deprived7928 = Least DeprivedSmoking Prevalence2009Castle & Priory 504 25%St. Thomas 644 23%Netherton & Woodside 696 19%Brierley Hill 807 26%Lye & Wollescote 1008 22%St. James 1066 18%Brockmoor & Pensnett 1138 22%St. Andrews 1264 25%Coseley East 1655 20%Quarry Bank & Cradley 2106 25%Belle Vale & Hasbury 2<strong>15</strong>0 18%Coseley West 2249 24%Gornal Wood 2360 22%Halesowen North 2487 16%Wollaston & Stourbridge West 2994 18%Hayley Green 3775 14%Ward NamesIMD 2004 National Rank1 = Most Deprived7932 = Least DeprivedSmokingPrevalence2009Wordsley 4<strong>15</strong>3 18%Amblecote 4252 14%Kingswin<strong>for</strong>d South 4804 18%Pedmore & Stourbridge East 4806 20%Norton 5065 12%Halesowen South 5457 18%Sedgley 5704 14%Wall Heath & Kingswin<strong>for</strong>dNorth 5954Among the 10% most deprived wards nationallyAmong the 10 – 50% most deprived wards nationallyAmong the 50% least deprived wards nationally9%Smoking Prevalence by DeprivationFigure 1 shows the smoking prevalence by IMD quintile in <strong>Dudley</strong> which highlights in2009 the proportion of smokers in the most deprived areas was 26% compared to12.5% in the least deprived area. This compares to the national picture indicatingfurther targeting of services <strong>for</strong> smokers in these groups is needed.94
Percentage who currently smokePercentage who currently smokeFigure 145%<strong>Dudley</strong> <strong>Health</strong> Survey 2004 and 2009: Directly standardised proportion ofrespondents who currently smoke, by year and IMD 2007 National quintile40%35%30%25%20%<strong>15</strong>%10%5%0%Quintile 1 - MostdeprivedQuintile 2 Quintile 3 Quintile 4 Quintile 5 - Leastdeprived2009 2004Source: <strong>Dudley</strong> <strong>Health</strong> Survey 2004 and 2009Smoking by Age and GenderFigure 2 shows the smoking prevalence by age band and gender in <strong>Dudley</strong>. In bothsexes the proportion of respondents who smoke is highest in 18-24 year olds andfalls with increasing age. In 18-24 year olds the proportion of females who smoke ishigher than the proportion of males, but in all other age bands the proportion ishigher in males than females. Overall more men report as being smokers (20.5%compared with 16.6% women).Figure 245%<strong>Dudley</strong> <strong>Health</strong> Survey 2009: Proportion of respondents who currentlysmoke, by ageband and sex40%35%30%25%20%<strong>15</strong>%10%5%0%18-24 25-34 35-44 45-54 55-64 65-74 75+Age in yearsMaleFemaleSource: <strong>Dudley</strong> <strong>Health</strong> Survey 200995
Smoking Prevalence TargetsA new Tobacco Control <strong>Strategy</strong> <strong>for</strong> England – A Smokefree Future was released inFebruary <strong>2010</strong> (Great Britain. Department of <strong>Health</strong>, <strong>2010</strong>a), by the then government,which outlined challenging aspirations to further reduce smoking rates.The Smoke Free Futures vision contained three overarching objectives:1. To stop the inflow of young people recruited as smokers.Aspiring to reduce the 11–<strong>15</strong>-year-old smoking rate to 1% or less,and the rate among 16 and 17-year-olds to 8% by 2020.2. To motivate and assist every smoker to quit.Aspiring to reduce adult smoking rates to 10% or less, and halvesmoking rates <strong>for</strong> routine and manual workers, among pregnantwomen and within the most disadvantaged areas by 2020.3. To protect our families and communities from tobacco-related harm.Aspiring to increase to two-thirds the proportion of homes whereparents smoke but that are entirely smokefree indoors by 2020.It is unclear at this stage whether the new coalition government will continue withthese aspirations and we await confirmation in the Public <strong>Health</strong> White Paper due tobe released in December <strong>2010</strong>.Tobacco Control in <strong>Dudley</strong>A considerable amount of action on tobacco control has been underway in <strong>Dudley</strong><strong>for</strong> many years. A Tobacco Control <strong>Strategy</strong> <strong>for</strong> <strong>Dudley</strong> was developed in 2007 –Creating a „Smokefree Generation‟ - which outlines a local partnership approach andkey priorities to provide children and young people in <strong>Dudley</strong> a fair chance to growup in a smokefree environment where smoking is not seen as the norm.The strategy was developed by the Tobacco Action Group (TAG) in line with theDepartment of <strong>Health</strong>‟s six strand approach. It set out a clear three year action planand monitoring framework from 2007-10. The group reports regularly to the <strong>Dudley</strong><strong>Health</strong> and Wellbeing Partnership. The strategy will be reviewed and updated inview of the new national Tobacco <strong>Strategy</strong> and Public <strong>Health</strong> White Paper due out inDecember <strong>2010</strong>.<strong>Dudley</strong> also takes the lead in co-ordinating the Black Country Tobacco ControlAlliance (BCTCA), which facilitates a more strategic approach to tobacco controlactivities across the four Black Country boroughs through partnership working,sharing of resources and good practice and joint project and campaign work. TheBCTCA is focussing joint action on tackling illicit tobacco.<strong>Dudley</strong> PCT identified the Tobacco Control programme as one of its key World ClassCommissioning (WCC) priorities in <strong>2010</strong> supported by additional recurrentinvestment within the PCTs strategic plan to bring the target of 4 week quitters to3554/year and rate /1000 population to 14.22 by 20<strong>15</strong> and to achieve a reduction inthe demand <strong>for</strong> healthcare further upstream. This programme of work will bedelivered through a comprehensive tobacco control approach.96
1. Stop Smoking Service Provision<strong>Dudley</strong> Stop Smoking Service (DSSS) delivers an NHS quality, evidence based stopsmoking service, targeting smokers from deprived communities and hard to reachgroups. DSSS commissions stop smoking services and acts as a provider as a lastresort <strong>for</strong> a small number of service areas where no other provider is available. Theservice network comprises:One-to-one support in GP practices and community pharmacies. Currently88% of GPs and 77% of pharmacies in <strong>Dudley</strong> provide this service.One-to-one and group support in workplace settingsOne-to-one support <strong>for</strong> <strong>Dudley</strong> Group of Hospital „in and out‟ patients.Group support on a rolling programme basis in community venues across theborough. Groups are co-delivered by trained volunteers.Drop-in clinics and groups in schools and clinics provided by trained StopSmoking Specialists (School <strong>Health</strong> Advisors, Children‟s Centre staff)Intensive one-to-one support <strong>for</strong> pregnant women and their family in the homesetting.<strong>Health</strong> Equity AuditDSSS carries out a health equity audit (HEA) every 2 years to provide a detailedprofile of clients attending the service to establish if service provision anddevelopments are delivering equitable services in proportion to smoking prevalencerates from social class groups across <strong>Dudley</strong>. The most recent HEA was completedin <strong>2010</strong> and identified that the number of people accessing the service has beenincreasing year on year with over 25,000 smokers having accessed the service inthe period April 2002 to March 2009.Figure 3 shows the proportion of clients accessing DSSS by the Index of MultipleDeprivation 2007 (IMD, 2007) by national quintile. There is a significant negativetrend in the proportion accessing DSSS from the most deprived to the least deprivedpeople in <strong>Dudley</strong>. The proportion accessing DSSS in the 20% most deprived areasof <strong>Dudley</strong> is four times that of people in the 20% least deprived areas. Thishighlights that the service is responding to the increased need identified earlier bythe high smoking prevalence in this group. There has been a significant increase inthe proportion of people accessing DSSS from the 20% most deprived areas in thelast seven years and a corresponding decline <strong>for</strong> clients from the 20% least deprivedareas.97
Proportion of clients accessing DSSS (%)Figure 3:Proportion of clients using DSSS, by IMD 2007 National Quintile, 2002/03 to 2008/0950%45%40%35%30%25%20%<strong>15</strong>%10%5%0%(most deprived) 1 2 3 4 (least deprived) 5 out of areaIMD 2007 Quintile2002 2003 2004 2005 2006 2007 2008Source: <strong>Dudley</strong> Stop Smoking ServiceDepartment of Communities & Local Government Indices of Deprivation 2007Figure 4 shows the proportion of clients accessing the DSSS who have a successful4-week quit status by IMD 2007. Clients accessing the service from the 20% mostdeprived areas are significantly less likely to quit at 4 weeks than those clientsaccessing the service from the 20% least deprived areas. Over the last 7 years thegap between these two groups is closing in terms of quit rate with the clients fromthe 20% least deprived areas reducing their 4-week quit success at a greater ratethan the 20% most deprived areas which have not significantly declined with time.However, 2008-9 has seen a quit rise in the least deprived quintile.98
Proportion of clients that have quit at 4 weeks (%)Figure 4:Proportion of clients using DSSS that have quit at 4 weeks, by IMD 2007 National Quintile, 2002/03 to 2008/09100%90%80%70%60%50%40%30%20%10%0%1(most deprived) 2 3 4 5 (least deprived) out of areaIMD 2007 Quintile2002 2003 2004 2005 2006 2007 2008DSSS have updated their Pharmacotherapy Guidelines in 2009 to includecombination therapy and Varenicline as a first line treatment. This will provide themost evidenced based treatments <strong>for</strong> heavily dependent smokers who are generallyin the most deprived areas. It is anticipated that this will contribute to improving quitoutcomes <strong>for</strong> the most needy smokers.Smoking and Pregnancy ServicesDSSS has provided a specialist service to help pregnant smokers and their familiesstop smoking since 2000. The service aims to reduce the percentage of pregnantsmokers in <strong>Dudley</strong> and consequently have a positive impact on perinatal and infantmorbidity and mortality. There has been a steady increase in women accessing theservice since 2002. <strong>Dudley</strong> Stop Smoking and Pregnancy (DSS&P) service hasbeen used nationally as an example of good practice through Infant Mortality andTobacco Control National Support Team visits and provides leadership <strong>for</strong> the WestMidlands Regional Smoking and Pregnancy network.A recent national audit of smoking and pregnancy services was commissioned bythe West Midlands Government Office to determine the per<strong>for</strong>mance andeffectiveness of the West Midlands Smoking and Pregnancy Services, compared toother England PCT services. The analysis has placed <strong>Dudley</strong> in the top 10% (12 th of147) of smoking and pregnancy services nationally <strong>for</strong> women quitting on a „quitneed‟ basis, and top per<strong>for</strong>ming <strong>for</strong> the West Midlands Region (Figure 5). Thisin<strong>for</strong>mation reassures us that <strong>Dudley</strong> is providing a good service <strong>for</strong> those who aremost at need.99
Figure 5:Smoking and Pregnancy Services in West Midlands quit need ratio compared with services across England2. <strong>Tackling</strong> illicit tobaccoThe geographical positioning of <strong>Dudley</strong>, close to the M6 and M5 corridor,un<strong>for</strong>tunately provides organised criminal operators an ideal location <strong>for</strong> processingcut-price illicit tobacco. It remains widely available, particularly within the poorestcommunities. Through the BCTCA, <strong>Dudley</strong> Trading Standards Service and DSSSwork in partnership with HM Revenue and Customs on joint activities to reduce theillegal selling of smuggled and illicit tobacco products. This has involved the sharingof intelligence, promotion of a national complaints hotline and a workplacein<strong>for</strong>mation campaign highlighting fines <strong>for</strong> selling in workplaces.This programme of work was reviewed at a recent local Illicit Tobacco Summit whichhas identified the key areas <strong>for</strong> future action which include better intelligence sharingtemplates and protocols, local education and awareness campaigns and bettermonitoring processes.<strong>Dudley</strong> PCT has commissioned a programme of education and en<strong>for</strong>cement withregards to the sale of tobacco and alcohol products from <strong>Dudley</strong> Trading StandardsService. This joint programme of work will significantly contribute to the Council Planobjective of reducing harm to children by limiting access to alcohol and alsoeffectively assist in the implementation of the Tobacco <strong>Strategy</strong> <strong>for</strong> <strong>Dudley</strong> andSocial Responsibility Scheme through targeted inspection and en<strong>for</strong>cement ofunderage sales legislation. It will also contribute to the incidence of sales currently at6% (2009/<strong>2010</strong>) to be reduced and to provide effective education and training totraders. This area of work will be monitored through the Tobacco Action Group.100
3. Communication and EducationDSSS work in partnership with many local organisations to provide public andworkplace education and media campaigns. These are planned to link to nationalcampaigns such as No Smoking Day and Smokefree England to maximise localimpact. All local stop smoking service education materials are branded in line withSmokefree England, again to maximise the impact of national advertising and mediacampaigns. DSSS have won several national awards in the last three years <strong>for</strong> its NoSmoking Day education and media campaigns. This year there is no nationaladvertising due to Government cuts so there will be a need to maintain a highpresence locally.DSSS commissions Environmental <strong>Health</strong> Services to carry out workplacesmokefree inspections, educate employers on selling illicit tobacco and promote stopsmoking service provision in the workplace. It is anticipated that this partnershipapproach will increase the number of routine and manual smokers accessing stopsmoking services.Smoke free HomesExposure to secondhand smoke (SHS) is harmful to health, particularly <strong>for</strong> children.The home is where children are exposed to SHS the most with the main source ofexposure being from their parents and in particular maternal smoking. Exposing newborn babies and children to SHS is a major risk factor <strong>for</strong> bronchitis, pneumonia,coughing and wheezing, asthma attacks, middle ear infection, cot death and possiblycardiovascular and neurobiological impairment.DSSS has been working with a wide range of organisations on promoting SmokefreeHomes focussing interventions initially in pregnancy and pre-school years wherechildren may not have a voice. This area of work is being reviewed through socialmarketing activities both with health professionals and parents. It is planned toexpand and develop this area of work to include early years and primary schoolsaiming to educate parents and children to champion the smokefree message in theirown homes. Work is already underway on recording exposure to SHS in the homesthrough a more structured approach to data collection from Personal Child <strong>Health</strong>Records (PCHR) and also through the <strong>Dudley</strong> Schools <strong>Health</strong> Related BehaviourQuestionnaire.Schools and Youth EducationThis workstream has been integral to <strong>Dudley</strong>‟s tobacco programme working inpartnership with <strong>Dudley</strong> <strong>Health</strong> Promoting Schools Service. It aims to deliver adevelopmental tobacco education programme in primary and secondary schools.This year has seen young people involved in the redevelopment of this programmewith more of a youth advocacy approach. This has given us more insight to whatyoung people want and need. A smoking toolkit has been developed and is due tobe launched in March 2011. We are also looking at new ways to provide tobaccoeducation through a match funded arts and health project that will see 10 newprojects being delivered by youth groups across <strong>Dudley</strong>. These will be robustlyevaluated and reported on through <strong>Dudley</strong>‟s Youth Council and the TAG.101
ConclusionsThe <strong>Dudley</strong> tobacco control programme has been shown to be effective incontributing to reducing overall smoking prevalence through delivering an evidencedbased multi strand approach. However it could go further to reduce smokingprevalence in the most deprived areas and amongst pregnant women.In summary:Smoking prevalence is declining nationally and locally. However there stillremains approximately double the number of smokers in the more deprivedareas than the least deprived nationally and in <strong>Dudley</strong>Smoking in pregnancy prevalence is declining nationally, although the data isthought to be an underestimate. In <strong>Dudley</strong> prevalence has risen in the lastyear and concerns have been raised about the data collection process.DSSS is successfully targeting smokers from deprived areas to accessservices but fewer remain stopped than in the least deprived areas.The <strong>Dudley</strong> smoking and pregnancy service is highly recognised <strong>for</strong> deliveringan excellent service but local prevalence data does not correlate with this.<strong>Dudley</strong> has a range of wider tobacco control programme areas that areessential in providing a comprehensive approach to raising the issue oftobacco in a variety of settings and to drive smokers to stop smoking services.<strong>Dudley</strong> plays a key role in the Black Country Tobacco Control Alliance(BCTCA). Joint project work is focussing on dealing with illicit tobacco.Scoping work has been carried out with workplaces and retailer visits werecarried out across all four boroughs.<strong>Dudley</strong>‟s Smokefree Homes programme is developing to include early yearsand primary school workstreams.The schools and youth tobacco education programme will focus on using arts<strong>for</strong> health as a medium to get key messages across to young people. Youngpeople are at the centre of how this work will develop.RecommendationsThe NST identified a number of priority areas <strong>for</strong> action an action plan has beendeveloped to be included ensure that they will <strong>for</strong>m part of the tobacco controlprogramme. The recommendations have been outlined in conjunction with currentlocal action and priorities:Strategic approach to Tobacco Control is best co-ordinated by an effective multiagencypartnership:- Continued strong senior level support and leadership <strong>for</strong> the tobacco controlagenda- Review role of Tobacco Action Group (TAG)- TAG continued accountability to <strong>Dudley</strong> Community Partnership via the<strong>Health</strong> and Wellbeing Partnership Board- Refresh the Tobacco <strong>Strategy</strong> and action plan in line with the new National<strong>Strategy</strong>- Development of advocacy role of the Alliance around SHS and illicit tobaccoFurther develop an evidenced based and proactive approach to illicit tobacco- Plan local priorities102
The PCT, Acute Trust, Local Authority and other partners should explore ways inwhich data can be collected and shared to improve local intelligence on key arease.g. smoking in pregnancy, illicit tobacco, under age sales.Intention to commission Environmental <strong>Health</strong> to carry out additional smokefreecompliance checks in routine and manual workplaces to include illicit tobacco andstop smoking in<strong>for</strong>mation.There would be a benefit in developing a programme of ongoing test purchasing toexplore the issue of supply of tobacco to young people.The early adoption of DH Stop Smoking in Secondary Care toolkit provides anopportunity to ensure effective care pathways are in place <strong>for</strong> smokers – this willimpact on the key contributors to tackling health inequalities.- This would also provide an opportunity to ensure a <strong>for</strong>mally agreed carepathway <strong>for</strong> smoking in pregnancy to be used by all staff.The DH Stop Smoking Interventions in Primary Care toolkit is rolled out to ensurestrengthened infrastructure <strong>for</strong> quality brief interventions.All tobacco control initiatives will require senior level support and agreementbetween Primary and Secondary Care organisations to ensure a seamless qualityservice <strong>for</strong> clients.It will be beneficial to have Varenicline as a first line smoking cessation medication.103
7.4 ALCOHOL HARM REDUCTIONThere are numerous measures that highlight the relationship between alcoholconsumption and health inequalities in <strong>Dudley</strong>. Some of these differences relate togeographic areas, whilst others relate to differences in population groups. There arecorrelations between local measures of social deprivation and measures of alcoholrelatedburden across the area <strong>for</strong>:- The contribution of alcohol to life expectancy- Mortality from causes directly related to alcohol- Hospital episodes attributable to alcohol- The rate of crimes estimated to be attributable to alcoholThese relationships suggest that the more deprived areas of the borough have adisproportionately high burden on the NHS, have a disproportionately high level ofalcohol related mortality and have a disproportionate contribution to reduced lifeexpectancy due to alcohol.The contribution of alcohol to life expectancyThe enjoyment of alcohol has been part of our culture <strong>for</strong> thousands of years. It ispart of the way we enjoy our leisure time and celebrations with friends and family.There is some evidence that small quantities of alcohol may have a beneficial effectand prevent against cardiovascular disease, however drinking alcohol above saferecommended levels can cause a variety of health harms. High levels of alcoholconsumption are associated with obesity, cancer, cardiovascular disease andhaemorrhagic stroke.The harm that alcohol does is across all ages, gender and race but there areinequalities in the way that this impacts on life expectancy across the borough. Theward level data shows some variation in different parts of the borough, but thesignificant differences can be seen between mortality in Netherton and Woodside, StJames, St Andrews and Brockmoor and Pensnett compared with Kingswin<strong>for</strong>d Southand Halesowen South (Figure 1). The gender inequalities are also evident whenward level data <strong>for</strong> males and females is compared. (Figure 2)Mortality rates from alcohol related causes are lower <strong>for</strong> women anyway, but even inwards where male mortality is high, women generally are less likely to die from analcohol related disease than their male counterparts. Estimates show that a manliving in Netherton and Woodside is more than 5 times likely to die earlier from analcohol related cause than in the more affluent wards of Halesowen or Kingswin<strong>for</strong>d.104
Standardised Rate per 100,000 PopulationStandardised Rate per 100,000 PopulationFigure 170Directly Standardised Mortality Rates from Alcohol-Related Diseases by Ward5-Year Rates, <strong>Dudley</strong> MBC, Both Sexes, All Ages, 2004-200860504030<strong>2010</strong>0Figure 2120Directly Standardised Mortality Rates from Alcohol-Related Diseases by Ward5-Year Rates, <strong>Dudley</strong> MBC, Males & Females, All Ages, 2004-2008100806040200105
Standardised Rate per 100,000 Population1983-19851984-19861985-19871986-19881987-19891988-19901989-19911990-19921991-19931992-19941993-19951994-19961995-19971996-19981997-19991998-20001999-20012000-20022001-20032002-20042003-20052004-20062005-20072006-2008Mortality from causes directly related to alcoholMortality from alcohol can be accounted <strong>for</strong> by a number of different causes. Thealcohol specific diseases of alcoholic liver disease (cirrhosis), ethanol poisoning,chronic pancreatitis and alcoholic gastritis are the main contributors to chronic illhealth and premature mortality. The highest numbers of admissions to hospital aredue to mental and behavioural disorders associated with high levels of alcoholconsumption and in some cases combined with illegal substance misuse. Mortalitydue to suicides is also more common in this group.Between 1983 and 1993 <strong>Dudley</strong>‟s alcohol premature mortality rate was below theEngland average <strong>for</strong> both males and females. Since 1993 the premature mortalityrate <strong>for</strong> males has steadily increased. The mortality <strong>for</strong> males has been consistentlyhigher than females apart from 1990 to 1993 when female mortality exceeded that ofmales. From 2002 to 2007 the premature mortality rate was significantly higher thanthe England average, but <strong>for</strong> the last two years this rapid rate of increase seems tobe slowing, but the inequality gap between males and females has widened.Figure 3Directly Standardised Mortality Rates from Alcohol-Related Diseases by Year3-Year Rates, <strong>Dudley</strong>, Males & Females Aged Under 75, 1983-1985 to 2006-2008302520<strong>15</strong>1050Alcohol related hospital admissionsThe rate of alcohol related admissions to hospital is used as a proxy indicator <strong>for</strong> theamount of alcohol related harm there is in the community. The indicator is made upof alcohol specific causes and around twenty conditions where alcohol is an„attributable fraction‟ of those admissions. In 2002/03 <strong>Dudley</strong> was below the Englandand West Midlands average, but by 2005/06 the rate of admissions began to climbsteeply, placing <strong>Dudley</strong> as the 11 th highest in the region <strong>for</strong> alcohol related106
admissions. The following year <strong>Dudley</strong> was 5 th highest, but the rate of increase nowseems to be slowing down. This correlates with the reduction in alcohol relatedmortality over the last two years seen in previous graphs.Figure 4:Alcohol-related harm hospital admissions in the West Midlands by Local Authority 2007/08Source: LAPE, NWPHO107
Rate of Alcohol-related hospital admissions per 100,000 populationIn 2008/09 there were 4919 alcohol related harm hospital admissions to <strong>Dudley</strong>hospital, of which 4543 were resident in <strong>Dudley</strong> and the remainder were nonresidents.An analysis of the <strong>Dudley</strong> residents by age and sex is given in Figure 6.Of the alcohol related harm hospital admissions <strong>for</strong> <strong>Dudley</strong> residents 2831 weremale and 1712 were female (62 and 38% respectively), and the proportion of alladmissions increased with increasing age <strong>for</strong> both men and women. The gapbetween men and women in terms of admissions was lowest in the under 35 agegroup.Figure 5Rate of alcohol-related admissions per 100,000 population (EASR), <strong>Dudley</strong>, West Midlands region andEngland20001800<strong>Dudley</strong>West MidlandsEngland160014001200100080060040020002002/03 2003/04 2004/05 2005/06 2006/07 2007/08Financial YearSource: UNIFYThe rate at which hospital admissions has increased in <strong>Dudley</strong> was the main reason<strong>for</strong> it being chosen as a partnership target to try and reduce the numbers of peoplebeing admitted to hospital and ultimately impact on reducing premature mortalityfrom alcohol consumption.By far the biggest burden of alcohol morbidity in <strong>Dudley</strong> is in white males in the 35 to54 year old age group. This is the group that has been identified <strong>for</strong> targetedinterventions to reduce their alcohol consumption, which in turn would reduce thenumber of hospital admissions and also impact on premature mortality. Only 6% ofthe total admissions were from ethnic minority groups, reflecting the percentage ofthese groups in the total population, but does not take account of the fact that someethnic groups are more vulnerable to the effects of alcohol so this figure may bemasking an inequality in access to services108
Standardised Rate per 100,00 populationPercentage of alcohol related harm hospital admissionsFigure 6:Percentage of Alcohol related harm hospital admissions by age and sex <strong>for</strong> <strong>Dudley</strong> residents 2008/0918%16%14%12%10%8%MalesFemales6%4%2%0%<strong>15</strong>-24 25-34 35-44 45-54 55-64 65-74 75+Age band (Years)Source: Secondary User Service (SUS) Hospital AdmissionsAdmissions to hospital increase steadily across the age ranges up to the age of 65-74. The 75+ shows a decline, indicating that a number of people will have died bythis age from alcohol related causes, or other diseases.Figure 7:Directly standardised alcohol related harm hospital admissions <strong>for</strong> <strong>Dudley</strong> 2008/09 by index of multipledeprivation (2007) national quintiles.3500300025002000<strong>15</strong>00100050001- Most deprived 2 3 4 5 - Least deprivedMales Females <strong>Dudley</strong> Males <strong>Dudley</strong> FemalesIMD 2007 QuintilesSource: Secondary User Service (SUS) Hospital Admissions.Department of Communities and Local Government Indices of Deprivation 2007109
The directly age sex standardised alcohol related harm hospital admission rate (per100,000 people) <strong>for</strong> <strong>Dudley</strong> residents in 2008/09 was 1281.5, and was significantlyhigher <strong>for</strong> men than women (1636.8, 948.7 <strong>for</strong> men and women respectively).Figure 7 shows the directly age sex standardised alcohol related harm hospitaladmission rate (per 100,000 people) <strong>for</strong> <strong>Dudley</strong> residents in 2008/09 by IMD 2007quintiles. In terms of alcohol related harm hospital admissions there is a strongpositive relationship with increasing deprivation <strong>for</strong> both men and women. Thisrelationship was not observed <strong>for</strong> the prevalence of heavy and binge drinking.110
Netherton &WoodsideHalesowen NorthCastle & PrioryLye & WollescoteSt JamesSt AndrewsBrierley HillBrockmoor &PensnettGornal WoodQuarry Bank &CradleySt ThomasAmblecoteCoseley WestSedgleyHayley GreenWollaston &Stourbridge WestWordsleyBelle Vale & HasburyCoseley EastPedmore &Stourbridge EastKingswin<strong>for</strong>d SouthKingswin<strong>for</strong>d North &Wall HeathNortonHalesowen SouthStandardised Rate per 100,00 populationFigure 8: Directly standardised alcohol related harm hospital admissions <strong>for</strong> <strong>Dudley</strong> 2008/09 by Ward (Census2001).3500300025002000<strong>15</strong>0010005000Males Females <strong>Dudley</strong> Males <strong>Dudley</strong> FemalesWard (Census 2001)Source: Secondary User Service (SUS) Hospital Admissions.111
Standardised rate per 100,000 populationFigure 8 shows the directly age sex standardised alcohol related harm hospitaladmission rate (per 100,000 people) <strong>for</strong> <strong>Dudley</strong> residents in 2008/09 by wardaccording to the 2001 national Census. For men there were five wards where theadmission rate was significantly higher than the <strong>Dudley</strong> average <strong>for</strong> men. Nethertonand Woodside had the highest rate of admission and was nearly 45% higher thanthe <strong>Dudley</strong> average <strong>for</strong> males. The other wards were Halesowen North, Castle &Priory, Lye & Wollescote and St. James. For women there were four wards wherethe admission rate was significantly higher than the <strong>Dudley</strong> average <strong>for</strong> women.Brierley Hill had the highest rate of admission and was nearly 55% higher than the<strong>Dudley</strong> average <strong>for</strong> females. The other wards were St. James, Brockmoor &Pensnett and St. ThomasFigure 9:Directly standardised alcohol related harm hospital admissions <strong>for</strong> <strong>Dudley</strong> residents in 2008/09by sex and Mosaic group.3500300025002000<strong>15</strong>0010005000Symbols ofSuccessHappyFamiliesSuburbanCom<strong>for</strong>tTies ofCommunityUrbanIntelligenceWelfareBorderlineMunicipal Blue CollarDependency EnterpriseTwilight GreySubsistence PerspectivesRuralIsolationMales Females <strong>Dudley</strong> Males <strong>Dudley</strong> FemalesMosaic GroupSource: Secondary User Service (SUS) Hospital Admissions.Experian Public SectorFigure 9 shows the directly age sex standardised alcohol related harm hospitaladmission rate (per 100,000 people) <strong>for</strong> <strong>Dudley</strong> residents in 2008/09 by Mosaicgroup. Mosaic identifies populations according to socio-economic factors and gives apicture of the local population in terms of employment, life-stage and relativeaffluence.The Mosaic groups with significantly higher admission rates <strong>for</strong> men were Twilightsubsistence (older people living on pensions with little additional income), Welfareborderline (people in low paid jobs supported by some benefits) and Municipaldependency (the most deprived groups with no employment living on benefits). For112
women the Mosaic groups with significantly higher admission rates were the samegroups as <strong>for</strong> the men with the addition of Urban Intelligence which showed thehighest level of hospital admissions <strong>for</strong> women showing twice the level of the <strong>Dudley</strong>average <strong>for</strong> women. The Urban Intelligence group are largely younger people inhigher paid jobs. This suggests that prevention programmes should be aimed at bothsexes in the Mosaic groups Welfare borderline, Twilight subsistence and Municipaldependency and then additional programmes should be targeted at women in theUrban intelligence Mosaic group.Alcohol Related CrimesAlcohol related crime has been steadily falling in <strong>Dudley</strong> over the last five years.There is a perception amongst the public that alcohol related crime is still a problem,probably because public drunkenness is very visible in some parts of the borough.Figure 10Crude rate per 1,000 population, All agesSource: LAPE, NWPHO113
Figure 11Source: LAPE, NWPHOThere has also been a decline in alcohol related violent crime over the last four yearsand although there was an increase in 2005/06, the overall trend is downwardsFigure 12Crude rate per 1,000 population, All agesCrude rate per 1,000 population, All agesSource: LAPE, NWPHOThere are well established links between alcohol and risky sexual behaviour andalcohol plays a part in the numbers of unplanned teenage conceptions, but the114
numbers of alcohol related sexual offences remains low and the overall trend isdownwards even though there was a small increase in recorded offences in 2008/09.Local Patterns of alcohol consumptionThere are a number of accepted categories of alcohol consumption and the NorthWest Public <strong>Health</strong> Observatory has produced synthetic estimates of the number ofhazardous, harmful and binge drinkers <strong>for</strong> every local authority in England. Theestimates probably understate the extent of problematic drinking because they relyon self reporting through surveys e.g. the <strong>Health</strong> Survey <strong>for</strong> England and <strong>Dudley</strong>‟sAdult Lifestyle SurveyDefinitions of drinking levels- Sensible drinking: no more than 3-4 units a day <strong>for</strong> men, and no more than 2-3units a day <strong>for</strong> women.- Binge drinking: 8 or more units of alcohol <strong>for</strong> men, and 6 or more units ofalcohol <strong>for</strong> women on their heaviest drinking day in the past week.- Hazardous drinking: drinking above recognised „sensible‟ levels but not yetexperiencing harm. Defined as drinking between 22 and 50 units of alcohol perweek <strong>for</strong> males, and between <strong>15</strong> and 35 units of alcohol per week <strong>for</strong> females.- Harmful drinking: drinking above „sensible‟ levels and experiencing harm. Canbe defined as drinking more than 50 units of alcohol per week <strong>for</strong> males, andmore than 35 units of alcohol per week <strong>for</strong> females.- Alcohol dependence: drinking above „sensible‟ levels and experiencing harmand symptoms of dependence.Table 1:NWPHO synthetic estimates of hazardous, harmful and binge drinking in adults (aged 16+,HSE 2005)Binge drinking Hazardous drinking Harmful drinking% number % number % number17.7 (<strong>15</strong>.7,18.4 (16.9,5.2 (4.7,43,46545,25312,84020.0)19.9)5.8)<strong>Dudley</strong>PCTWest17.3 (16.3,Midlands19.6)RegionEngland 18.0 (17.4,18.6)763,43016.5 (16.8,19.8)7,278,674 20.1 (18.4,21.8)770,333 5.2 (4.4,5.4)8,027,474 5.0 (4.5,5.6)206,9622,010,856Key findings from the most recent <strong>Dudley</strong> <strong>Health</strong> Survey 2009 (<strong>Dudley</strong> PCT, 2009b)show:The proportion of respondents who are binge drinkers has fallen significantlysince 2004, from 22% to 17%. The proportion of respondents that are heavydrinkers has also fallen significantly, from 34 to 27%.1<strong>15</strong>
There are significantly more male binge and heavy drinkers than female.In both sexes the proportion of respondents who are binge drinkers falls withincreasing age. The proportion of males who are binge drinkers is higher thanfemales in all age bands, although in 18-24 year olds this difference is notsignificant. The same pattern is seen in heavy drinkers.The proportion of respondents who are binge or heavy drinkers is muchhigher in white respondents than BME in both males and females.There is no gradient between least and worst deprived areas <strong>for</strong> either heavyor binge drinking.The prevalence of both heavy and binge drinking is lowest in those who havenever worked/long term unemployed. The prevalence of binge drinking ishighest in lower supervisory and technical occupations and heavy drinking ishighest in higher managerial and professional occupations.Evidenced based interventions <strong>for</strong> hazardous, harmful and moderatelydependent drinkers<strong>Dudley</strong>‟s Alcohol <strong>Strategy</strong> (<strong>Dudley</strong> Community Safety Partnership, <strong>2010</strong>) key aim is,„To reduce the harm caused by alcohol to individuals, families and the community.‟The national health inequalities team have identified four key actions that will impacton health inequalities and result in both short term and longer term health gainsthrough:1. <strong>Tackling</strong> underage/illegal alcohol consumption and encourage the industry topromote responsible drinking2. Combating crime related disorder3. Raising awareness of, and educating about, safe and sensible drinking4. Facilitate identification of at risk individuals and enabling access to alcoholtreatment services which are consistent with national standardsOptimal outcomes at a population level require a population focus to facilitate localcommunities‟ optimal use of the services as well as providing the most effectiveevidence based interventions. Central to the success of this approach is effectivemulti-agency partnership working as well as effective planning and commissioning ofthe services and activities that are necessary to achieve maximum health gain.RECOMMENDATIONSThe local alcohol strategy has identified actions that address all these points and hasbeen written in line with the key government documents as well as ensuringimplementation of the high impact changes that are known to make the greatestimpact on reducing alcohol related admissions to hospital. The keyrecommendations recommended by HINST are now incorporated into the deliveryplan.116
These include:Securing additional investment to reach the reduction in alcohol relatedadmissions target identified in the local strategic plan. The additionalinvestment allows the introduction of a locally enhanced service (LES) inPrimary Care and to increase the capacity of the Tier Two specialist alcoholtreatment service to deal with increased referrals from Primary Care. Togetherwith the additional A&E alcohol liaison nurse these should begin to impact onCHD, hypertension, stroke, cancer and liver disease, thereby releasingresources to be invested in other health services. The increased investmentwill reduce health inequalities in relation to differences in life expectancy andinfant mortality across <strong>Dudley</strong> and contribute to reducing obesity levels,teenage pregnancy and domestic abuse.Undertaking training needs analysis to allow planning <strong>for</strong> the introduction ofIdentification and Brief Advice (IBA) across the health economy and partnerorganisations. IBA has a strong evidence base and has been shown to beeffective in reducing alcohol consumption in harmful and hazardous drinkers.Frontline staff will be offered training in identification and brief advice (IBA) toenable more people who are drinking at harmful or hazardous levels to beidentified earlier and referred into community services rather than intohospital.Work has already begun on a service review of the Tier Two provision and toput in place improved referral pathways as a start to achieving integratedalcohol service provision. An equality impact assessment of services willidentify access issues and ensure that service provision is equitable <strong>for</strong> allgroups.Undertaking a review of alcohol workplace policies, initially <strong>for</strong> the LocalAuthority, PCT and the NHS Trust and then offering support to all otheremployers in the Borough. This will help to tackle the sickness absencecaused by alcohol and its impact on productivity. Alcohol awareness traininghas been identified as a priority <strong>for</strong> all staff and contractors who deal with thepublic across all partner organisations, including the voluntary sector.117
7.5 CANCER<strong>Tackling</strong> Cancer <strong>Inequalities</strong>Much needed progress has been made in cancer treatment and care over the lastfew decades leading to improvements in survival rates across the population as awhole. However despite these improvements it is still the case in England that if youare from certain social, ethnic, or age groups you are more likely to develop cancerand less likely to survive it.The aim of the Cancer Re<strong>for</strong>m <strong>Strategy</strong> (Great Britain. Department of <strong>Health</strong>, 2007b)is to reduce inequalities in cancer incidence, increase access to high quality cancertreatment and care and improve cancer outcomes <strong>for</strong> all.The Department of <strong>Health</strong>‟s Public Service Agreement (PSA) <strong>for</strong> cancer mortality(ages under 75) included a commitment to reduce the absolute gap in mortality ratesbetween the England average and the areas with the worst health and deprivation(Spearhead PCTs) by at least 6% by <strong>2010</strong>, compared to a baseline from 1995-97, aswell as to deliver an overall reduction in mortality of at least 20%.Progress on the PSA has been encouraging. Three-year average mortality rates <strong>for</strong>cancer (ages under 75) in England have fallen <strong>for</strong> each period since 1995-97 (thebaseline) and are now 18.2% below this rate. If this trend continues, the target will bemet. Progress on reducing the gap between England and the Spearhead Group ofPCTs has also been significant. The gap has reduced by 10.5% since the baseline,compared to the targeted reduction of at least 6% by 2009-11.118
Standardised Rate per 100,000 Population1983-19851984-19861985-19871986-19881987-19891988-19901989-19911990-19921991-19931992-19941993-19951994-19961995-19971996-19981997-19991998-20001999-20012000-20022001-20032002-20042003-20052004-20062005-20072006-2008Where are we in <strong>Dudley</strong>?Cancer remains the second largest cause of premature death in <strong>Dudley</strong> accounting<strong>for</strong> around 800 deaths in the under 75s each year.Figure 1Directly Standardised Mortality Rates from All Cancers by Year3-Year Rates, <strong>Dudley</strong>, Males & Females Aged Under 75, 1983-1985 to 2006-2008250200<strong>15</strong>0100500<strong>Dudley</strong> has similarly shown a significant fall in cancer mortality but the inequalitiesgap remains stubbornly wide with rates in some wards being 50% higher than thosein other wards.119
Standardised Rate per 100,000 PopulationStandardised Rate per 100,000 PopulationFigure 2350Directly Standardised Mortality Rates from All Cancers by Ward5-Year Rates, <strong>Dudley</strong> MBC, Both Sexes, All Ages, 2004-2008300250200<strong>15</strong>0100500The inequality gap is greater <strong>for</strong> men than women.Figure 3300Directly Standardised Mortality Rates from All Cancers by IMD 2007 National Quintile5-Year Rates, <strong>Dudley</strong> MBC, Males & Females Aged All Ages, 2004-2008250200<strong>15</strong>0100500120
The deprivation gap in invasive cancer mortality in males has fallen significantly overtime in the West Midlands. In the period 2005-2007, 3,777 extra deaths (21%) wereregistered than would be expected when compared to the most affluent population,down from 4,916 (29%) in 1996-1998. This suggests the deprivation gap between allWest Midlands residents and the most affluent population is closing. This trend isalso seen in <strong>Dudley</strong>.Figure 4All invasive cancers, excluding non-melanoma skin cancer (ICD10 C00-C97 excl. C44): Trendsin excess mortality (%) over time (1996-1998, 2001-2003, 2005-2007) West Midlands PCTs, malesSource: West Midlands Cancer Intelligence Unit, Excess Cancer Incidence and Mortality 1997-2007The deprivation gap in invasive cancer mortality in females has also fallensignificantly over time in the West Midlands. In the period 2005-2007, 2,942 moredeaths (18%) were registered than would be expected compared to the most affluentpopulation, down from 3,721 (24%) in 1996-1998. This suggests that the deprivationgap between all West Midlands residents and the most affluent population is closing.This trend is also seen in <strong>Dudley</strong>.121
Figure 5All invasive cancers, excluding non-melanoma skin cancer (ICD10 C00-C97 excl. C44):Trends in excess mortality (%) over time (1996-1998, 2001-2003, 2005-2007)West Midlands PCTs, femalesSource: West Midlands Cancer Intelligence Unit, Excess Cancer Incidence and Mortality 1997-2007Cancer incidenceFor the 2000-04 time period all malignancies group and 11 of 23 site groups showeda statistically significant association between cancer incidence and socio-economicdeprivation. (National Cancer Intelligence Network, 2009). Head and neck, stomach,liver, lung and cervical cancers were particularly strongly associated with socialdeprivation, <strong>for</strong> these groups rates in the most deprived quintile approached twicethat in the most affluent quintile. While those of breast, skin and prostate are found atincreased rates among higher socioeconomic groups. Even among those cancerswhere incidence is higher among wealthier socioeconomic groups death rates arehigher among deprived communities.The picture <strong>for</strong> ethnic minority groups varies according to cancer type and ethnicgroup. In general, incidence is lower amongst ethnic minority groups, although thereare some important exceptions (incidence of prostate cancer is greater amongstBlack African and Black African-Caribbean men, liver cancer in South Asians, andmouth cancer in Bangladeshis)122
Age standardised incidence rate ratios (most deprived/least deprived) <strong>for</strong> selected sites.England 2000-04Figure 6Reduction in annual incidence ifASR of all was reduced to thatof lowest incidence quintile(2000-2004. „000s)Sites with lower incidenceassociated with deprivationSites with higher incidenceassociated with deprivationBased on ratios published in the NCIN report on ‘Cancer Incidence by Deprivation’Cancer admissionsAdmissions data <strong>for</strong> cancer shows that admissions generally reflect the higher riskand needs of specific population groups including BME and deprived groups.123
Standardised Rate per 100,000 PopulationFigure 7400Directly Standardised Admission Rates from Emergency admissions AllCancers by IMD 2007 National Quintile5-Year Rates, <strong>Dudley</strong> MBC, Males & Females Aged All Ages, 2004-2008350300250200<strong>15</strong>0100500Levels of emergency admissions <strong>for</strong> cancer reflect that patients may not be beingdiagnosed or treated at an early stage of their cancer. Thus it may be an indicator oflate presentation, late diagnosis and entry to care not through primary care. Patientsfrom deprived areas, older people and women are more likely to be admitted asemergencies.124
Standardised Rate per 100,000 PopulationFigure 8600Directly Standardised Admission Rates from Emergency admissions AllCancers by Percentage of GP population in the Most Deprived IMD 2007QuintileBoth Sexes, All Ages, 20085003940047Correlationcoefficient0.026300200100320421230 4452671431 42 3510331 16184932389118543 2419 3728 5329<strong>15</strong>1726 2136 412713455123 3446402522DSR<strong>Dudley</strong> averageMid range IMD 1048500% 10% 20% 30% 40% 50% 60% 70% 80%Percentage of GP population in most deprived IMD quintileFigure 8 reveals a weak association between emergency admissions and levels ofdeprivation in general practice suggesting that quality of primary care may have alarge over-riding effect.Between 1986-90 and 96-99 the gap in survival rates between the most and theleast deprived groups in England and Wales increased <strong>for</strong> 19 out of 33 cancer typesand stayed the same or decreased <strong>for</strong> the remaining 14 cancer types. Figures 9 & 10show a similar social gradient in 1 year and 5 year survival <strong>for</strong> all cancers in <strong>Dudley</strong>2007.125
5 Year relative survival percentage1 Year relative survival percentageFigure 9Social Gradient in 1 year Survival <strong>for</strong> all cancers, excluding non melanoma skin cancer (ICD10 C00-C97ex C44)100%90%80%70%60%50%40%30%20%10%0%Quintile 1 - 20% MostdeprivedQuintile 2 Quintile 3 Quintile 4 Quintile 5 - 20% LeastdeprivedIndex multiple deprivation 2007 National deprivation quintileMaleFemaleSource: WMCIUDepartment of Communities & Local Government Indices of Deprivation 2007Figure 10 Social gradient in 5 year survival <strong>for</strong> all cancers, excluding nonmelanoma skin cancer (ICD10 C00-C97 ex C44)80%70%60%50%40%30%20%10%0%Quintile 1 - 20% MostdeprivedQuintile 2 Quintile 3 Quintile 4 Quintile 5 - 20% LeastdeprivedIndex multiple deprivation 2007 National deprivation quintileMaleFemaleSource: WMCIU; Department of Communities & Local Government Indices of Deprivation 2007126
One of the priorities of the Cancer Re<strong>for</strong>m <strong>Strategy</strong> (Great Britain. Department of<strong>Health</strong>, 2007) is to diagnose more cancers early. The most suitable indicator todemonstrate early presentation with signs and symptoms of cancer is the stage ofcancer at diagnosis, but this important in<strong>for</strong>mation is not universally available atpresent.1 year cancer survival rates can be used as a surrogate measure <strong>for</strong> stage of spreadof cancer at presentation, poor survival rates associated with advanced stage atpresentation. Advanced stage presentation can be related to delayed attendance ordelayed diagnosis. 5 year survival is an indicator of outcome including stage atpresentation and the quality of care provided. Factors known to impact upon 5 yearsurvival rates are socio-economic status and uptake and compliance withappropriate high quality treatment.At PCT level the number of cases <strong>for</strong> many cancers can be small leading to sensitiveresults that require careful interpretation. There<strong>for</strong>e it was agreed nationally that onlythe four tumour sites of breast, lung, colorectal and prostate were sufficiently largeenough at PCT level to provide robust analyses.As a comparator the Eurocare4 1 year survival rate has been incorporated into thetables as a consensus target <strong>for</strong> the four main tumour sites. The Eurocare4 project isbased on a collaboration established in 1989 between the Istituto Nazionale Tumori(Milan, Italy), the Istituto Superiore di Sanità (Rome, Italy) and a large number ofpopulation-based cancer registries, from12 European countries, with incidence andsurvival data available. However care should be taken when comparing these dataas the methodologies <strong>for</strong> collecting this in<strong>for</strong>mation does differ across the countriesincluded.127
Figure 11: One year survival by PCT & Network. 2006. Source West MidlandsCancer Intelligence Unit. RAG rating from Cancer Commissioning Toolkit -National Cancer Intelligence Network. (Consensus target – Eurocare 4)Breast cancerLung cancer128
Colorectal cancerProstate cancerThere are also a range of survivorship issues which have an impact on equalityincluding provision of financial advice, access to follow up assistance in returning toemployment and access to psychological support.Research (Davey, Austoker and Macleod, 1999) focused on women with breastcancer found that those living in deprived areas were:• More likely to be diagnosed with advanced cancer• More likely to have a mastectomy, rather than breastconserving surgery• Less likely to receive radiotherapy• Less likely to have surgical treatment• Less likely to have survived five yearsLifestyle factors account <strong>for</strong> most of the variance in cancer incidence between themost and least deprived groups. Higher smoking prevalence among lowersocioeconomic groups is the single most important contributing factor to inequalitiesin cancer incidence and mortality but different exposures to other risky healthbehaviours that contribute to inequalities in cancer rates such as: poor diet, obesity,129
alcohol consumption, sun exposure also contribute. Smoking causes 9 out of 10cases of lung cancer. Examination of local smoking cessation services revealspeople from deprived areas are more likely to be referred but are less likely to stopsmoking. (See Section 7.1)Diet is linked to around a third of all cancer deaths particularly from bowel, stomach,mouth, larynx, oesophagus, breast and prostate cancer. Sun and UV exposure is themost important preventable cause of skin cancer. Incidence is expected to triple overthe next 30 years if people continue to sunbathe and over-use sun-beds. Historicallyskin cancer has been linked to affluent groups however the overall pattern ischanging as increasing numbers of people can af<strong>for</strong>d to holiday abroad or use sunbeds.Disadvantaged groups practice less protective behaviour and are less likely tocheck their skin and there<strong>for</strong>e have poorer survival outcomes.Table 1: Selected cancers, estimated percentages preventable through lifestylechange.Estimated % preventableLung 33%Breast 42%Colo-rectal 43%Total all cancers 26%Source: World Cancer Research Fund and American Institute <strong>for</strong> Cancer Research (2009). Policy and action <strong>for</strong>Cancer Prevention - Food, Nutrition and Physical Activity: A Global Perspective.Modelling of primary prevention uptake based on the future health scenariosdescribed in Securing our Future <strong>Health</strong>: Taking a Long Term View (Wanless, 2002)predicts substantial health gains in terms of cancer incidence, mortality and years ofpotential life lost.Part of the rest of the difference is attributable to lack of awareness, delayeddiagnosis and inequalities in uptake of screening. Levels of public awareness ofcancer signs and symptoms are generally low, but even lower in some groups, suchas deprived communities, some minority ethnic groups and men. This may contributeto lower uptake of screening and later presentation when symptoms arise. Amongdisadvantaged groups there is evidence of misunderstanding and fear about cancer.People from deprived groups are the most likely to present at health services (andbe diagnosed) when their cancer is at a more advanced stage. (Gordon-Dseagu,2009). <strong>Health</strong> literacy is a particular problem <strong>for</strong> some socioeconomically deprivedpatients.<strong>Inequalities</strong> exist <strong>for</strong> other population groups including: black and ethnic minoritygroups, older people – (demographically the biggest risk factor <strong>for</strong> cancer isincreasing age), men and women, vulnerable groups with learning disabilities ormental health problems and individual sexual orientation.For the vast majority of cancers, incidence increases with age. Just over half of allcases of cancer occur in people over 70 years old and a fifth in people over 80years. The improvement in cancer mortality achieved over the last decade has beenmuch less marked <strong>for</strong> the over 75s. Older people with cancer receive less intensive130
and less radical treatment than younger people. It is true that some older people willpresent later, have co-morbidities or are too frail <strong>for</strong> treatment but age should neverbe the sole reason <strong>for</strong> treatment decisions. NCIN estimated that around <strong>15</strong>,000people aged 75 and over die prematurely from cancer in the UK each year.Men are diagnosed with more cancers (excess incidence 16%) and have a highermortality from cancer (38% excess mortality) although this varies by cancer type.This means that there are more women than men living with or beyond a diagnosisof cancer. Cancer accounts <strong>for</strong> 25% of the life expectancy gap <strong>for</strong> men and 16% ofthe gap <strong>for</strong> women. The cancers which would deliver the greatest increase in lifeexpectancy in <strong>Dudley</strong> if mortality rates were equivalent to the UK average are:oesophago-gastric cancers, colorectal cancer, lung cancer and breast cancer.Men have a lower awareness of the signs and symptoms of cancer but although ithas been assumed that men delay seeking help there is no evidence that this is thecase. Some men find GP services to be inaccessible and further work is needed todevelop “male friendly” primary care services.People with mental health problems have higher smoking rates and higher rates ofoverweight and obesity. People with schizophrenia have been found to be twice aslikely to have bowel cancer and sufferers with depression have higher rates of breastcancer. Evidence suggests people with mental health problems are more likely topostpone presentation when they have cancer symptoms, delay the diagnosisprocess and present with more advanced cancer. They also have poorer uptake ofscreening programmes. Mental health professionals may have little training in cancersigns and symptoms while primary care staff may not always have thecommunication skills required to assess the needs of individuals with mental healthproblems.Similarly people with learning difficulties may struggle to express changes to theirhealth potentially complicating and delaying diagnosis and also have lower uptake ofscreening programmes.Variations in cancer incidence between ethnic groups, is likely to be the result of amixture of lifestyle and genetic factors. As well as cultural factors variation may alsobe related to deprivation. Women from minority ethnic groups are more likely topresent with more advanced breast cancers and have poorer survival than whitewomen. Breast cancer occurs at a younger age and as a more aggressive tumourtype among black women of African or Caribbean descent. However breast cancerrates are lower among South Asian women. Smoking rates and tobaccoconsumption are higher among males from some minority ethnic communitiesincluding Bangladeshi, Caribbean and Chinese. Prostate cancer rates are higheramong black African and Caribbean men.Cancer awareness is generally lower in minority ethnic groups as is screeninguptake. These vulnerable groups have unmet needs relating to health in<strong>for</strong>mation,awareness of cancer risk factors, signs and symptoms and cancer services. There isa need <strong>for</strong> access to culturally relevant in<strong>for</strong>mation about cancer and its signs andsymptoms.131
What are the gaps/where are we goingSources of inequality in cancer survival and mortality in <strong>Dudley</strong> include:Awareness and attitude to lifestyle risk factors <strong>for</strong> cancerAwareness of the early signs and symptoms of cancerUptake of prevention, screening and primary care servicesAccess to diagnostic and treatment services from primary careAccess to diagnostic and treatment services in secondary careProvision of in<strong>for</strong>mation and supportAccess to high quality end of life care <strong>for</strong> all people approaching end oflifeCancer awareness measures show that awareness of cancer symptoms is lower inmen, younger people, lower socio-economic groups and ethnic minority groups(University College London, 2009).Screening uptake <strong>for</strong> bowel cancer is lower <strong>for</strong> men and uptake <strong>for</strong> breast andcervical cancer screening is very close to the national targets of 80%.Primary care audit (Eden and Davies, <strong>2010</strong>) reveals late presentation with symptomsto primary care and delays in diagnosis and referral in primary care.<strong>Tackling</strong> inequalities requires a real commitment to reducing inequalities in cancer byfocusing on 1 year survival rates <strong>for</strong> all ages. A 1 year indicator would shift attentionto the vital first year after cancer is suspected, provide impetus to raise awareness ofearly symptoms of cancer, promote early presentation and diagnosis and speed upthe referral system.Key actions to reduce cancer inequalities:Promote healthier lifestylesRaise awareness of cancer signs symptoms and increase the uptake ofscreening programmesReduce cancer waits <strong>for</strong> all patientsEnhance quality and timeliness of in<strong>for</strong>mationProvide financial and psychological supportThe majority of health in<strong>for</strong>mation is text based. Letters, leaflets, and websites aresometimes produced in small print and written in complex language that people canfind difficult to understand. Research suggests that one in six patient in<strong>for</strong>mationleaflets produced by hospices and palliative care units can only be read by 40 percent of the population, and that only 30 per cent of GPs surgeries have accessiblein<strong>for</strong>mation <strong>for</strong> people with learning disabilities. A key factor in the low take up offinancial benefits is a lack of in<strong>for</strong>mation. Research indicates that around threequarters of cancer patients report not being given benefits in<strong>for</strong>mation by anyone. Athird of cancer patients – likely to be those most in need and least able to getin<strong>for</strong>mation themselves – stated that they would have liked such advice.132
As more people than ever are surviving after a diagnosis of cancer and the numberdiagnosed with the illness is rising it is estimated that one in ten people over the ageof 65 are living with a diagnosis of cancer. There is there<strong>for</strong>e much to do to plan andorganise services to help and support cancer survivors.Extended age limits <strong>for</strong> screening – breast cancer to 73 and bowel cancer to 75 togain benefits and achieve uptake rates need to ensure communication andpromotion to target groups.The <strong>Health</strong> <strong>Inequalities</strong> National Support Team found that in <strong>Dudley</strong> there was:• Good primary care participation in national audit of primary care of newlydiagnosed cancer.• Excellent public/user engagement in planning services e.g. head and neck.• A dedicated cancer patient in<strong>for</strong>mation lead in the cancer network.• A strong community focus, including education and awareness raising byclinical nurse specialists.• Nationally recognised work on promoting HPV vaccination by the HPVvaccination co-ordinator.• A commendable level of psychological support <strong>for</strong> cancer sufferers andcharitable cancer drop in centre support <strong>for</strong> patients eg. „Light House‟.• An innovative cancer health improvement coordinator post in the PCT, whoutilises social marketing and community engagement to increase awarenessof cancer and uptake of cancer screening, eg. „Blossoms and Mangos‟- aseries of plays aimed at minority groups to address barriers to screeninguptake.How do we get there?The aim is three-pronged; to reduce the number of people who develop cancerthrough effective prevention messages, to reduce cancer deaths through earlierdiagnosis and optimum treatment and reduce inequalities through effective socialmarketing techniques.Whilst a similar proportion of people in <strong>Dudley</strong> as elsewhere have cancer morepeople die from the condition. The largest cause is the number of people in deprivedareas developing lung cancer (particularly men) and the most effective intervention isto reduce smoking rates in these areas.Promote healthy behaviours, including nutrition and physical activity, to reduceobesity.To improve health outcomes <strong>for</strong> people with cancer there is a need to encourageearlier presentation and detection and increased access to evidence basedtreatments.Analyse the results of the <strong>2010</strong> National Cancer Patient Experience survey which willprovide a comprehensive view of experience by age, gender, deprivation andethnicity.133
Multi Disciplinary Teams should monitor new patients by ethnicity, age, gender,postcode and primary treatment, also stage at presentation. Use of this data throughannual equality audits should enable inequalities to be addressed at the servicelevel. This will help to identify indicators of late presentation that emerge, outcomesfollowing treatment etc. Without staging data, it is not possible to compare like <strong>for</strong>like outcomes locally and between local services and national/internationalcomparators.To tackle the rising incidence of skin cancer the need is to reduce access to sunbeds by under 18yr olds and promote the safe sun message.Organise comprehensive social marketing/community engagement campaignsfocused on 6 key cancers lung, breast, bowel, cervical, prostate and skin; including afocus on inequalities in uptake of screening programmes. Co-ordinate activitybetween the Cancer Network and the PCT to avoid duplication and enablecollaboration and resource sharing with PCT neighbours in awareness raising and intackling barriers to screening.Ensure expansion of the breast screening programme to 47-50 and 70-73 andexpansion of bowel cancer screening programme to 75.Increased focus on cancer survivorship, <strong>for</strong> example, providing better cancer healthin<strong>for</strong>mation in partnership with the voluntary sector such as supporting the MacmillanCitizens Advice Bureau serviceEnsure access to high quality end of life care and extend choice <strong>for</strong> dying cancerpatients.Review primary care urgent 2 week referrals and conversion rates (to cancerdiagnosis) to ensure best use of urgent referral route.Examine variation in primary care referral rates which may indicate populationgroups or geographic areas where there is low public awareness and/or negativebeliefs or lack of good quality primary care services.Systematically employ the Cancer Commissioning Toolkit to ensure implementationof National Improving Outcomes Guidance <strong>for</strong> all cancer sites, in particular <strong>for</strong> uppergastrointestinal cancers and specialist supportive and palliative care to ensure bestoutcomes <strong>for</strong> cancer patients in <strong>Dudley</strong>.Strengthen the role of GPs in early awareness/diagnosis of cancer and improvingscreening uptake.Address capacity issues at the local cancer unit to ensure equality of access to highquality to chemotherapy, <strong>for</strong> example, by considering community treatments.Develop sustainable mechanisms to routinely and systematically capture and usecancer data including:• Staging data• 1- and 5- year survival data with benchmarking <strong>for</strong> PCT, provider trust134
• Benchmarking of surgery aspiring to be curative e.g. lung, stomach,colorectal• Data to help identify late presentation by locality/ethnicity/ tumour type135
7.6 CHRONIC OBSTRUCTIVE PULMONARY DISEASEBACKGROUNDIt is estimated that there are more than three million people in England living withchronic obstructive pulmonary disease (COPD), although only 835,000 have beendiagnosed. It causes more than 25,000 deaths a year. It is the second most commoncause of emergency admissions to hospital and the fifth largest cause ofreadmissions to hospital.The direct cost to the healthcare system is estimated to be between £810 million and£930 million a year. The economic cost is assessed as being even higher, with lostproductivity to employers and the economy estimated at £3.8 billion. COPD causesat least 20.5 million lost working days amongst men and 3.5 million days amongwomen every year. The social cost of COPD is related to quality of life becausesufferers are unable to participate in everyday activities such as gardening orhousework and 66% of sufferers were unable to take a holiday because of limitedmobility or disabling breathlessness.COPD is a term used to describe a group of conditions, mostly chronic bronchitis oremphysema. Asthma is usually included in this heading because of the similarities insymptoms and the burden on the healthcare system, but it is not a principalcontributor to premature mortality. The main symptoms are shortness of breath andreduced exercise ability. There is usually a cough and production of phlegm andpatients often have repeated chest infections. The lung damage is gradual in onsetand eventually irreversible, leading to disability and eventually death.INEQUALITIES AND COPDThere are established links between deprivation and lifestyle factors, but smoking isthe single most important, preventable risk associated with COPD. Giving upsmoking is one of the key things to achieve to reduce risk. Un<strong>for</strong>tunately, where lungdisease is severe it cannot be reversed, so early identification is essential to improvethe prognosis.Maternal smoking during pregnancy is associated with reduced lung function inschool aged children and it also affects foetal development of the respiratory system.There is strong evidence to suggest that exposure in pregnancy may predict thedevelopment of asthma and reduced lung function later in life. Taking up smoking ata young age (be<strong>for</strong>e 16) is also a predictor of increased risk of COPD at a later age.<strong>Inequalities</strong> due to COPD arise from the fact that smoking is more prevalent in lowersocioeconomic groups. 26% of routine and manual workers smoke compared with<strong>15</strong>% of those in managerial and professional occupations. Department of <strong>Health</strong>estimates suggest that routine and manual workers represent approximately 50% ofthe people with COPD in England. Men aged between 20 and 64 who are employedin unskilled manual occupations in England and Wales are around 14 times morelikely to die from COPD than men in professional roles and are around seven timesmore likely than those in managerial and technical operations (Great Britain.Department of <strong>Health</strong>, <strong>2010</strong>).136
Standardised Rate per 100,000 Population1983-19851984-19861985-19871986-19881987-19891988-19901989-19911990-19921991-19931992-19941993-19951994-19961995-19971996-19981997-19991998-20001999-20012000-20022001-20032002-20042003-20052004-20062005-20072006-2008The inequalities gap is even bigger <strong>for</strong> those from the most disadvantaged sectionsof the community where in some cases smoking prevalence can reach 74% (e.g.people with schizophrenia) (Great Britain, Department of <strong>Health</strong>, <strong>2010</strong>)CHRONIC OBSTRUCTIVE PULMONARY DISEASE IN DUDLEYThere has been a general decline in premature mortality from COPD in <strong>Dudley</strong> overthe last twenty-five years, but the rate of decline has now slowed and the gapbetween <strong>Dudley</strong> and England and Wales has widened slightly in the last six years.When differences in gender are analysed it can be seen that premature mortality inmales is significantly higher than the national average, and although female rates arestill below the national average the gap is getting much narrower than it was twentyfiveyears ago. (Figure 1)Figure <strong>15</strong>0Directly Standardised Mortality Rates from COPD by Year3-Year Rates, <strong>Dudley</strong>, Males & Females Aged Under 75, 1983-1985 to 2006-2008454035302520<strong>15</strong>1050When we look at mortality using the deprivation indices it is noticeable thatpremature mortality from COPD is significantly higher in the most deprived quintilecompared with the least deprived. (Figure 2)137
Standardised Rate per 100,000 PopulationStandardised Rate per 100,000 PopulationFigure 290Directly Standardised Mortality Rates from COPD by IMD 2007 National Quintile5-Year Rates, <strong>Dudley</strong> MBC, Both Sexes Aged All Ages, 2004-2008807060504030<strong>2010</strong>0Males in the bottom quintile of deprivation have higher mortality rates than femalesand the gap between the most deprived quintile and the least deprived quintile ismuch bigger <strong>for</strong> males than females (Figure 3)Figure 3Directly Standardised Mortality Rates from COPD by IMD 2007 National Quintile5-Year Rates, <strong>Dudley</strong> MBC, Males & Females Aged All Ages, 2004-200810090807060504030<strong>2010</strong>0138
Standardised Rate per 100,000 Population1983-19851984-19861985-19871986-19881987-19891988-19901989-19911990-19921991-19931992-19941993-19951994-19961995-19971996-19981997-19991998-20001999-20012000-20022001-20032002-20042003-20052004-20062005-20072006-2008If the mortality associated with the two biggest disease contributors to COPD,bronchitis and emphysema, are compared a similar pattern can be seen. The declinein premature mortality is the greatest in males, but this decline has slowed and isnow higher than the national downward trend. (Figure 4)Figure 4Directly Standardised Mortality Rates from Bronchitis & Emphysemia by Year3-Year Rates, <strong>Dudley</strong>, Males & Females Aged Under 75, 1983-1985 to 2006-2008302520<strong>15</strong>1050Admissions to hospital associated with COPDThe three year rates <strong>for</strong> admissions to hospital caused by COPD have reducedslightly <strong>for</strong> males but increased very slightly since 2003 <strong>for</strong> females .(Figure 5).Emergency admissions show the same patterns139
Standardised Rate per 100,000 PopulationStandardised Rate per 100,000 Population2003/04-2005/062004/05-2006/072005/06-2007/082006/07-2008/09Figure 5200Directly Standardised Rates of All admissions COPD by Year3-Year Rates, <strong>Dudley</strong> GP Registered Population, Males & Females All Ages,2003/04-2005/06 to 2006/07-2008/091801601401<strong>2010</strong>0806040200Figure 6.450Directly Standardised Admission Rates from Emergency admissions COPDby Percentage of GP population in the Most Deprived IMD 2007 QuintileBoth Sexes, All Ages, 200840035030052474553224134Correlationcoefficient0.424250200<strong>15</strong>01005031230213135433163210 742 618 2038 14491743212413 26194651828954825273923361129<strong>15</strong>4050DSR<strong>Dudley</strong> averageMid range IMD 1044370% 10% 20% 30% 40% 50% 60% 70% 80%Percentage of GP population in most deprived IMD quintileSource: Secondary Users Service (SUS) Hospital AdmissionsPrimary Care Mortality Data GP Registered PopulationDepartment of Communities & Local Government Indices of Deprivation 2007140
There is a weak correlation between deprivation and emergency admissions <strong>for</strong>COPD, with GP practices with a higher percentage of their population in the mostdeprived quintile showing slightly more tendency to have higher rates of emergencyadmissions <strong>for</strong> COPD. (Figure 6)COPD SERVICES IN DUDLEYCOPD LESA COPD Local Enhanced Service (LES) is in place that provides proactivemanagement of patients with COPD to reduce hospital admissions byreducing and minimising duration of exacerbations.Each practice has developed a „high risk of admission‟ register so that thesepatients can be easily identified.The initiative has seen the introduction of a self management plan <strong>for</strong> everypatient as well as the provision of standby antibiotics/steroids <strong>for</strong> patients.Additionally a web based intranet site has been developed detailing guidelines<strong>for</strong> the treatment and management of COPD patients which is accessible toall health professionals across the borough.Current data is indicating that there are positive outcomes from this serviceand a reduction in admissions to hospital <strong>for</strong> COPD.The COPD LES is closely monitored and the numbers of reviews and patientadmissions to hospitals are brought to the attention of the practices anddiscussed.Other initiativesA lead Respiratory Nurse <strong>for</strong> community nursing linking in with the <strong>Dudley</strong>Respiratory Assessment Service. The role includes support to generic staffincluding primary care practitioners, community case managers and othercommunity staff.COPD personal management plans (part of LES)All the practices to have at least one member of staff to have undertakentraining and have the COPD Diploma.Pulmonary rehabilitation services are available at a range of communityvenuesOxygen therapy assessment service with full patient support provision.Smoking cessation servicesLocal clinical guidelines agreed between primary and secondary careThe National <strong>Strategy</strong> <strong>for</strong> COPD consultation document was issued this year andscrutinized via the Respiratory LIT. In <strong>Dudley</strong> COPD has had a concerted focusdriven by the LES. There are further areas that <strong>Dudley</strong> needs to take <strong>for</strong>ward e.g.end of life care and identifying people with COPD not known to practices.The per<strong>for</strong>mance of COPD services and review of the pathway is reviewed by theRespiratory Local Implementation Team that meets quarterly and includes bothprimary and secondary care clinicians, pharmacists, public health, nurses andcommissioners,141
HINST and COPDAlthough the HINST did not hold a specific workshop on COPD when they visited,they have since produced a series of recommendations on delivering bettermanagement of COPD based on the experiences of the Spearhead PCTs. Theserecommendations have been reviewed and concur with the COPD pathway that isimplemented in <strong>Dudley</strong>.The local priorities <strong>for</strong> development are:-As part of the National COPD <strong>Strategy</strong> and to increase ascertainment numbersin <strong>Dudley</strong> a „Missing Millions‟ (previously undiagnosed COPD) pilot hascommenced: Audit of 800 patients via GP surgeries, community pharmacists,<strong>Dudley</strong> Stop Smoking ServiceImplement the new NICE guidelines <strong>for</strong> COPD Mild, Moderate, Severe and VerySevereThere is an application via SHA <strong>for</strong> End of Life work<strong>for</strong>ce projects <strong>for</strong> an end oflife care lead/nurse <strong>for</strong> COPDThere is a concerted focus to improve under diagnosis and increaseascertainment of asthma in <strong>Dudley</strong> via an education and training programme.There will also be actions to reduce the numbers of recurrent admissions withasthma142
7.7 SEASONAL EXCESS DEATHSREDUCING SEASONAL EXCESS DEATHSExcess winter deaths (EWD) are widely attributed to the effects of cold. They occurmainly in the elderly and more particularly in the over 85 year age group. Themajority of deaths are linked to circulatory and respiratory diseases and there is asmaller, but relevant, number linked to falls. There are also increased numbers ofdeaths linked to seasonal influenza, which can increase greatly in a flu pandemic.Older people living in older or large properties who cannot af<strong>for</strong>d to keep their housewarm are most at risk, and fuel poverty (spending more than 10% of annual incomeon energy bills to keep the house heated to adequate levels) affects the elderly andvulnerable groups the most.Initiatives designed to improve insulation and heating of properties are known toimpact on excess winter deaths. Other high impact initiatives are those designed toreduce falls in the elderly and to promote the uptake of influenza vaccinations. Whilstmost of the effective initiatives focus on reducing deaths from cold, it must be bornein mind that excess summer temperatures, also cause an increase in deaths amongthe very young, the vulnerable and the elderly. This is likely to become more of aproblem if the predicted effects of climate change come about.EXCESS WINTER DEATHS IN DUDLEYExcess winter deaths are defined as:The number of deaths in the four winter months (December to March) minus theaverage number of deaths in the preceding four months (August to November) andthe subsequent four months (April to July).This means the year used <strong>for</strong> calculations runs from August to July, compared withother data which is usually based on a calendar year (January to December) or afinancial year (April to March). The calculation of EWD is expressed as a percentageof the average number of deaths in the preceding four months and this provides theexcess winter deaths index (EWDI).143
Excess Winter Mortality Index (%)Mean Winter temperature (ºC) England & Wales01/8307/8301/8407/8401/8507/8501/8607/8601/8707/8701/8807/8801/8907/8901/9007/9001/9107/9101/9207/9201/9307/9301/9407/9401/9507/9501/9607/9601/9707/9701/9807/9801/9907/9901/0007/0001/0107/0101/0207/0201/0307/0301/0407/0401/0507/0501/0607/0601/0707/0701/0807/08Number of deathsSeasonal mortality patternsFigure 1Trend in all cause mortality in <strong>Dudley</strong> 1983 to 2008600500Monthly DeathsYearly Average4003002001000Month and year of occurrence of deathThe graph (Figure 1) shows the seasonal variation in deaths from all causes from1983 to 2008 with winter spikes in January 1990, 1996, 1997 and 1999. Since 2000the increase in numbers of winter deaths has fallen slightly in line with regional andnational trends.Figure 2<strong>Dudley</strong> Excess Winter Mortality Index, <strong>for</strong> deaths from all causes, All Ages, 1983-200740.07.0035.06.0030.025.05.004.0020.0<strong>15</strong>.010.03.002.005.01.000.00.00<strong>Dudley</strong> EWM (%) 2007/08YearE & W Mean temperature(Dec - Mar)144
Excess Winter Mortality Index (%)Mean Winter temperature (ºC) England & WalesThe excess winter mortality index (Figure 2) does not show a close correlation withlow mean winter temperatures, which suggests factors other than cold have played apart in those winters with higher than normal deaths. Seasonal influenza, <strong>for</strong>instance, may also affect the EWDI.Figure 3Age<strong>Dudley</strong> Excess Winter Mortality Index, <strong>for</strong> deaths from all causes, Age 65+, 1983-200745.07.0040.06.0035.030.025.05.004.0020.0<strong>15</strong>.010.05.03.002.001.000.00.00<strong>Dudley</strong> EWM (%) 2007/08YearE & W Mean temperature(Dec - Mar)Excess winter deaths can affect all age groups but the 65+ group has the biggestsusceptibility. Figure 3 shows that the profile <strong>for</strong> 65+ is similar to that <strong>for</strong> all ages.The increase in mortality <strong>for</strong> the 85+ age group is more pronounced, but thecorrelation between increased mortality and mean winter temperatures is not strong,suggesting that factors other than external temperature also play a part in this olderage group.145
Excess winter deathsExcess winter death indexFigure 4Gender40%35%Excess winter death index by gender and age group, <strong>Dudley</strong> residents, pooled <strong>for</strong>2002/03 to 2006/070-6465-8485+30%25%20%<strong>15</strong>%10%5%0%Males Females PersonsFigure 5350300Excess winter death index by gender and age group, <strong>Dudley</strong> residents, pooled<strong>for</strong> 2002/03 to 2006/070-6465-8485+250200<strong>15</strong>0100500MalesFemales146
Brockmoor & PensnettSt JamesKingswin<strong>for</strong>d SouthWollaston & Stourbridge WestBelle Vale & HasburyCoseley WestNortonSt AndrewsLye & WollescoteQuarry Bank & CradleyAmblecoteCoseley EastPedmore & Stourbridge EastCastle & PrioryHayley GreenSt ThomasSedgleyNetherton & WoodsideWordsleyHalesowen NorthKingswin<strong>for</strong>d North & Wall HeathHalesowen SouthBrierley HillGornal WoodExcess winter death indexWhen gender inequalities are compared, (Figures 4 & 5) it can be seen that moremen than women die be<strong>for</strong>e the age of 64, but <strong>for</strong> both the 65-84 year age group andthe 85+ it is females that have increased mortality. The biggest cause of deaths <strong>for</strong>females aged 65+ is <strong>for</strong> respiratory diseases and these medical conditions areworsened by cold and damp.Local variations across <strong>Dudley</strong>Figure 660%50%Excess winter deaths index by <strong>Dudley</strong> ward (census 2001), pooled <strong>for</strong> 2002/03 to2006/07<strong>Dudley</strong> EWDI95% Confidence interval40%30%20%10%0%-10%<strong>Dudley</strong> Wards (Census 2001)<strong>Inequalities</strong> in excess winter deaths (Figure 6) are also evident across the wards in<strong>Dudley</strong>, although they do not follow the usual patterns <strong>for</strong> other health inequalities.Brockmoor and Pensnett and St James‟ ward have the highest numbers of winterdeaths whereas Gornal Wood, Brierley Hill and Halesowen South have very smallnumbers.If <strong>Dudley</strong> PCT is compared with other PCTs in the West Midlands region there were989 excess winter deaths between 2002/03 and 2006/07, giving <strong>Dudley</strong> the 5 thhighest percentage of the regional total of winter deaths in the region.147
Figure 7Causes contributing to total excess winter deathsProportion of selected diseases contributing to total excess winter deaths in <strong>Dudley</strong>residents over the period 2002/03 to 2006/07Certain infectiousand parasiticdiseases,3.0%Diseases of thedigestive system,3.7%Mental andbehaviouraldisorders ,4.0%Neoplasms,6.1%Other heartdisease,9.3%Others,9.8%Influenza andpneumonia,14.5%Other respiratorydiseases,8.4%COPD,6.9%Cerebrovasculardiseases,13.5%Ischaemic heartdisease,13.9%Other acute lowerrespiratorydiseases,4.8%Other chronic lowerrespiratory diseases,2.0%Almost all the major causes of death can contribute to winter mortality, (Figure 7) butthe most common causes are respiratory and circulatory diseases which account <strong>for</strong>70.3% of all deaths.Influenza and pneumonia account <strong>for</strong> 14.6% of the total; the largest singlecontributor of all the major causes. An increase in the uptake of the influenza vaccinewould make a real difference to premature deaths in this category, particularlyamongst vulnerable groups and the elderly. The Department of <strong>Health</strong> target <strong>for</strong>uptake of flu vaccine is 70% and <strong>Dudley</strong> has reached or exceeded this target from2006 to 2009 in the over 65s (Figure 8). Uptake amongst the under 65s has beenless successful and although there has been a year on year increase since 2006 itonly just reached 50% uptake against a Department of <strong>Health</strong> target of 60% by2009/10 (Figure 9).148
Percentage uptake of seasonal flu vaccinePercentage uptake of seasonal flu vaccineFigure 8Percentage uptake of seasonal flu vaccine <strong>for</strong> patients aged 65 and overAnnual rates, <strong>Dudley</strong>, 2006/7 - 2009/10<strong>Dudley</strong> Uptake England Uptake WHO 75% Target DH 70% Target80.070.060.050.040.030.020.010.00.02006/7 2007/8 2008/9 2009/10YearFigure 9Percentage uptake of seasonal flu vaccine <strong>for</strong> those aged under 65 and at riskAnnual rates, <strong>Dudley</strong>, 2006/7 - 2009/10<strong>Dudley</strong> Uptake England Uptake DH Target70.060.050.040.030.020.010.00.02006/7 2007/8 2008/9 2009/10Year149
Percentage uptake of seasonal flu vaccineWhen percentage uptake by GP practice is plotted against the most deprived quintile<strong>for</strong> the over 65 GP population the correlation is quite weak (r =0.098) (Figure 10).<strong>Dudley</strong>‟s uptake is below the England average. There are many practices with lessthan 30% of their population who are most deprived not achieving 70% uptake.Figure 10Uptake of seasonal flu vaccine in those aged 65 and over by GP against percentage of GPpopulation in most deprived IMD quintile, <strong>Dudley</strong> 2008/9 (R=0.0984, R 2 =0.97%)30384182.3032443777.3072.3067.303231112446422264025514833 34 <strong>15</strong>721 81751645953<strong>2010</strong>14271836242849 13354347291<strong>15</strong>22350Percentage uptake - Over 65Mid Range IMD1<strong>Dudley</strong> PCT AverageEngland Average62.30192657.30390 10 20 30 40 50 60 70Percentage of GP population in most deprived IMD quintileWhen uptake of the „at risk‟ groups in the most deprived quintile are compared thecorrelation is more positive (r = 0.58) (Figure 11). <strong>Dudley</strong> is also slightly higher thanthe England average in influenza uptake <strong>for</strong> these vulnerable groups, but at less than50% there is more that could be done in primary care to reduce the inequality gap <strong>for</strong>influenza uptake rates.<strong>15</strong>0
Percentage uptake of seasonal flu vaccineFigure 11Uptake of seasonal flu vaccine in those at risk by GP against the percentage of GP populationin most deprived IMD quintile, <strong>Dudley</strong> 2008/9 (R=0.58, R 2 =3.4%)4875.504670.50423065.50325137364<strong>15</strong>060.5055.5050.5045.5040.5035.50312123143818527616 47 1720 332135441049 26141343192484528953255273923222934<strong>15</strong>11 400 10 20 30 40 50 60 70Percentage of GP population in most deprived IMD quintilePercentage uptake - Under 65 at riskMid Range IMD1<strong>Dudley</strong> PCT AverageEngland AverageFuel PovertyThere is an established link between poor housing and health and typically it is olderpeople that are living in older properties that are poorly insulated and difficult to heat.Fuel poverty affects rural and urban areas alike, but <strong>Dudley</strong> has small pockets of fuelpoverty where anything between 7.3% and 25.9% of the population are spendingmore than 10% of their income on energy (Figure 12). In general these pockets areto be found in the parts of the borough where there are old properties. The DecentHomes standard was brought in to ensure that all homes are insulated and havecentral heating; <strong>Dudley</strong> is set to meet the Decent Homes standard <strong>for</strong> its councilowned properties by 2011.<strong>15</strong>1
Figure 12Seasonal Excess Winter DeathsCurrent services in <strong>Dudley</strong><strong>Health</strong> through WarmthInitiatives that are in place and have developed since 06/07 include the <strong>Health</strong>Through Warmth initiative that has received national recognition <strong>for</strong> the work in<strong>Dudley</strong> at the NHF Neighbourhood Awards.Excess Winter Deaths Impact GroupA group has been established in <strong>Dudley</strong> to take <strong>for</strong>ward and collaborate on initiativesthat can help reduce winter deaths. This has representation from the followingpeople.Membership includes:-Public health, <strong>Health</strong> through Warmth lead, case managers, commissioning lead <strong>for</strong>older people, local authority managers, specialist nurses <strong>for</strong> COPD and HeartFailure, Age Concern, older people specialist pharmacist and the falls coordinator.<strong>15</strong>2
The group will establish terms of reference and reporting mechanisms such as theOlder People‟s Board<strong>Tackling</strong> Seasonal Excess Deaths at a population levelThe HINST has identified a number of priority actions that are known to impact onreducing seasonal excess deaths and these actions are <strong>for</strong>ming the basis <strong>for</strong> aspecific delivery plan developed by the winter deaths impact group.Next stages and action planEstablish data on the numbers of excess winter deaths (coding by diagnosis)to enable targeted interventionsTo address any inequalities <strong>for</strong> example the most vulnerable and deprivedand develop an action planTo develop a Communication strategy (ensure awareness of public healthmessages )To address the recommended actions plans from the <strong>Health</strong> <strong>Inequalities</strong>National Support TeamEstablish links with health and housingTo develop better public awareness on the dangers, prevention andinterventions.This will include working with public health, the PCT and DACHScommunications, <strong>Dudley</strong> Community Voluntary Services, libraries and localwebsites including the <strong>Dudley</strong> Older People‟s websitewww.ageingwelldudley.org<strong>15</strong>3
7.8 OTHER CONTRIBUTORY CAUSESExternal causes of deathWhere are we and what are the gaps?The external causes of death are defined as those from injury and poisoning andthey account <strong>for</strong> less than 5 per cent of all deaths in England and Wales (3.5% in2008, Vital Statistics). In <strong>Dudley</strong> <strong>for</strong> the same period 1.5% of deaths were due toinjury and poisoning. Deaths from injury and poisoning account <strong>for</strong> nearly half of alldeaths in the <strong>15</strong>-34 age group <strong>for</strong> England and Wales (48.4% in 2008) and 21.4% inthe same age group in <strong>Dudley</strong>. This proportion is significantly higher in men thanwomen. There<strong>for</strong>e deaths from injury and poisoning have a large impact in terms ofpremature deaths and potential years of life lost. In addition to this there isconsiderable research in the literature confirming that the risks of both unintentionaland intentional injury are related to deprivation status, with those at the greatest riskliving in the most deprived areas (Laflamme, Burrows and Hasselberg, 2009).Deaths from injury and poisoning make a significant contribution to the gap seen inlife expectancy between the most and least deprived quintiles in <strong>Dudley</strong> (LHO,<strong>2010</strong>). The estimated life expectancy years gained (2001-2005) if the Most DeprivedQuintile (MDQ) of <strong>Dudley</strong> MCD had the same mortality rate as the least deprivedquintile in the local authority <strong>for</strong> external causes are 1.09 years (16.6%) <strong>for</strong> men and0.03 years (0.8%) <strong>for</strong> women.Figures 1-2 show the trend in mortality from accidents and suicides andundetermined injuries <strong>for</strong> <strong>Dudley</strong> and England and Wales. Five year rates areshown due to the relatively low numbers. For accidents the directly standardisedmortality rates in <strong>Dudley</strong> over the last 20 years have been below those <strong>for</strong> Englandand Wales, but in the last five years <strong>Dudley</strong> has seen a rise in the rate of deathsfrom accidents and now has mortality rates equivalent to England and Wales.<strong>Dudley</strong> is no longer on target to meet “Our <strong>Health</strong>ier Nation” target of a 20%reduction on the 1996 baseline by <strong>2010</strong>. Directly standardised mortality rates <strong>for</strong>suicides and undetermined injury have declined over the last 20 years and havecontinued to track levels <strong>for</strong> England and Wales. The target reduction has been met<strong>for</strong> women but is unlikely to be achieved <strong>for</strong> men. Mortality rates both from accidentsand suicide and undetermined injury are higher in men than women.There is a strong gradient of deprivation <strong>for</strong> mortality from both accidents and suicideand undetermined injuries particularly <strong>for</strong> men as shown in Figures 3-4 respectively.To further understand the data it has been further analysed using the InternationalCollaborative Ef<strong>for</strong>t (ICE) on injury statistics matrix which classifies injury andpoisoning deaths according to both mechanism and intent using standard groups ofthe ICD codes (ONS, 2006).<strong>15</strong>4
Standardised Rate per 100,000 PopulationStandardised Rate per 100,000 Population1983-19871983-19871984-19881984-19881985-19891985-19891986-19901986-19901987-19911987-19911988-19921988-19921989-19931989-19931990-19941990-19941991-19951991-19951992-19961992-19961993-19971993-19971994-19981994-19981995-19991995-19991996-20001996-20001997-20011997-20011998-20021998-20021999-20031999-20032000-20042000-20042001-20052001-20052002-20062002-20062003-20072003-20072004-20082004-20082005-20092005-20092006-<strong>2010</strong>2006-<strong>2010</strong>2007-20112007-20112008-20122008-2012Figure 130Directly Standardised Mortality Rates from Accidents by Year5-Year Rates, <strong>Dudley</strong>, Males & Females All Ages, 1983-1987 to 2008-2012Target: Reduce mortality from Accidents by 20% by <strong>2010</strong> from 19962520<strong>15</strong>1050Figure 220Directly Standardised Mortality Rates from Suicide & Undetermined Injury by Year5-Year Rates, <strong>Dudley</strong>, Males & Females All Ages, 1983-1987 to 2008-2012Target: Reduce mortality from Suicide & Undetermined Injury by 20% by <strong>2010</strong> from 1996181614121086420Figure 3<strong>15</strong>5
Standardised Rate per 100,000 PopulationStandardised Rate per 100,000 PopulationDirectly Standardised Mortality Rates from Accidents by IMD 2007 National Quintile5-Year Rates, <strong>Dudley</strong> MBC, Males & Females Aged All Ages, 2004-200835302520<strong>15</strong>1050Figure 430Directly Standardised Mortality Rates from Suicide & Undetermined Injury by IMD 2007National Quintile5-Year Rates, <strong>Dudley</strong> MBC, Males & Females Aged All Ages, 2004-20082520<strong>15</strong>1050<strong>15</strong>6
Standardised Rate per 100,000 populationFigure 5a & b shows the trend in mortality rates <strong>for</strong> accidents and suicides andundetermined injuries by sex and broad age band. The highest rates are in theoldest age group <strong>for</strong> accidents and this is the only age group where rates areequivalent <strong>for</strong> females and males. Rates are generally higher <strong>for</strong> males thanfemales between ages <strong>15</strong> and 64, with this gap beginning to narrow <strong>for</strong> ages 50-54and older. At ages up to <strong>15</strong>, rates are also more similar between males andfemales, but again tend to be higher in the males. Rates begin to rise after age 9through to age 20-24. In males rates tend to decline from age 20-24 to 65-69 andthen start to increase to the oldest age group. For women the pattern is slightlydifferent with a tendency <strong>for</strong> rates to gradually increase from age 20-24 through toage 50-54, where the rate declines until 65-69 after which the rate increases rapidly.The pattern is different <strong>for</strong> mortality from suicide and undetermined injury but issimilar <strong>for</strong> males and females with the rate increasing from age 10-14 to age 50-54when it declines to age 65-69 when it levels off. The rate overall is considerablyhigher <strong>for</strong> males at all age bands between 10-14 and 60-64.Trends of mortality <strong>for</strong> accidents by broad age band (Figures 6a,b,c & d) show ratesin the 75 and over age band <strong>for</strong> both males and females were far higher than in anyother age group throughout the period 1983-1987 to 2004-2008. Rates in this ageband declined to the late 1990s be<strong>for</strong>e beginning to rise again. For females in allage bands the trend has been <strong>for</strong> the rates to decline across the whole period butthey reached a minimum in the late 1990s. For males, only the under <strong>15</strong> and the 55-74 age band have followed the pattern described <strong>for</strong> females. The other age bandshave shown no overall change.Figure 5a4.5Accident mortality rates by five year age band and sex, <strong>Dudley</strong> 2004-20084MalesFemales3.532.521.510.500 1-4 5-9 10-14 <strong>15</strong>-19 20-24 25-29 30-34 35-39 40-44 45-49 50-54 55-59 60-64 65-69 70-74 75-79 80-84 85+Age band (years)<strong>15</strong>7
Standardised Rate per 100,000 populationStandardised Rate per 100,000 populationFigure 5b1.81.6Suicide and Undetermined injury mortality rates by five year age band andsex, <strong>Dudley</strong> 2004-2008MalesFemales1.41.210.80.60.40.200 1-4 5-9 10-14 <strong>15</strong>-19 20-24 25-29 30-34 35-39 40-44 45-49 50-54 55-59 60-64 65-69 70-74 75-79 80-84 85+Age band (years)Source: Office of National Statistics (ONS) Annual Deaths ExtractOffice of National Statistics (ONS) mid-year population estimatesFigure 6a180Trends in mortality rates <strong>for</strong> accidents by broad age group, males5 year rates 1983-1987 to 2004-2008, <strong>Dudley</strong>1601401<strong>2010</strong>0806040200Under <strong>15</strong> <strong>15</strong>-34 35-54 55-74 75+<strong>15</strong>8
Standardised Rate per 100,000 populationStandardised Rate per 100,000 populationFigure 6bTrends in mortality rates <strong>for</strong> accidents by broad age group, females,5 year rates 1983-1987 to 2004-2008, <strong>Dudley</strong>1801601401<strong>2010</strong>0806040200Under <strong>15</strong> <strong>15</strong>-34 35-54 55-74 75+Figure 6cTrends in mortality rates <strong>for</strong> suicides and undetermined injuries by broadage group, males, 5 year rates 1983-1987 to 2004-2008, <strong>Dudley</strong>454035302520<strong>15</strong>1050Under <strong>15</strong> <strong>15</strong>-34 35-54 55-74 75+<strong>15</strong>9
Standardised Rate per 100,000 populationFigure 6dTrends in mortality rates <strong>for</strong> suicides and undetermined injuries by broadage group, females, 5 year rates 1983-1987 to 2004-2008, <strong>Dudley</strong>454035302520<strong>15</strong>1050Under <strong>15</strong> <strong>15</strong>-34 35-54 55-74 75+Source: Office of National Statistics (ONS) Annual Deaths ExtractOffice of National Statistics (ONS) mid-year population estimatesPatterns of mortality by intent, within mechanismIn 2004-2008, the majority of falls and fractures were unintentional (91% <strong>for</strong> malesand 89% <strong>for</strong> females) (Figure 7a and 8a). If it is assumed that the deaths fromosteoporosis were also unintentional, then all fall and fractures <strong>for</strong> males would beunintentional and 99% <strong>for</strong> females. The majority of deaths from suffocation weresuicides of undetermined intent, though 5% and 25% <strong>for</strong> males and femalesrespectively were unintentional. Poisoning was split across four main intents – drugabuse/dependence (52% <strong>for</strong> males and 25% <strong>for</strong> females), unintentional (23% and29%), suicide (<strong>15</strong>% and 4%) and undetermined intent (11% and 42%). Whencompared to the period 10 years earlier there has been a shift <strong>for</strong> mortality frompoisoning <strong>for</strong> females away from drug abuse/dependence (from 41% in 1994-1998 to25% in 2004-2008), with the opposite true <strong>for</strong> males (increasing from 27% in 1994-1998 to 52% in 2004-2008). All deaths due to transport incidents were unintentional.This is directly a result of the ICD coding guidelines (ONS, 2006).160
PercentagePercentageFigure 7aMechanism of injury by intent <strong>for</strong> males, <strong>Dudley</strong> 2004-2008100%90%80%70%60%50%40%30%20%10%0%OsteoporosisHomicide and probable homicideSuicideMechanismMental and behavioural disorders due to psychoactive substance useUndeterminedUnintentionalFigure 7bMechanism of injury by intent <strong>for</strong> males, <strong>Dudley</strong> 1994-1998100%90%80%70%60%50%40%30%20%10%0%MechanismUnintentionalUndeterminedSuicideHomicide and probable homicideMental and behavioural disorders due to psychoactive substance use OsteoporosisSource: Office of National Statistics (ONS) Annual Deaths ExtractOffice of National Statistics (ONS) mid-year population estimates161
PercentagePatterns of mortality by mechanism, within intentDuring 2004-2008 the most common mechanisms <strong>for</strong> unintentional injuries amongmales were falls and fracture and transport (32% and 30% respectively). Thepattern of mechanisms <strong>for</strong> mortality from unintentional accidents was very similar. In1994-1998 with the exception of 4% of deaths from fire/flame which was absent in2004-2008. For females the majority of unintentional deaths in 2004-2008 and 1994-1998 were due to falls and fractures (46% and 62% respectively), followed byunspecified (42% and 5%). In 2004-2008, <strong>for</strong> suicides, suffocation was the mostcommon mechanism <strong>for</strong> males (67%), compared with poisoning (49%) in 1994-1998.In 1994-1998, 63% of female suicides were due to poisoning with the remainder splitbetween suffocation, cut/pierce, firearm and drowning. Whereas in 2004-2008, themain mechanism, was suffocation (71%) with only 14% due to poisoning.Deaths from undetermined intent had a wider range of mechanisms associated withit, but the major shift has been an increase in the proportion of deaths fromsuffocation and a decrease in the proportion of deaths from poisoning in males.Despite this shift these remain the major mechanisms. For females poisoningremains the main mechanism, but suffocation is now the second mechanism. Therehas been a reduction in the percentage of drownings in females Figure 8a-b.Figure 8a100%90%80%70%60%50%40%30%20%10%0%Mechanism of injury by intent <strong>for</strong> females, <strong>Dudley</strong> 2004-2008MechanismOsteoporosisHomicide and probable homicideSuicideMental and behavioural disorders due to psychoactive substance useUndeterminedUnintentional162
PercentageFigure 8bMechanism of injury by intent <strong>for</strong> females, <strong>Dudley</strong> 1994-1998100%90%80%70%60%50%40%30%20%10%0%MechanismOsteoporosisHomicide and probable homicideSuicideMental and behavioural disorders due to psychoactive substance useUndeterminedUnintentionalSource: Office of National Statistics (ONS) Annual Deaths ExtractOffice of National Statistics (ONS) mid-year population estimatesPatterns of injury and poisoning mortality <strong>for</strong> the top four mechanisms by ageMortality varies by five-year age band according to the mechanism of death. Forfalls and fractures in both males and females there is a strong relationship with age,with rates increasing across the age bands with a rapid rise in rates from age 65 to85+. In this age band falls and fractures are by far the highest mechanism of death(Figure 9a & b). For males the other mechanisms show a similar pattern across agebands, with rates lowest in the 5 to 9 age band and rates rise to a maximum in earlyadulthood. The age band of the peak varies by mechanism – <strong>for</strong> transport it is age20-24, whereby it then declines gradually across the older age bands, whereas <strong>for</strong>poisoning and suffocation it is in men aged 20-24 and 25-29 respectively. For bothpoisoning and suffocation these higher rates are maintained until age 45-49 whenthey begin to decline.For females, rates <strong>for</strong> all mechanisms were lowest in the 5-9 age band. Rates thenrise <strong>for</strong> age, but there is only a clear peak <strong>for</strong> transport in young adults (<strong>15</strong>-24 years).Suffocation peaks at two age bands 30-34 and 50-54, whereas poisonings graduallyrise to age 40-49, decline and have a second rise at 55-59 and then again at age 70-74.163
Standardised Rate per 1,000,000 populationStandardised Rate per 1,000,000 populationFigure 9a45Injury and poisoning mortality rates by five year age group <strong>for</strong> the top fourspecific mechanisms in <strong>Dudley</strong> 2004-20084035Males302520<strong>15</strong>105000 01-04 05-09 10-14 <strong>15</strong>-19 20-24 25-29 30-34 35-39 40-44 45-49 50-54 55-59 60-64 65-69 70-74 75-79 80-84 85+Poisoning Transport Fall and fracture SuffocationFigure 9b4540Injury and poisoning mortality rates by five year age group <strong>for</strong> the top fourspecific mechanisms in <strong>Dudley</strong> 2004-2008Females35302520<strong>15</strong>105000 01-04 05-09 10-14 <strong>15</strong>-19 20-24 25-29 30-34 35-39 40-44 45-49 50-54 55-59 60-64 65-69 70-74 75-79 80-84 85+Poisoning Transport Fall and fracture SuffocationSource: Office of National Statistics (ONS) Annual Deaths ExtractOffice of National Statistics (ONS) mid-year population estimates164
Key findings from analysis of mortality data using the ICE matrixOverall mortality rates due to accidents, suicides and undetermined injury arehigher in males than females. Mortality rates have declined over time andcontinue to do so <strong>for</strong> suicides and undetermined injury, whereas <strong>for</strong> accidentsthere has been an upturn since 2000 and rates <strong>for</strong> <strong>Dudley</strong> are again similar tothose <strong>for</strong> England and Wales.There is a health inequalities gradient <strong>for</strong> mortality from external causes(higher rates in the most deprived areas) and this is worse <strong>for</strong> males.The rise in mortality rates <strong>for</strong> accidents over the last 10 years is mostapparent in the over 75 age band with the main mechanism being falls andfractures. In males there has been little change over time in mortality ratesfrom accidents <strong>for</strong> the <strong>15</strong>-54 age band, whereas it has declined <strong>for</strong> females.This is true also <strong>for</strong> this age band with mortality rates from suicide andundetermined injury.In 2004-2008 falls and fractures were the most common mechanism of injurymortality, followed by poisoning and transport. The move in emphasis awayfrom transport as the main mechanism is due to a real decline in trafficaccidents and to the inclusion of deaths from drug abuse/dependence withdeaths from poisoning and deaths from osteoporosis and fracture withexternal cause unspecified with deaths from falls.There has been an increase in the death rates <strong>for</strong> drug abuse/dependenceand homicide rates in males since 1994-1998.In terms of deprivation the main mechanisms which show a negative socialgradient are poisoning (particularly ages <strong>15</strong>-54 and 75+ <strong>for</strong> males and age 35-74 <strong>for</strong> females), transport <strong>for</strong> males where the negative gradient is prominentin the <strong>15</strong>-34 age band, suffocation which shows a negative gradient overall <strong>for</strong>males and females and this is emphasised in the under 75 age <strong>for</strong> males andthe under 35 age band <strong>for</strong> females. Falls and fractures showed no overallsocial gradient <strong>for</strong> males and showed a positive gradient <strong>for</strong> females over 75,but a negative gradient <strong>for</strong> the younger age bands.Hospital Admissions from external causesFigures 10-11 show the trend in hospital admissions from accidents and suicidesand unintentional injuries <strong>for</strong> <strong>Dudley</strong>. For accidents the directly standardisedemergency hospital admission rates in <strong>Dudley</strong> over the last 6 years have been risingand are significantly higher <strong>for</strong> men than women. Directly standardised emergencyhospital admission rates <strong>for</strong> suicides and undetermined injury have increased overthe last 6 years and this has been at a faster rate <strong>for</strong> females and hence admissionrates are higher <strong>for</strong> females than males. There is a strong gradient of deprivation <strong>for</strong>emergency hospital admissions from both accidents and suicide and undeterminedinjuries particularly <strong>for</strong> men <strong>for</strong> accidents and <strong>for</strong> both sexes <strong>for</strong> suicide andundetermined injury as shown in Figures 12 and 13 respectively. To furtherunderstand the data it has been analysed using the International Collaborative Ef<strong>for</strong>t(ICE) on injury statistics matrix.165
Standardised Rate per 100,000 populationStandardised Rate per 100,000 populationFigure 10Directly standardised emergency hospital admissions from accidents byyear single year rates, males and females, 2003 to 2008, <strong>Dudley</strong>1200100080060040020002003/04 2004/05 2005/06 2006/07 2007/08 2008/09MaleYearFemaleSource: Secondary Users Service (SUS) Hospital AdmissionsOffice of National Statistics (ONS) mid-year population estimateFigure 11250Directly standardised emergency hospital admissions from suicides andundetermined injuries by year single year rates, males and females, 2003 to2008, <strong>Dudley</strong>200<strong>15</strong>01005002003/04 2004/05 2005/06 2006/07 2007/08 2008/09YearMale FemaleSource: Secondary Users Service (SUS) Hospital AdmissionsOffice of National Statistics (ONS) mid-year population estimate166
Standardised rate per 100,000 populationStandardised rate per 100,000 populationFigure 121400Directly Standardised Emergency Hospital Admission Rates from Accidentsby IMD 2007 National Quintile, 5 year rates, <strong>Dudley</strong> MBC, Males andFemales 2004-20081200100080060040020001 - 20% mostdeprived2 3 4 5 - 20% leastdeprivedMales Females <strong>Dudley</strong> Males <strong>Dudley</strong> FemalesSource: Secondary Users Service (SUS) Hospital AdmissionsOffice of National Statistics (ONS) mid-year population estimateDepartment of Communities & Local Government Indices of Deprivation 2007Figure 13300Directly Standardised Emergency Hospital Admission Rates from Suicideand undetermined injury by IMD 2007 National Quintile, 5 year rates, <strong>Dudley</strong>MBC, Males and Females 2004-2008250200<strong>15</strong>01005001 - 20% mostdeprived2 3 4 5 - 20% least deprivedMales Females <strong>Dudley</strong> Males <strong>Dudley</strong> FemalesSource: Secondary Users Service (SUS) Hospital AdmissionsOffice of National Statistics (ONS) mid-year population estimateDepartment of Communities & Local Government Indices of Deprivation 2007167
Standardised Rate per 100,000 populationFigures 14a & b shows the trend in emergency hospital admission rates <strong>for</strong>accidents and suicides and undetermined injuries by sex and broad age band. Foraccidents the highest rates are recorded <strong>for</strong> the under <strong>15</strong> age group <strong>for</strong> males andfemales and these then decline across the age bands to a minimum at age 65-69,after this rates increase again to a maximum at age 85+. Up to age 65-69 admissionrates <strong>for</strong> accidents are higher in males than females and after this age group theopposite is true.The pattern is different <strong>for</strong> emergency hospital admissions from suicide andundetermined injury but is similar <strong>for</strong> males and females with the rate increasing fromage 10-14 to age 20-24 <strong>for</strong> males and age <strong>15</strong>-19 <strong>for</strong> females. The peak admissionrate was considerably higher <strong>for</strong> females, but after the initial peak the rates ofadmissions were similar between the sexes.Trends of emergency hospital admissions <strong>for</strong> accidents by broad age band (Figures<strong>15</strong>a & b) show rates in the 75 and over age band <strong>for</strong> both males and females werefar higher than in any other age group throughout the period 2003 to 2008. Rates inthis and all other age bands have risen over this time period. Trends of emergencyhospital admissions <strong>for</strong> suicide and undetermined injury by broad age band (Figures16a & b) show rates in the <strong>15</strong>-34 and 35-54 age bands <strong>for</strong> both males and femaleswere far higher than in any other age group throughout the period 2003 to 2008.Rates in these age bands have risen the most across this time period <strong>for</strong> both sexesbut the increase has been greatest <strong>for</strong> females, with admission rates <strong>for</strong> these agebands being higher <strong>for</strong> females. Admission rates <strong>for</strong> suicide and undetermined injuryhave also increased <strong>for</strong> the under <strong>15</strong> age band and are higher <strong>for</strong> females. .Figure 14a120Accident emergency admission rates by five year age band and sex, <strong>Dudley</strong>2004-20081008060402000-4 5-9 10-14 <strong>15</strong>-19 20-24 25-29 30-34 35-39 40-44 45-49 50-54 55-59 60-64 65-69 70-74 75-79 80-84 85+Age band (years)Males Females168
Standardised Rate per 100,000 populationStandardised Rate per 100,000 populationFigure 14b40Suicide and Undetermined injury emergency admission rates by five yearage band and sex, <strong>Dudley</strong> 2004-200835302520<strong>15</strong>10500-4 5-9 10-14 <strong>15</strong>-19 20-24 25-29 30-34 35-39 40-44 45-49 50-54 55-59 60-64 65-69 70-74 75-79 80-84 85+Age band (years)Males FemalesSource: Secondary Users Service (SUS) Hospital AdmissionsOffice of National Statistics (ONS) mid-year population estimateFigure <strong>15</strong>a6000Trends in emergency admission rates <strong>for</strong> accidents by broad age group,males, single year rates, 2003 to 2008, <strong>Dudley</strong>500040003000200010000Under <strong>15</strong> <strong>15</strong>-34 35-54 55-74 75+169
Standardised Rate per 100,000 populationStandardised Rate per 100,000 populationFigure <strong>15</strong>b6000Trends in emergency admission rates <strong>for</strong> accidents by broad age group,females, single year rates, 2003 to 2008, <strong>Dudley</strong>500040003000200010000Under <strong>15</strong> <strong>15</strong>-34 35-54 55-74 75+Source: Secondary Users Service (SUS) Hospital AdmissionsOffice of National Statistics (ONS) mid-year population estimateFigure 16a500Trends in emergency admission rates <strong>for</strong> suicides and undeterminedinjuries by broad age group, males, single year rates 2003 to 2008, <strong>Dudley</strong>450400350300250200<strong>15</strong>0100500Under <strong>15</strong> <strong>15</strong>-34 35-54 55-74 75+170
Standardised Rate per 100,000 populationFigure 16b500Trends in emergency admission rates <strong>for</strong> suicides and undeterminedinjuries by broad age group, females, single year rates 2003 to 2008, <strong>Dudley</strong>450400350300250200<strong>15</strong>0100500Under <strong>15</strong> <strong>15</strong>-34 35-54 55-74 75+Source: Secondary Users Service (SUS) Hospital AdmissionsOffice of National Statistics (ONS) mid-year population estimatePatterns of emergency hospital admissions by intent, withinmechanismIn 2004-2008, the majority of falls and fractures were unintentional (99% <strong>for</strong> malesand females) (Figure 17a &b). If it is assumed that the admissions <strong>for</strong> osteoporosiswere also unintentional, then all fall and fractures would be unintentional. Themajority of emergency admissions from suffocation were unintentional, though 29%and 13% <strong>for</strong> males and females respectively were attempted suicide or undeterminedinjury. For females only 8% of admissions due to suffocation were attributed tohomicide/attempted homicide. Poisoning was split across four main intents – drugabuse/dependence (47% <strong>for</strong> males and 22% <strong>for</strong> females), unintentional (<strong>15</strong>% and16%), suicide (34% and 56%) and undetermined intent (3% and 6%).All hospital admissions due to transport incidents were unintentional. This is directlya result of the ICD coding guidelines (ONS, 2006).171
PercentagePatterns of emergency hospital admissions by mechanism, with intentDuring 2004-2008 the most common mechanisms <strong>for</strong> unintentional injuries amongemergency hospital admissions <strong>for</strong> males were falls and fracture and transport (51%and <strong>15</strong>% respectively). For females the majority of unintentional emergency hospitaladmissions in 2004-2008 were due to falls and fractures (76%), followed by transport(6%). In 2004-2008, <strong>for</strong> attempted suicides, poisoning was the most commonmechanism <strong>for</strong> males and females (89% and 93% respectively).Admissions from undetermined intent had a wider range of mechanisms associatedwith it, with poisoning accounting <strong>for</strong> the largest proportion (68% and 92% <strong>for</strong> malesand females respectively). For males cut/pierce and firearms are the other commonmechanisms (12% and 6% respectively).Figure 17a100%90%80%70%Mechanism of injury by intent <strong>for</strong> males, <strong>Dudley</strong> 2004-200860%50%40%30%20%10%0%OsteoporosisHomicide and probable homicideSuicideMechanismSource: Secondary Users Service (SUS) Hospital AdmissionsOffice of National Statistics (ONS) mid-year population estimateMental and behavioural disorders due to psychoactive substance useUndeterminedUnintentional172
PercentageFigure 17bMechanism of injury by intent <strong>for</strong> females, <strong>Dudley</strong> 2004-2008100%90%80%70%60%50%40%30%20%10%0%MechanismOsteoporosisHomicide and probable homicideSuicideMental and behavioural disorders due to psychoactive substance useUndeterminedUnintentionalSource: Secondary Users Service (SUS) Hospital AdmissionsOffice of National Statistics (ONS) mid-year population estimatePatterns of injury and poisoning emergency hospital admissions <strong>for</strong> the topfive mechanisms by ageEmergency hospital admission rates vary by five-year age band according to themechanism of external cause. For falls and fractures in both males and femalesthere is a strong relationship with age, with rates high in the under <strong>15</strong> age band,gradually declining across the age bands to 35-39, when rates begin to increase withincreasing age, with a rapid rise after age 65. In the under <strong>15</strong> age band and the 65+age band falls and fractures are by far the highest mechanism of emergency hospitaladmissions from external causes (Figure 18a & b). For males the other mechanismsshow a similar pattern across age bands, with rates lowest in the 5 to 9 age band andrates rise to a maximum in early adulthood. The age band of the peak varies bymechanism – <strong>for</strong> transport and it is age <strong>15</strong>-24, whereby it then declines graduallyacross the older age bands, whereas <strong>for</strong> poisoning the peak is in men aged 20-39.Struck by/against admission rates peak <strong>for</strong> the <strong>15</strong>-19 age band and then graduallydecline with increasing age. Cut/pierce gradually increases to a maximum rate atage 20-24 and again gradually declines with increasing age.For females, rates <strong>for</strong> all mechanisms with the exception of falls and fracture werelowest in the 5-9 age band. Rates then rise <strong>for</strong> age, but there is only a clear peak <strong>for</strong>poisoning at <strong>15</strong>-19 years and transport in young adults (<strong>15</strong>-24 years). Poisoningsdecline rapidly by age 25 but remain at this elevated level through to age 49, when itgradually declines to very low levels.173
Standardised Rate per 1,000,000 populationStandardised Rate per 1,000,000 populationFigure 18a900800Injury and poisoning emergency admission rates by five year age group <strong>for</strong>the top five specific mechanisms in <strong>Dudley</strong> 2004-2008Males70060050040030020010000-4 05-09 10-14 <strong>15</strong>-19 20-24 25-29 30-34 35-39 40-44 45-49 50-54 55-59 60-64 65-69 70-74 75-79 80-84 85+Age band (Years)Figure 18bFall and fracture Poisoning Transport Struck by, against Cut/pierce900800Injury and poisoning emergency admission rates by five year age group <strong>for</strong>the top five specific mechanisms in <strong>Dudley</strong> 2004-2008Females70060050040030020010000-4 05-09 10-14 <strong>15</strong>-19 20-24 25-29 30-34 35-39 40-44 45-49 50-54 55-59 60-64 65-69 70-74 75-79 80-84 85+Age band (Years)Fall and fracture Poisoning Transport Struck by, against Cut/pierceSource: Secondary Users Service (SUS) Hospital AdmissionsOffice of National Statistics (ONS) mid-year population estimate174
Key findings from analysis of emergency hospital admissions data using theICE matrixOverall emergency hospital admission rates due to accidents, suicides andundetermined injury are higher in males than females. Emergency hospitaladmission rates have increased over time and continue to do so particularly<strong>for</strong> suicides and undetermined injury in females.There is a health inequalities gradient <strong>for</strong> emergency hospital admissions fromexternal causes (higher rates in the most deprived areas) and this is morepronounced <strong>for</strong> males.The rise in emergency hospital admissions rates <strong>for</strong> accidents over the last 6years is most apparent in the over 75 age band with the main mechanismbeing falls and fractures. There has been an increase in admissions ratesacross all age bands and mechanisms.In 2004-2008 falls and fractures were the most common mechanism of injuryadmission, followed by poisoning and transport.In terms of deprivation the main mechanisms which show a negative socialgradient are poisoning (particularly ages <strong>15</strong>-54 <strong>for</strong> males and age 0-54 <strong>for</strong>females), transport <strong>for</strong> males where the negative gradient is prominent in the0-54 age band. Falls and fractures showed a smaller social gradient <strong>for</strong> malesand showed a no gradient <strong>for</strong> females over 75, but a negative gradient <strong>for</strong> theyounger age bands. Although the rate of admissions <strong>for</strong> drowning overall arelow they do all arise from the most deprived quintile mainly in the 0-4 ageband.How do we get there?In 1999, the Government White Paper Saving Lives: Our <strong>Health</strong>ier Nation (GreatBritain. Department of <strong>Health</strong>, 1999) set out the first comprehensive Governmentplan focused on the main killers: cancer, coronary heart disease and stroke,accidents, mental illness. It set out to establish tough but attainable targets in priorityareas. These were that by <strong>2010</strong> death rates accidents would be reduced by at least afifth and serious injury by at least a tenth and <strong>for</strong> mental health to reduce the deathrate from suicide and undetermined injury by at least a fifth. As seen earlier thesetargets are unlikely to be achieved both nationally and in <strong>Dudley</strong>. Additionally thesetargets are even more unrealistic in the lower socioeconomic groups.<strong>Dudley</strong> has had a Joint Accident Prevention <strong>Strategy</strong> Partnership since the year2000, and the current Joint Accident Prevention <strong>Strategy</strong> runs from 2009-2012 withannual action plans (<strong>Dudley</strong> MBC and <strong>Dudley</strong> PCT, 2009). The strategy to daterecognised the impact of health inequalities on accident and unintentional injuries,and the current action plan has key programmes that work across <strong>Dudley</strong> andaddresses the key areas highlighted in this needs assessment (Moss, <strong>2010</strong>).In terms of suicide and undetermined injury, these are covered in the NationalService Framework <strong>for</strong> Mental <strong>Health</strong> (Great Britain. Department of <strong>Health</strong>, 1999)which had seven standards of which Suicide Prevention was Standard Seven andMental <strong>Health</strong> Promotion was Standard One.175
Several factors determine whether a person is likely to take their own life and theseinclude physically disabling or painful illnesses, mental illness, alcohol and drugmisuse and level of support. Stressful life events such as death, loss of a job,relationship breakdown or imprisonment can also contribute and <strong>for</strong> many people it isa combination of factors rather than a single cause (Great Britain. Department of<strong>Health</strong>, 2002). Suicide is the most common cause of death in men under the age of35 and the main cause of death in people who have a mental illness. We know that75% of individuals who commit suicide are not in touch with mental health services,nor do they have a mental disorder (Great Britain. Department of <strong>Health</strong>, 2001),hence a broad strategic approach is required involving a wide range of health andsocial care agencies, voluntary organisations, Government departments, and theprivate sector so that suicide prevention is everyone‟s business.The current National Suicide Prevention <strong>Strategy</strong> <strong>for</strong> England (Great Britain.Department of <strong>Health</strong>, 2002) set out targets <strong>for</strong> 2009–11 <strong>for</strong> reductions in the suiciderate via actions to reduce risk in key high-risk groups, and to promote mentalwellbeing in the wider population. This has been followed up by the Department of<strong>Health</strong> new Mental <strong>Health</strong> <strong>Strategy</strong> New Horizons: Towards a Shared Vision ofMental <strong>Health</strong> in 2009 (Great Britain. Department of <strong>Health</strong>, 2009c). This reportedgood progress in the reduction of suicide rates in the general population and in theprevention of suicide among young men, on mental health wards and in prisons. Itidentifies the need <strong>for</strong> the development of a refreshed strategy by the NationalSuicide Prevention <strong>Strategy</strong> Advisory Group, covering the changing demography ofour society and the current economic climate. This will consider the risks of differentgroups; <strong>for</strong> example, young men leaving the <strong>for</strong>ces, older men and ruralcommunities.<strong>Dudley</strong> developed two strategic documents following the NSF namely:A Joint Mental <strong>Health</strong> <strong>Strategy</strong> <strong>for</strong> <strong>Dudley</strong> <strong>Health</strong> and Social Care Economy2004-<strong>2010</strong>The <strong>Dudley</strong> Adult Mental <strong>Health</strong> Joint Commissioning <strong>Strategy</strong> <strong>2010</strong>-2013The latter of these two documents gives a comprehensive account of the servicescommissioned and an action plan to develop the services further and these considerthe major associated health inequalities.Taking Positive Steps in <strong>Dudley</strong> (Thompson and Gaddu, 2004) was developed as alocal suicide prevention strategy and delivered the following key actions:A Suicide Audit and Prevention Group was established to collate data anddevelop local actions.PCT carried out an analysis of the Significant Event Audits collated andidentified areas <strong>for</strong> action/setting of local standards.Suicide Prevention Awareness Packs were developed and disseminated viatraining to 62 GP practices.Mental health services recorded progress against Preventing Suicide: A toolkit<strong>for</strong> mental health services (NIMHE, 2003).Developed and disseminated <strong>Dudley</strong>‟s Good Mental <strong>Health</strong> Guide across allsectors to enable signposting to relevant agencies.176
Action plan updated in 2008 to rein<strong>for</strong>ce the „combined approach‟ (CSIP,2007, Pg 16) which focused on both primary prevention and secondaryprevention to support individuals/groups at risk of suicide.From the needs assessment in the last six years there has been a notable increasein the rate of hospital admissions from suicide/self-harm, particularly in young womenand there is a strong social gradient associated with this <strong>for</strong> both sexes. The RoyalCollege of Psychiatrists produced a position statement No health without publicmental health the case <strong>for</strong> action (RCP, <strong>2010</strong>). The paper urges the Government toprioritise public mental health as part of their public health policy on the basis thatmental illness is the largest single source of burden of disease in the UK withphysical health being inextricably linked to mental health. The statementrecommends that: „In order to address health inequalities it is essential thatinterventions are targeted at those people who are less likely to benefit from universalapproaches and are at higher risk‟ and „A suicide prevention strategy should remain agovernment priority and should include strategies to address and reduce theincidence of self-harm‟.<strong>Dudley</strong>‟s Mental <strong>Health</strong> Promotion Plan <strong>for</strong> 2006-2009 (Birdi et al, 2006) includedsuicide prevention as one of the 8 priority areas identified <strong>for</strong> local action andsupported working links across both agendas. Currently a new mental healthpromotion plan is being developed in line with the new national mental healthstrategy New Horizons (Great Britain. Department of <strong>Health</strong>, 2009c) and will continueto reflect work on this important health issue and address inequalities.A collaborative and multidisciplinary approach to promoting mental health andpreventing suicide is advocated and will contribute significantly to progress thisagenda, by reducing the potential <strong>for</strong> suicide in key risk groups such as: young men,offenders, victims and survivors of abuse, looked after children, new mothers, Asianwomen, asylum seekers, older people, people who are bereaved by suicide andpeople from lesbian, gay, bisexual and transsexual (LGBT) communities.Next Steps <strong>for</strong> <strong>Dudley</strong> will be to set up a multi-disciplinary Strategic SuicidePrevention Group in line with the refreshed National Suicide Prevention <strong>Strategy</strong> <strong>for</strong>England (Great Britain. Department of <strong>Health</strong>, 2002) to carry this work <strong>for</strong>ward. Keyrecommendations from the NHS West Midlands Regional Development Centre(O‟Hara, 2009) identify a need to focus on:Collaborative and joined up workingProfiling the mental health and wellbeing needs of the local populationsData and in<strong>for</strong>mation supportWork<strong>for</strong>ce development177
8. DELIVERING THE SERVICES THAT WILL MAKE A DIFFERENCE8.1 PRIMARY CARE1. BackgroundThis chapter should be read in conjunction with the Reaching Excellence – APrimary Care <strong>Strategy</strong> <strong>for</strong> <strong>Dudley</strong> 2009- 2014 (NHS <strong>Dudley</strong> and <strong>Dudley</strong> MBC,2009) which highlights a number of key actions to target services to reducehealth inequalities. The needs assessment undertaken to underpin the strategyraised a number of concerns including- Too much variation in GP practice per<strong>for</strong>mance- Variable standards of practice management- The need to scale-up prevention and health promotion- Managing long term conditions- Access to Primary Care2. Proposed Actions To Address <strong>Health</strong> <strong>Inequalities</strong> In Primary Care2.1. Too much variation in GP practice per<strong>for</strong>manceThe PCT is currently reviewing its per<strong>for</strong>mance management arrangements <strong>for</strong> allGP, dental, opticians and pharmacy contractors. Scorecards are being developed <strong>for</strong>all contractor services to enable both poor and excellent per<strong>for</strong>mance to be identified.This approach also enables contractors to benchmark their own per<strong>for</strong>mance at botha local and national level.Where examples of good practice are identified these will be shared and whereunderper<strong>for</strong>mance is an issue support programmes will be established.To support the process of identifying poor per<strong>for</strong>mance and dealing with itappropriately the current policy <strong>for</strong> dealing with per<strong>for</strong>mer list issues is beingreviewed and will be adapted to include contract management issues so that there isa dispute policy with a transparent and open process to be followed when areas ofconcern are identified.In some instances, the consequences may mean re-commissioning an entirepractice. Opportunities to provide a re-commissioned service will be subject to thePCT‟s procurement policies and will there<strong>for</strong>e be open to all potential providers.This approach is being adopted <strong>for</strong> all contractors but is more developed <strong>for</strong> GPpractices as a consequence of reviewing Personal Medical Services Contracts (PMS)this year. Traditionally PMS practices have enjoyed a higher level of funding andthere<strong>for</strong>e the review aims to achieve value <strong>for</strong> money. We have agreed a key set ofper<strong>for</strong>mance indicators that have been categorised into silver, gold and platinumstandards. Over the coming months negotiations will take place with individualpractices around achieving at least silver standards and an agreed level of gold andplatinum over the next 3 years depending on the level of funding that is beingreceived. The outcome of this piece of work will be that all practices will be achieving178
the minimum standards set out by the PCT, agreed with the Local MedicalCommittee and explicitly stated in the PMS contracts. General Medical ServicesContracts (GMS) will also be expected to achieve the minimum standards required bythis approach.Where practices fall below these standards, timeframes <strong>for</strong> improvement will beagreed, and time limited support <strong>for</strong> improvement will be provided in certaincircumstances. Following this, if a practice fails to improve to the required standard,the PCT will:- limit the practice‟s opportunities to deliver extended services, until acceptablestandards are achieved <strong>for</strong> universal services- re-commission the service or services where per<strong>for</strong>mance continues to be belowthe agreed standard beyond the agreed timescale <strong>for</strong> improvement.2.2 Variable standards of practice managementPractices require good management skills to ensure robust business and clinicalsystems are in place; <strong>for</strong> instance, in order to target services at particular groups ofpatients, practices must have highly effective call and recall systems which aresupported by good data recording. There are currently <strong>15</strong> of our 54 GP practiceswho score less than 90% of the possible achievement points in the organisationaldomain in QOF.Looking ahead, general practice is likely to need an increasingly high standard ofpractice and business management. In recognition of existing variability and thefuture potential requirements, the PCT will work with local practice managers tocreate an advanced practice manager development programme which is accreditedwith a local University. This will help <strong>Dudley</strong> to grow its own cadre of the nextgeneration practice managers, who will have the top-level skills likely to be required<strong>for</strong> general practice in the coming decade.The PCT will also work jointly with local practice managers to develop a mentoringscheme. This will provide sessional support from a highly experienced practicemanager to work alongside staff in a practice, which wishes to develop its systemsand staff skills further.2.3 Primary Care Continuing Professional Development (CPD)General Practice within <strong>Dudley</strong> has historically had access to a comprehensiveeducation programme provided by the PCT. Traditionally a large number of practiceshave made best use of the training available but there are still practices who do notparticipate in training. A training needs analysis is underway to in<strong>for</strong>m how we canbetter commission training to meet the needs of all practices within <strong>Dudley</strong>. This willresult in more innovative ways of delivering training supporting practices who alreadyengage but also reaching those who currently do not.A local primary care Continuing Professional Development (CPD) scheme will bedeveloped which provides opportunities <strong>for</strong> multi-disciplinary groups of staff to learntogether on priorities arising from this strategy, including:179
- primary healthcare teams coming together within a practice or on a locality basis,involving GP practice staff, PCT community staff, pharmacists and social carestaff – this will support local integration and coordination of services- joint CPD between consultants, GPs, nurses, therapists, pharmacists, supportworkers and managers working in both secondary and primary care, initially tosupport better management of long term conditions, improving care pathways andpersonalised services.The PCT will also explore opportunities to provide training to all primary carecontractors including dentists, pharmacists and opticians.Good practice management enables practices to have robust business and clinicalsystems in place. Practice management is the bedrock of good clinical outcomes2.4 Access To Primary CareResearch into the access to primary care by Black and Minority Ethnic (BME)communities has been shown that certain communities do not access primary care.The PCT has commissioned a new GP practice in the Kates Hill ward that willprovide an outreach facility to engage with groups offering health promotion adviceand encourage them to use all primary care services appropriately. Patients will alsobe able to register with this new practice so long as they live within a reasonabledistance.3. Systematic and targeted prevention and early detection of diseaseThe needs assessment found that the prevalence rates of some major diseases aremuch lower than expected. This suggests that there are significant numbers ofpeople who are in the early stages of diseases, which if treated, could improve theirlife expectancy.Based upon GP practice disease registers an estimate of prevalence can be madetaking account of age, gender, ethnicity and deprivation. An analysis of the 2008/9data shows that there may be quite large numbers of people missing from diseaseregisters:Table 1: GP Disease RegistersDiseasesEstimated number of people‘missing’ from GP registersHypertension 28,700Asthma 10,300Dementia 3,000Diabetes 1,800Coronary heart 1,990disease (CHD)Strokes/TIA 800180
Further analysis shows that <strong>for</strong> hypertension, asthma and dementia, the „missing‟patients are spread out across most GP practices. This suggests that <strong>Dudley</strong>-wideinitiatives will be needed in order to improve the detection of these diseases. Incontrast, <strong>for</strong> diabetes, CHD and strokes, there are „missing‟ patients in only a smallnumber of practices. This suggests that action needs to be targeted in thesepractices in order to improve detection.There is also variation across practices in respect of MMR, childhood immunisationand flu vaccinations.Prevalence and vaccination Indicators have been agreed as part of the revisedper<strong>for</strong>mance management arrangements described above to ensure that all practicesachieve the PCT‟s minimum standards in these areas.4. Managing Long Term ConditionsThe Quality and Outcomes Framework (QOF) provides a useful way of assessinghow well primary care manages people with a long-term condition. In <strong>Dudley</strong>, GPpractices as a whole are in line with the national and regional averages <strong>for</strong> mostaspects of chronic disease management. Again, this masks some very high levels ofper<strong>for</strong>mance as well as some practices where per<strong>for</strong>mance is below average.Although the QOF was originally set up to incentivise best clinical practice, and is nota contractual requirement, the clinical standards do support high quality chronicdisease management.Through improved per<strong>for</strong>mance management arrangements, GP practices who arenot achieving targets will be supported to improve their existing per<strong>for</strong>mance andwhere they consistently fail measures will be put in place to addressunderper<strong>for</strong>mance (see section 1). Good practice will be identified and shared toimprove outcomes <strong>for</strong> patients in poorer per<strong>for</strong>ming practices.Table 2 gives examples of the numbers of people in <strong>Dudley</strong> with long-term conditionsthat are missing out on specific treatments or interventions, which are known toimprove health. For these patients, health outcomes are likely to be poorer than <strong>for</strong>patients receiving the treatments. Treating these patients to QOF standards wouldmake a significant contribution to reducing health inequalities in <strong>Dudley</strong>.The number of people with hypertension, whose blood pressure is not managed tothe standard, is of particular note, since poor blood pressure control <strong>for</strong> this group isa risk factor <strong>for</strong> a number of other serious long-term conditions.181
Table 2 – Numbers of patients with long-term conditions who are not receivingclinical treatments, which improve health based on 2008/9 QOF Data<strong>Dudley</strong>achievementin 2007/08No. eligiblepatientsClinical indicators (fromQOF)Blood pressuremanagement of patientswith coronary heartdisease (<strong>15</strong>0/90 or less).CHD6 89.46% 12,172 1,283Patients with coronaryheart disease who havebeen prescribed a betablocker in the last 6months CHD10 75.20% 9,886 2,452Cholesterol managementof patients with TIA orstroke (5mmol/l or less).STR8 78.5% 5,<strong>15</strong>3 1,090Blood pressuremanagement of patientswith hypertension (<strong>15</strong>0/90or less). BP5 77.82% 49,873 11,061Patients with diabeteswhose blood sugar levelis under control (HbA1c is7.5 or less (or equivalenttest). DM20 69.52% 12,626 3,848Blood pressuremanagement of patientswith diabetes (145/85 orless). DM12 76.8% 12,881 2,988Patients with asthma whohave had a review in thelast <strong>15</strong> months. AST6 79.99% 17,995 3,600No. of patients nottreated to the QoFstandard (excludesexception reports)182
8.2 SOCIAL CAREAdult Social CareSocial Care in <strong>Dudley</strong> is delivered across two Council Directorates, the Directorate ofAdult, Community and Housing Services and the Directorate of Children‟s Servicesas well as through the <strong>Dudley</strong> Walsall Mental <strong>Health</strong> Trust.The Directorate of Adult, Community and Housing Services commission services tomeet the assessed need of adults in <strong>Dudley</strong> who require social care services. This isprovided to service user groups such as- Older people- Adults with physical disabilities- Adults with learning disabilities- Adults with sensory impairmentsServices are commissioned by the Directorate of Adult, Community and HousingServices to meet these needs. These services are provided by either the private andindependent sector or the Council‟s in-house provision. Strategic arrangement ofprovision across these sectors is focussed on key activities such as hospitaldischarge, intermediate care and promoting independence or „re-ablement.‟ The<strong>Dudley</strong> <strong>Health</strong> and Social Care Commissioning Framework and <strong>Strategy</strong> 2008-13(NHS <strong>Dudley</strong> and <strong>Dudley</strong> MBC, 2008) is the over-arching statement of ourcommissioning intention which include focus on health inequalities and specific jointcommissioning activity such as in mental health, learning disabilities or specific partsof older people‟s services e.g. equipment services.Through a grant-funding programme, the Directorate of Adult, Community andHousing also supports numerous small providers of services in the Borough who aresupporting specific communities such as black and minority ethnic communities in<strong>Dudley</strong>.Assessment of individuals is largely undertaken in a locality basis across the fivedistricts of the Borough. This means that locality teams are closely linked to all theareas that they serve and as such are close to the concerns of local communities.Specialist services <strong>for</strong> people with learning disabilities are also arrangedgeographically but on a North-South basis. Community Care Development Workers<strong>for</strong> the teams support work to engage even more closely with people from black andminority ethnic groups across the Borough. People with complex disabilities aresupported through an Independent Living Team with a focus on promotingindependence. Occupational Therapy services play a key role in the overallassessment and support process e.g. in the assessment <strong>for</strong> the provision ofequipment where use of such equipment will allow people to be more independent.Social Work staff also work in the hospital setting to ensure a whole-system approachto hospital discharge, ensuring safe transition across a pathway from hospital tocommunity settings.183
The Local Authority has lead responsibility <strong>for</strong> ensuring that adults are safeguardedin <strong>Dudley</strong> and this is done under the auspices of a <strong>Dudley</strong> Safeguarding AdultsBoard. All agencies contribute to this but the Council ensures co-ordination of ef<strong>for</strong>t.Mental <strong>Health</strong> Services are delivered through the <strong>Dudley</strong> Walsall Mental <strong>Health</strong>Trust. This provides the full range of mental health interventions <strong>for</strong> adults in <strong>Dudley</strong>across the social care and health spectrum. It includes the role of the Social Workand social care staff working in mental health to support the delivery of theseservices. The services cover in-patient hospital treatment to community supportincluding assertive outreach.These services, there<strong>for</strong>e, support people in meeting their care needs throughadvice, in<strong>for</strong>mation and guidance, assessment, brokerage and direct serviceprovision. The aim of the services is to “Put People First,” promote independence ofservice users and support to in<strong>for</strong>mal Carers. This ef<strong>for</strong>t requires partnershipworking and through this people have opportunity to engage with the services andmeet their desired outcomes. Structures such as the Older People‟s Board or theLearning Disability Board promote this approach whereby people who use services,their carers and the wider public can engage as needed.In this way, <strong>Health</strong> <strong>Inequalities</strong> are addressed through promoting equitable access toand engagement with services to promote the independence of users and carers.184
8.3 TRANSFORMING COMMUNITY SERVICESIntroduction<strong>Dudley</strong> Community Services provide a wide range of adult and children‟s services tothe population of <strong>Dudley</strong>. The core service specifications have been developed overmany years and are regularly reviewed to ensure they are able to respond todemographic changes identified within the Joint Strategic Needs Assessment (Littleand Moss, 2009) and other commissioning strategies. In 2009/10 the CommunityContract was agreed with commissioners and has been used by them to monitor theper<strong>for</strong>mance of <strong>Dudley</strong> Community Services on activity and quality indicators. Thisreport endeavours to outline the key changes we have made to the way our servicesare managed and demonstrate how we believe we have positioned ourselves torespond to the agenda <strong>for</strong> Trans<strong>for</strong>ming Community Services and to support thecommissioners in addressing the priority needs of the resident population of <strong>Dudley</strong>Borough and reduce <strong>Health</strong> <strong>Inequalities</strong>.Vision and Values within <strong>Dudley</strong> Community Services.In 2009/10 we developed our own set of vision and value statements which built ofthose of <strong>Dudley</strong> PCT but reflected the “provider” function more clearly so that theyhad added relevance to our service areas. These have been updated <strong>for</strong> <strong>2010</strong>/11 toreflect the Trans<strong>for</strong>ming Community Services agenda and have been distilled into 5mission statements;Box 1 Mission Statements1. To lead the safe transfer of DCS into one or more alternative organisationsunder the TCS agenda2. To work in partnership to develop integrated services which deliver a positivepatient experience, promote independence and improve health outcomes3. To deliver prevention and early intervention services that meet the needs of ourcommunities4. To provide first class community health services that people trust, in the rightsetting and at the right time5. To attract and retain an effective, diverse and flexible work<strong>for</strong>ce enabling themto develop their skills and expertiseThese mission statements and supported by the nine strategic objectives shown inBox 2 and will be linked to the DCS business plans and those of the clinical businessunits. This helps us to ensure that prevention and early intervention are seen aseverybody‟s business and enables us to focus on this as we continue to trans<strong>for</strong>mcommunity services.Box 2 Strategic Objectives1. We will effectively lead DCS through an organisational change managementprogramme2. We will achieve clinical excellence3. We will contribute to the achievement of public health targets4. We will design and deliver patient centred care, develop new and existingservices to meet changing needs5. We will ensure the health and safety of our patients, staff and visitors185
6. We will manage our resources effectively7. We will attract and retain an effective, flexible work<strong>for</strong>ce8. We will use technology to improve per<strong>for</strong>mance9. We will develop strong and effective partnership workingWhat have we done so far?In 2009/10 DCS responded to the Trans<strong>for</strong>ming Community Services agenda andundertook a full management restructure. This enabled us to develop 3 ClinicalBusiness units which focus on Children, Young People and their Families; Long TermConditions and End of Life Care; Acute Care and Rehabilitation. We believe this willhelp us support the commissioners in addressing their key priorities on Public <strong>Health</strong>targets, Unplanned Care and Long Term Conditions.We have focused the <strong>Health</strong> Visiting service on the pre-school children and aredeveloping effective transition from them to the School <strong>Health</strong> Advisor services. Thisincludes shared records which will improve continuity of care <strong>for</strong> children withadditional needs. Both <strong>Health</strong> Visitors and School <strong>Health</strong> Advisors have a significantpublic health role around prevention and early intervention <strong>for</strong> the registered GPpopulations, school populations and also <strong>for</strong> wider public health initiatives.The Community <strong>Health</strong> Nurses who provide services <strong>for</strong> the elderly have beenrealigned to the community nursing services which will enable them to furtherdevelop their role in addressing the needs of some of our most vulnerable patientsand this should support care closer to home, admission avoidance and effectivedischarge after a period in hospital. The community nursing teams have also beenreviewed and are working more effectively within their clusters.<strong>Dudley</strong> Community Services also played a key role in responding effectively to thePandemic in 2009. We provided immunisation services <strong>for</strong> patients and staff and alsomade significant contributions to the establishment and running of the Anti-ViralCollection Point.Actions to support the reduction of <strong>Health</strong> <strong>Inequalities</strong>.A virtual ward pilot is being run in a Practice in one of the most deprived areas of theBorough and if effective will be rolled out in the north of the Borough which willaddress a significant level of health needs <strong>for</strong> some of our most deprived populationsOur Nurse Consultant <strong>for</strong> Long Term Conditions undertook a review of frequentattendees at Emergency Departments. This showed a significant number who haddrug or alcohol issues and this work is being taken <strong>for</strong>ward within the urgent carework streams to identify how the needs of these clients can be met. We are trainingall our <strong>Health</strong> Visitors in Breast Feeding to establish best practice.We will be training all staff to undertake Brief Interventions with clients. We havedeveloped an award winning service <strong>for</strong> children and adults from ethnic minoritygroups affected by Haemoglobinopathies.186
DCS has some key per<strong>for</strong>mance targets relating to public health and healthinequalities in our community contract and CQUIN targets which we will be deliveringin <strong>2010</strong>/11 these include; Breast Feeding, Smoking Cessation, Obesity,Our Learning Disability Specialist <strong>Health</strong> Service continues to address the healthinequalities of clients/patients with a learning disability with the provision of over 1700specialist training places this year <strong>for</strong> staff working within learning disability servicesand generic health and social care providers. In addition training is provided to GPsand their surgery staff in support of the DES health screening.We have redesigned the Community Team <strong>for</strong> Learning Disabilities to ensure thatthe nursing resource are able to target patients health needs and link with thedelivery of care continued with the individual „<strong>Health</strong> Action Plans‟Our LD <strong>Health</strong> Access Service continues to support clients to access cancerscreening programmes, e.g. Breast, Cervical and Bowel screening and makingin<strong>for</strong>mation as accessible as possible to help mainstream stream services makereasonable adjustment. Within the Acute Hospital this service has had influence toensure a new system to identify LD patients who need additional support andconsideration is implemented, together with the introduction of a Champion withintheir ED services. This year has also seen the further development of our olderpeople‟s dementia service and continued developments within mental health with theprogress of the Green Light and equality of access.Timely access to a musculoskeletal service is important to the return of an individualto everyday activities including work. Our physiotherapy musculoskeletal service hasintroduced a centralised booking system <strong>for</strong> patients some from areas of highdeprivation. This system has enabled these patients to access the service faster byoffering the next available appointment rather than the next appointment at a nearbyclinic.Our Community Diabetes Specialist Service is able to provide a service <strong>for</strong> patientsthat is culturally sensitive. The service is able to encourage the education of not onlythe patients but also their families. In doing this the service is able to educate a widergroup of people in the risks associated with diabetes and the strategies needed toreduce the incidence.The podiatry service is receiving targeted service improvement to improve access tothe service especially <strong>for</strong> the „housebound‟ patients requiring care at home.DCS are working with the Strategic <strong>Health</strong> Authority (Project 9) and ourWolverhampton University partners to develop the work<strong>for</strong>ce in the delivery ofspecified pathways. The selected projects are:- Diabetes- Stroke- COPD- End of Life care187
DCS have been commissioned to provide tissue viability services and we look<strong>for</strong>ward to developing this new service within <strong>Dudley</strong>.A <strong>Health</strong> Visitor is seconded to the Zone <strong>for</strong> four hours a week to look at the healthneeds of young people who are substance misusers. All young people seen willhave a health plan developed <strong>for</strong> them.The Youth Offending Nurse is working some additional hours to support the FamilyIntervention Project. The project offers intense support packages to children andfamilies where there are particular issues related to offending behaviour and ismanaged within the Youth Offending Service.Recruitment has taken place <strong>for</strong> a Specialist Speech and Language Therapist to workone day a week in the Youth Offending Team, this is a new initiative.The Paediatric Asthma and Allergy Clinic has just commenced funded by theQueen‟s Nursing Institute and the NHS West Midlands Fund <strong>for</strong> Innovation. This willoffer an accessible service closer to home.The Speech and Language Team (SALT) service employs a bilingual co- worker, andwe also use Language Line (as well as Applied Language Solutions (ALS)). Thismeans that clients can have the service explained to them and appointments made ina language they understand, which means they can consent and commit totreatment. They then come along and have an interpreter via ALS when they come totheir appointments.SALT also prioritise looked after children, and has targeted services <strong>for</strong> hard to reachchildren.188
8.4 DEVELOPING THE ROLE OF THE VOLUNTARY AND COMMUNITYSECTORThere have been long-standing positive relationships between public sector healthand social care agencies and the voluntary and community sector in <strong>Dudley</strong>. Manyof our services in <strong>Dudley</strong> could not be delivered without the voluntary and communitysector.Examples have included:- Grant Funded services by the <strong>Dudley</strong> MBC‟s Directorate of Adult, Community andHousing Services to Black and Minority Ethnic groups in <strong>Dudley</strong> who provide daycare and other specialist support within the sector- Service Level Agreements by the Directorate of Adult, Community and HousingServices with larger providers such as MIND or ReThink- <strong>Health</strong> Act (<strong>for</strong>mer “Section 28”) support by NHS <strong>Dudley</strong> to local voluntary andcommunity sector activity- Advocacy roles carried out by organisations on behalf of specific service usergroups- LINk activity undertaken as part of their remitThese examples are underpinned by the Commissioning intentions of both <strong>Dudley</strong>Council‟s services in adults and children‟s social care and those of NHS <strong>Dudley</strong>.Our Joint Commissioning Framework made health inequalities a key in<strong>for</strong>mingprinciple <strong>for</strong> our approach to commissioning and the examples of the way we workwith the voluntary and community sector referred to above are very much part of thatapproach.This context is also strengthened by the broader activity undertaken by the <strong>Dudley</strong>Community Partnership and its partners in working with the voluntary and communitysector to develop a Compact (More in<strong>for</strong>mation available athttp://www.dudleylsp.org/local-compact). <strong>Dudley</strong>‟s Local Compact is a partnershipagreement between the local public agencies in <strong>Dudley</strong> Borough, and the voluntaryand community sector. <strong>Dudley</strong>‟s first Compact was published in June 2002 and hassince been revised to include all members of the <strong>Dudley</strong> Community Partnership. Therevised Local Compact was <strong>for</strong>mally signed by representatives of the Partnership inMay 2004.The Local Compact recognises the invaluable contribution made by voluntary andcommunity organisations to the Borough. It sets out a number of principles andundertakings on behalf of local agencies and the voluntary and community sector inorder to improve relationships and to work more effectively together in improving thequality of life in the Borough.This framework aims to give an overall coherence, there<strong>for</strong>e, to the way in which thesectors work together and this is given practical effect in the delivery of care andhealth services and the voice which is given to users, carers and patients of ourservices.189
An important addition to this arrangement is the recent development of a <strong>Dudley</strong>Borough Faith Leaders‟ Network which was <strong>for</strong>mally launched in November 2009.This strengthens the united voice of all religions that are represented in the Boroughin a variety of ways.The voluntary, community and faith sectors are important to our health inequalitiesbecause they often work in areas of deprivation where the issue of health inequalitiesis at its sharpest in terms of the multiple issues that affect those areas relating toemployment, income, housing, skills and experience of health. The work of thesector – particularly in its representative and advocacy roles - often enables thepublic sector to see more clearly how communities are developing and responding tothe many issues that they face in relation to health inequalities.The <strong>Dudley</strong> Community Partnership worked with the sector to produce “In ItTogether” a strategy <strong>for</strong> engagement. The title indicates the overall sharedcommitment in the locality and recognition that our work together is how we can bestrespond to issues of multiple deprivation and sequencing of interventions across allsectors in proactively responding to the challenges we face.This was something that was noticed by the HINST when they visited us.recognised the following points:TheNext stepsThere are positive ef<strong>for</strong>ts being made to engage the third sector in identifyingpriorities and opportunities <strong>for</strong> them to become engaged in the healthinequalities agenda. Valuing People: Moving Forward Together, (Great Britain.Department of <strong>Health</strong>, 2004) Compact agreements are some examples of thisA new document on commissioning with voluntary, community and faithorganisations should help to develop this sector further as potential providersof services <strong>for</strong> the Local Authority and the PCTThe Faith Leaders Network has already identified work on poverty andhomelessness as possible areas <strong>for</strong> joint workingWe have a positive context in which to move <strong>for</strong>ward in our engagement with thevoluntary, community and faith sectors as it affects health inequalities in <strong>Dudley</strong>.Most recently, with the support of the Office <strong>for</strong> the Third Sector, we have engagedwith further dialogue to develop our relationship and any practical changes that mightresult from that. For example, it is important to us that our local sector isappropriately skilled to participate in tendering exercises to maximise their chances ofsuccess within the competitive model. The sector will be addressing that withappropriate support. This will add to the way in which health inequalities can beaddressed in the Borough through direct service provision or by strengthening thevoice of specific communities in service planning, <strong>for</strong> instance, which will influenceservice delivery.The Coalition Government‟s approach to the Big Society and a renewed emphasis onlocalism and civic engagement mean that the voluntary and community sector remain190
at the heart of action to address community engagement and address healthinequalities.The <strong>Dudley</strong> LINk have a developed work programme that is being carried out and willadd to the overall awareness of the wider health and social care sector relating tohealth inequalities. The NHS White Paper, Liberating the NHS (Great Britain.Department of <strong>Health</strong>, <strong>2010</strong>) states that a body called <strong>Health</strong>Watch will be developedwith related aims to LINks and this will take <strong>for</strong>ward this agenda.The <strong>Health</strong> <strong>Inequalities</strong> Action Plan will be the „vehicle‟ through which theseaspirations are made real.191
8.5 VOLUNTEERS, HEALTH CHAMPIONS AND HEALTH TRAINERSThe recent Marmot Review (<strong>2010</strong>) puts empowerment of individuals andcommunities at the centre of action to reduce health inequalities. In doing so, it setsout a vision of “creating conditions <strong>for</strong> individuals to take control of their own lives.”The Community <strong>Health</strong> Improvement team (Public <strong>Health</strong>) in collaboration with<strong>Dudley</strong> Metropolitan Borough Council (DMBC) and the Voluntary and CommunityFaith Sector (VCFS) are working to address health inequalities through an approachwhich engages and empowers people from local communities to develop theconfidence, knowledge, skills and awareness to improve their own health and wellbeing as well as to influence the health and well being of others within theircommunity.Communities as geographical areas, or as collectives of people living in the sameplace or sharing a common identity, can influence an individual‟s health in a numberof ways, and it is often the negative impacts which are highlighted (e.g. levels ofcrime and anti-social behaviour resulting in people not feeling safe to go out andexercise). However, the impact of „word of mouth‟ health in<strong>for</strong>mation, challenges tocommonly held beliefs and misconceptions, „support from next door‟, and themodelling and normalisation of healthy lifestyle behaviours can also directly impacton and positively influence the health and wellbeing of individuals in a way that healthprofessionals are not able to.By harnessing this potential, raising health aspirations and supporting local people tomake a difference in the heart of their communities, Community <strong>Health</strong> Champions,Public <strong>Health</strong> Volunteers and <strong>Health</strong> Trainers can give individuals the in<strong>for</strong>mation,support and motivation they need to make healthier choices and sustain healthierlifestyles.Through the Community <strong>Health</strong> Champions (CHC) programme local people areengaged and motivated to learn about and change their own health behaviours, andthen supported as volunteers to empower and influence their friends, families,neighbours, work colleagues and the wider community.Community <strong>Health</strong> Champions can be recruited through workplaces or may be local„community activists‟ who are identified through well established groups. However,the main focus is on engaging individuals from the most deprived communities orgroups experiencing health inequalities. In this case, initial engagement may typicallyoccur through community engagement activities, such as Arts in <strong>Health</strong> projects,which enable people to get involved in creative and non-threatening activities, andconsequently establish and build trusting relationships, build their confidence andself-esteem and raise their health aspirations. In addition to raising their ownawareness, these projects enable the community to identify local needs or keyissues, which can then in<strong>for</strong>m service redesign and commissioning decisions. Bysupporting participants to become Community <strong>Health</strong> Champions, the projectbecomes sustainable, as key messages and support ripple out into the communitybeyond the duration of the initial project.192
CHC‟s are trained and supported to „get good health in<strong>for</strong>mation into diversecommunities‟. They are well placed to do so, having local knowledge and credibility,language skills and cultural understanding, and as a result they are able to signpostand support people to access services and activities or pass on health messages topeople who otherwise would find themselves isolated from professional services.CHC programmes have been shown to connect with people living in some of themost isolated and deprived communities and to be successful in improving healthoutcomes whilst also demonstrating the cost effectiveness of community engagementAltogether Better Executive Summary (NHS Yorkshire and the Humber, 2008/09).Initial outcomes from People in Public <strong>Health</strong> (South, 2009) case studies reviewed byLeeds Metropolitan University identifies a number of potential impacts of the CHC‟sprogramme. These include increased knowledge, understanding, confidence andself-esteem; social benefits i.e. reduction of social isolation, community cohesion andless stress; skills development and employability; better access to services and otherhealth resources (especially with groups that are less advantaged); and betterin<strong>for</strong>mation flows between community and public services in addition to the directbenefits of an increase in healthy behaviours (e.g. increased levels of physicalactivity, fruit and vegetable consumption etc.).The Community <strong>Health</strong> Champions model is being introduced in <strong>Dudley</strong> to engageand support those individuals who may not have the confidence to take up more<strong>for</strong>mal volunteering opportunities. It will provide an important stepping stone into theestablished and more <strong>for</strong>mal Public <strong>Health</strong> Volunteering Programme which trainsvolunteers to deliver key lifestyle services, such as Get Cooking classes, stopsmoking groups, weight management classes, expert patient programmes andphysical activity programmes such as led walks. Recruitment of volunteers ispredominantly targeted within deprived communities and the opportunities availableoffer many social benefits to both the volunteers and the wider community. For manypeople voluntary work can also be the first step towards paid employment. Havingdeveloped confidence, valuable skills and experience and demonstrated theircapabilities, many volunteers become paid as sessional workers to deliver theseservices, or go on to other education, training or employment opportunities.<strong>Health</strong> Trainers (HT) provide one potential route to employment <strong>for</strong> Public <strong>Health</strong>volunteers, and other local people who have experience of working in their localcommunity, and a desire to help people achieve a positive lifestyle change.<strong>Health</strong> Trainers were identified as an important resource <strong>for</strong> tackling healthinequalities in the „Choosing <strong>Health</strong>‟ White Paper (Great Britain. Department of<strong>Health</strong>, 2004), in line with the shift from „advice on high to support from next door.‟<strong>Health</strong> Trainers are drawn from local communities and understand the day-to-dayconcerns and experiences of the people they are supporting. Whilst they share somecommon characteristics with CHCs, the HT programme is based on an NHSwork<strong>for</strong>ce model. Unlike the CHC model, which allows <strong>for</strong> more local flexibility, HTServices are underpinned by a framework and set of „core principles.‟ HTs are alsorequired to demonstrate their competency against two national competencies of193
occupational standards, and work within the constraints of a nationally banded jobdescription.The <strong>Health</strong> Trainer Service in <strong>Dudley</strong> will engage with individuals from targetedcommunities or geographical populations, and supports those who experience thegreatest inequalities in health. The service is aimed at people aged 18+ who haveexisting lifestyle risk factors (e.g. smoking), have a long term condition and wouldbenefit from lifestyle changes (e.g. diabetes) or who have previously been referred tolifestyle services but failed to attend or did not complete the programme. Individualscan be referred through a range of referral routes or self refer if they prefer.<strong>Health</strong> Trainers will support, encourage and motivate adults who want to make achange towards a healthier lifestyle but who are unlikely to make and maintain thesechanges without one to one support. They will promote healthy lifestyle changes inrelation to diet, exercise, alcohol consumption, or smoking cessation and supportindividuals to explore options <strong>for</strong> health improvement by promoting small changesthat will ultimately have a large impact on their overall health. This is achieved bysetting goals, creating personal development plans and then supporting them toachieve these goals by providing the appropriate in<strong>for</strong>mation and support. <strong>Health</strong>Trainers can help to translate health messages and ensure that clients are able toaccess the most appropriate services. Finally the clients are regularly followed up toassess their progress and to maintain motivational support.There is strong evidence to suggest that providing support from the „person nextdoor‟ in conjunction with psychological skills to alter behaviour can help to reduceinequalities in health (Elliott et al., 2001).In addition to addressing issues of poor mental and physical health, poor access toservices and different lifestyle choices of individuals, the <strong>Health</strong> Trainer service alsofocuses on increasing the capacity and capability of people from within localcommunities to develop a new work<strong>for</strong>ce with the skills to tackle inequalities inhealth.HTs undertake training and gain experience and skills which are transferable to otherNHS and non-NHS organisations. The recent HT work<strong>for</strong>ce audit indicates that HTsleaving the service typically progress to full-time employment, often within health orsocial care (Murfin, Mitchell et al., January <strong>2010</strong>).At full capacity <strong>Dudley</strong>‟s <strong>Health</strong> Trainer Service will have 10 whole time equivalent(wte) <strong>Health</strong> Trainers, managed by a <strong>Health</strong> Trainer Service Coordinator andsupported by a part-time administrator. Recruitment to <strong>Health</strong> Trainer posts is beingundertaken in two phases, alongside support and capacity building in the Voluntary,Community and Faith Sector to enable services to be commissioned from them in thenear future.The Community <strong>Health</strong> Champion, Public <strong>Health</strong> Volunteer and <strong>Health</strong> TrainerProgrammes all play an integral role in World Class Commissioning by ensuring abottom-up approach to influencing planning and commissioning decisions locally, andstrengthening the capacity of the Third Sector. But most fundamentally, they build the194
capacity and confidence of individuals and communities to improve their own healthand well being.195
8.6 THE PREVENTION ROLE OF THE ACUTE SECTORBACKGROUNDHospitals are places where secondary care, either planned or emergency, isdelivered. The role of a hospital in prevention is not often considered. There is aninternational movement of „health promoting hospitals‟ around the world that hasgenerated some excellent models of good practice, working with departments insidethe hospital and a wide range of partners inside and outside the hospital to improvehealth and prevent readmissions.Hospitals and health services may be sources of inequalities themselves if they don‟tadapt their own functioning and services to the specific needs of different staff,patient and community groups. However they have the potential to mitigate some ofthe negative health effects caused elsewhere by reducing thresholds to care and byoffering health education to improve the health literacy of disadvantaged groups.They also have the potential to act as advocates <strong>for</strong> their patients and mediatechange amongst partner agencies by engaging in partnerships to improve health.Since the health sector is one of the largest employers in the borough they can alsocontribute to reducing health inequalities through employment opportunities andpromoting the health and well being of all their staff.Many doctors focus on treating the symptoms of ill health they are presented withand are not making the connections necessary to have an impact on reducing theinequalities gap. The immediate causes of the social gradient in ill health, such assmoking, obesity and alcohol misuse are either overlooked by clinicians or left in thebelief that they will be picked up by public health professionals. There is goodevidence that brief advice delivered by a clinician can have an impact on healthbehaviour and those patients attending GP surgeries or hospital appointments areparticularly receptive to such advice.CURRENT POSITIONThe NST report identified that the NHS Foundation Trust could play a bigger role inreducing health inequalities in <strong>Dudley</strong> and should take a more proactive role inleadership and partnership in this agenda. Since the visit there has been a change inmanagement at <strong>Dudley</strong> Group of Hospitals (DGoH) and this has resulted in moreinvolvement in key partnership and strategic groups and of most relevance here, the<strong>Health</strong> Improvement and Modernisation Management Team (HIMMT) and the <strong>Health</strong>and Wellbeing Partnership Board.DGoH is already offering quit smoking support through a „stop be<strong>for</strong>e the op‟programme and also support to quit smoking <strong>for</strong> pregnant women. There areopportunities to take this approach further by offering identification and brief advice<strong>for</strong> both tobacco and alcohol consumption through CQUIN targets being developed<strong>for</strong> 2011.Currently negotiations are taking place to enable the acute trust to become theprovider of some community services. This will provide a unique opportunity todevelop the public health role of its staff and provide robust links with the community196
which it has never done be<strong>for</strong>e. There are also opportunities to work more closelywith Primary Care since GPs will become the main commissioners of secondary carewhen „Liberating the NHS‟ is implemented. Although responsibility <strong>for</strong> ensuringreducing health inequalities will fall to the Local Authority, it will also be acommissioning responsibility <strong>for</strong> the new GP Cluster Boards.197
9. KEY RECOMMENDATIONSThe recommendations below have been chosen as the high priority actions that needto be addressed by a range of partners if we are to tackle the gap in healthinequalities in <strong>Dudley</strong>. They reflect the strategic aims of the strategy and provide anindication of the timescale and outcomes that will be achieved. Theserecommendations are also reflected in a high level action plan which will beimplemented and reported against by the nominated lead agency. A high levelper<strong>for</strong>mance monitoring framework has been developed to show progress againstsome of the key indicators used to measure health inequalities.The detailed delivery plans <strong>for</strong> the key priority disease areas can be found in theappendices. These have been selected <strong>for</strong> action as having the greatest impact onreducing health inequalities in <strong>Dudley</strong> and they can be found as action plans inAppendix 2 on page 219..LEADERSHIP AND PARTNERSHIP1. Strengthen leadership <strong>for</strong> health improvement and health inequalities acrossthe partnership and particularly within the Local Authority, <strong>Dudley</strong> and WalsallMental <strong>Health</strong> Partnership Trust and Acute Trust and ensure the involvementof GP Commissioning Consortia when they become established. This will beachieved through the establishment of a new <strong>Health</strong> and Wellbeing Board.GIVE EVERY CHILD THE BEST START IN LIFE2. Improve data systems across health and <strong>Dudley</strong> MBC to allow extraction ofpopulation level analyses of developmental progress of children under 5 in<strong>Dudley</strong>3. Develop further the existing parenting programme databases to reportethnicity on fidelity to programmes and outcomes of interventions in eligiblegroups.4. Consider investment profile in early years, school and adolescent programmesto examine <strong>for</strong> any scope <strong>for</strong> disinvestment and re-investment in evidencebasedearly years programmes.5. Channel any resources released from other areas of child health investmentinto the introduction of a Family <strong>Health</strong> Partnership programme with definedeligibility criteria and clear means of auditing outcomes.6. Continue implementation of <strong>Dudley</strong>‟s Parenting and Family Learning <strong>Strategy</strong>,with full tracking of adherence to eligibility criteria and outcomes <strong>for</strong> <strong>for</strong>malparenting programmes.7. Develop more <strong>for</strong>mal integrated working between the <strong>Dudley</strong> CommunityServices <strong>Health</strong> Visiting Service, the <strong>Dudley</strong> Group of Hospitals midwiferyservice and children‟s centres in <strong>Dudley</strong>, particularly between children‟s198
centres‟ outreach workers and <strong>Health</strong> Visitors.8. All statutory agencies to ensure policies <strong>for</strong> paid parental leave are in placeand DMBC/partners economic regeneration initiatives to promote this withemployers.9. <strong>Dudley</strong>‟s action Plan to reduce inequality in infant mortality to be implementedin full.10. Retain the high priority placed on Quality Assurance of childcare provision in<strong>Dudley</strong>.CREATE FAIR EMPLOYMENT AND GOOD WORK FOR ALL11. Ensure that data systems <strong>for</strong> tracking the impact of economic strategyinitiatives use a consistent approach to assessment across the social gradient.12. Ensure that public and private sector employers adhere to equality guidanceand legislation.13. Develop means of implementing guidance on stress management and theeffective promotion of wellbeing and physical and mental health at work, both<strong>for</strong> public sector and private sector employees.14. Consider the potential <strong>for</strong> incentivising employers to adapt jobs to providesuitable employment <strong>for</strong> lone parents, carers and people with physical mentalhealth problems.<strong>15</strong>. Ensure that <strong>Dudley</strong> participates to the maximum in any available wellevidenced active labour market programmesENSURE A HEALTHY STANDARD OF LIVING FOR ALL16. All public service agencies in <strong>Dudley</strong> should to encourage those eligible andentitled to benefit to claim it.17. Implement <strong>Dudley</strong>‟s Child and Family Poverty Reduction <strong>Strategy</strong>.199
CREATE AND DEVELOP HEALTHY AND SUSTAINABLE PLACES ANDCOMMUNITIES18. Implement <strong>Dudley</strong>‟s Climate Change Action Plans.19. Increase opportunities <strong>for</strong> active travel across the social gradient.20. Maintain access and quality of open and green spaces across the socialgradient21. Continue to improve the energy efficiency of housing and reducing fuel povertySTRENGTHEN THE ROLE AND IMPACT OF ILL HEALTH PREVENTION22. Implement the high level interventions that are known to have the greatestimpact on reducing premature mortality <strong>for</strong> those diseases that contribute mostto the inequalities gap. (The high level actions from the disease specific areasare to be found in 9.1 page 201)ENGAGING AND EMPOWERING COMMUNITIES23. Simplify and streamline neighbourhood engagement structures to avoidduplication and gain maximum benefit from the processes already in place.24. Use the Five Element Model (Smithies, J. <strong>2010</strong>) proposed by the NationalSupport Team to take a more strategic approach to community healthimprovement in the most deprived areas of the borough.25. Increase the mechanisms whereby increasing numbers of local people canparticipate in meaningful engagement and have a greater say and influenceover local resources and programmes that impact on health inequalities.200
9.1 DUDLEY HEALTH INEQUALITIES HIGH LEVEL ACTION PLAN <strong>2010</strong>/11-2014/<strong>15</strong>RECOMMENDATION ACTIVITY OUTCOMES LEAD TIMESCALELEADERSHIPPARTNERSHIPAND1. Strengthen leadership <strong>for</strong> healthimprovement and healthinequalities across thepartnership and particularlywithin the Local Authority,<strong>Dudley</strong> and Walsall Mental<strong>Health</strong> Partnership Trust andAcute Trust and ensure theinvolvement of GPCommissioning Consortia whenthey become established.Establish a new <strong>Health</strong> andWellbeing Board in line with newstatutory guidelinesStrong cross-agency leadership<strong>for</strong> health inequalities which willensure a high priority <strong>for</strong> joinedup strategy and actions.<strong>Dudley</strong> MBC April 2012GIVE EVERY CHILD THE BESTSTART IN LIFE2. Improve data systems acrosshealth and <strong>Dudley</strong> MBC to allowextraction of population levelanalyses of developmentalprogress of children under 5 in<strong>Dudley</strong>Develop scope <strong>for</strong> review ofsystems to establish data itemavailabilityImproved intelligence on thedevelopmental progress of theunder 5 population in <strong>Dudley</strong> toconfirm JSNA to track outcomesimprovement and action specificcorrective intervention that maybe needed.<strong>Dudley</strong> Public<strong>Health</strong> (PCT)/DMBC Children‟sDirectorateSeptember 2011Consider and agree acrossagencies a small number of validmeasures to assess children‟sphysical, social, emotional andcognitive development at aFebruary 2012201
RECOMMENDATION ACTIVITY OUTCOMES LEAD TIMESCALEpopulation level.Review data item availability incurrent routine systems and identifymeans of/barriers to extraction.May 2012Consider whether any new datacollection may be required (biasagainst instituting collection unlessabsolutely necessary).May 2012Develop system reporting outputsrequired to report on agreedmeasures. report on agreedmeasuresImplement and test reports on apilot basis.July 2012Dec 2012Review learning from pilots.July 2013Agree continued reports and set uproutine surveillance reporting.November 20133. Develop further the existingdatabases to report to <strong>for</strong>malparenting programmes onfidelity to programmes andoutcomes of interventions ineligible groups.Produce Annual Report on each<strong>for</strong>mal manual-based parentingprogramme presenting data whichgives assurance on fidelity toprogramme; completion rates; andoutcomes achieved.Improved health outcomes <strong>for</strong>identified vulnerable groups<strong>Dudley</strong> Public<strong>Health</strong>(PCT/DMBCChildren‟sDirectorate)First reportproduced <strong>for</strong>Year 10 byDecember 2011and annuallythereafterProduce annual audits <strong>for</strong> eachuniversal element of the <strong>Health</strong>yChild Programme.Audits <strong>for</strong> 10-11by December2011 andannuallythereafter202
RECOMMENDATION ACTIVITY OUTCOMES LEAD TIMESCALE4. Consider investment profile inearly years, school andadolescent programmes toexamine <strong>for</strong> any scope <strong>for</strong>disinvestment and re-investmentin evidence-based early yearsprogrammes.Undertake a review of currentspending across the children‟sservices directorate of the MBC andPCTConsider redirection of anyidentified savings to early yearsImproved health outcomes <strong>for</strong> allchildrenMBC lead/PCT/Children‟sServicesSeptember 201<strong>15</strong>. Channel any resources releasedfrom other areas of child healthinvestment into the introductionof a Family Nurse Partnershipprogramme with definedeligibility criteria and clearmeans of auditing outcomes.Resource and introduce a FamilyNurse Partnership programmeEligibility criteria to cover the mostvulnerable families to receive theadditional supportImproves the health outcomes ofthe most vulnerable children<strong>Dudley</strong> PCTApril 20126. Continue implementation of<strong>Dudley</strong>‟s Parenting and FamilyLearning <strong>Strategy</strong>, with fulltracking of adherence toeligibility criteria and outcomes<strong>for</strong> <strong>for</strong>mal parentingprogrammes.Ensure the Parenting and FamilyLearning <strong>Strategy</strong> is fullyimplemented, targeted at thefamilies who will benefit most andassess the outcomes. Produce anannual monitoring report on thestrategy and outcomes achieved.Improves the health outcomes ofthe most vulnerable children<strong>Dudley</strong> MBCChildren‟sDirectorateReport on 10-11by December2011 at latest.Annuallythereafter.7. Develop more <strong>for</strong>mal integratedworking between the <strong>Dudley</strong>Community Services <strong>Health</strong>Visiting Service, the <strong>Dudley</strong>Group of Hospitals midwiferyservice and children‟s centres in<strong>Dudley</strong>, particularly betweenchildren‟s centres‟ outreachworkers and <strong>Health</strong> Visitors.Review care pathways and referralmechanisms to ensure seamlessservice provision across andbetween all agenciesImproves the health outcomes ofthe most vulnerable childrenDCS/DGH/CCMarch 2012203
RECOMMENDATION ACTIVITY OUTCOMES LEAD TIMESCALE8. All statutory agencies to ensurepolicies <strong>for</strong> paid parental leaveare in place and DMBC/partnerseconomic regeneration initiativesto promote this with employers.All agencies to review policies onparental leave are in place and aresupported by workplace initiativesImproves the health outcomes ofthe most vulnerable childrenAll statutoryagenciesMarch 20129. <strong>Dudley</strong>‟s Action Plan to reduceinequality in infant mortality to beimplemented in full.Infant mortality plan progress to bemonitored by the <strong>Dudley</strong> Children‟sTrust „Narrowing the Gap‟ groupand successor partnershiparrangements. Annual Report onprogress.Reduction in infant mortality<strong>Dudley</strong> Children‟sTrustMarch 201310. Retain the high priority placed onQuality Assurance of childcareprovision in <strong>Dudley</strong>.Quality standards to be monitoredby the <strong>Health</strong> and Wellbeing BoardImproved health outcomes <strong>for</strong> allchildren<strong>Health</strong> andWellbeing BoardMarch 20<strong>15</strong>CREATE FAIR EMPLOYMENT ANDGOOD WORK FOR ALL11. Ensure that data systems <strong>for</strong>tracking the impact of economicstrategy initiatives use aconsistent approach toassessment across the socialgradient.Agree a per<strong>for</strong>mance framework <strong>for</strong>assessing the impact of economicinitiatives across all socio-economicgroupsEconomic decisions should notimpact unfairly on the mostdeprived groupsMBC lead/DUEMarch 201312. Ensure that public and privatesector employers adhere toequality guidance and legislation.<strong>Health</strong> and Wellbeing Board toreceive assurance that all statutoryagencies and all contractedproviders have processes in placeto adhere to equality guidance andlegislationWork practices should not impactunfairly on vulnerable groupsAll agenciesMarch 2012204
RECOMMENDATION ACTIVITY OUTCOMES LEAD TIMESCALE13. Develop means of implementingguidance on stress managementand the effective promotion ofwellbeing and physical andmental health at work, both <strong>for</strong>public sector and private sectoremployees.The joint health and wellbeing atwork group to take a co-ordinatedapproach to implementing a proactiveapproach to reducing andmanaging stress in the workplaceand providing an expert resource<strong>for</strong> private sector employeesWork practices should not impactunfairly on vulnerable groupsJoint health andwellbeing at workgroupMarch 201314. Consider the potential <strong>for</strong>incentivising employers to adaptjobs to provide suitableemployment <strong>for</strong> lone parents,carers and people with physicalmental health problems.The health at work group toexamine the potential <strong>for</strong>incentivising employers to adaptjobs <strong>for</strong> vulnerable groupsReducing health inequalities byimproving economic opportunities<strong>for</strong> disadvantaged groupsAll agenciesMarch 2013<strong>15</strong>. Ensure that <strong>Dudley</strong> participatesto the maximum in any availablewell evidenced active labourmarket programmesThe health at work group to activelyseek out opportunities to participatein well evidenced labour marketopportunities and advise partners ofthese opportunitiesReducing health inequalities byimproving economic opportunities<strong>for</strong> disadvantaged groupsAll agenciesMarch 2013ENSURE A HEALTHYSTANDARD OF LIVING FORALL16. All public service agencies in<strong>Dudley</strong> should endeavour toencourage those eligible andentitled to benefit to claim it.Provide frontline staff within<strong>for</strong>mation on how to signpost theirclients to benefits supportAn increase in the numbers ofpeople receiving the financialsupport they are entitled toMBC leadAll agenciesMarch 201217. Implement <strong>Dudley</strong>‟s Child andFamily Poverty Reduction<strong>Strategy</strong>.<strong>Health</strong> and Wellbeing Board toreceive an annual progress reporton the implementation of thestrategyFewer children growing up inpovertyMBCMarch 20<strong>15</strong>205
RECOMMENDATION ACTIVITY OUTCOMES LEAD TIMESCALECREATE AND DEVELOPHEALTHY AND SUSTAINABLEPALCES AND COMMUNITIES18. Implement <strong>Dudley</strong>‟s ClimateChange Action Plans.The <strong>Health</strong> and Wellbeing Board toreceive an annual progress reporton the implementation of thestrategyClimate change plans should notimpact unfairly on the mostvulnerableMBC leadAll agenciesMarch 20<strong>15</strong>19. Increase opportunities <strong>for</strong> activetravel across the social gradient.Ensure active travel plans includepositive access <strong>for</strong> vulnerablegroupsAll residents of <strong>Dudley</strong> should beable to benefit from active travelMBCMarch 20<strong>15</strong>20. Maintain access and quality ofopen and green spaces acrossthe social gradientNew plans should include open andgreen spaces as an essentialconsiderationMore residents able to enjoygreen spacesMBCMarch 20<strong>15</strong>21. Continue to improve the energyefficiency of housing andreducing fuel povertySTRENGTHEN THE ROLE ANDIMPACT OF ILL HEALTHPREVENTIONReview the future of <strong>Health</strong>Through Warmth/Warm Frontprogrammes to make sure the mostvulnerable benefit from energyefficiency improvementsA reduction in the number ofpeople living in fuel poverty andun-insulated homesMBCMarch 201222. Implement the high levelinterventions that are known tohave the greatest impact onreducing premature mortality <strong>for</strong>those diseases that contributemost to the inequalities gap.(The high level actions from thedisease specific areas are to befound in 9.1 Page 201)All the Chairs of the LITs to takeresponsibility <strong>for</strong> delivery andmonitoring of the relevant <strong>Health</strong><strong>Inequalities</strong> delivery plans andproducing an annual report onprogress <strong>for</strong> the <strong>Health</strong> andWellbeing BoardA reduction in premature mortalityfrom the biggest contributors tohealth inequalities<strong>Health</strong> services(DGH/DCS/Primary Care/Independentproviders)March 20<strong>15</strong>206
RECOMMENDATION ACTIVITY OUTCOMES LEAD TIMESCALEENGAGING AND EMPOWERINGCOMMUNITIES23. Simplify and streamlineneighbourhood engagementstructures to avoid duplication andgain maximum benefit from theprocesses already in place.Undertake a review of theneighbourhood engagementstructures with a view to simplifyingcurrent structuresMore people engaged inmeaningful consultationMBCMarch 201224. Use the Five Element Model(Smithies, J. <strong>2010</strong>) proposed by theNational Support Team to take amore strategic approach tocommunity health improvement inthe most deprived areas of theborough.25. Increase the mechanismswhereby increasing numbers of localpeople can participate in meaningfulengagement and have a greater sayand influence over local resourcesand programmes that impact onhealth inequalities.Implement the Five Element modelfrom In It TogetherEnsure local decision makingprocedures are inclusive of allresidentsVulnerable groups are positivelyengaged in decisions that directlyaffect themMore people engaged inmeaningful consultation andempowered to contribute to realchange in their communitiesPublic <strong>Health</strong> andpartnersMBCMarch 2013March 2013207
REFERENCESAcheson, D. (1998) Independent Inquiry into <strong>Inequalities</strong> in <strong>Health</strong>. London: TheStationery Office.All Party Parliamentary Group (<strong>2010</strong>) All Party Parliamentary Group on Smoking and<strong>Health</strong> Inquiry into the effectiveness and cost-effectiveness of tobacco control.[online] Available at: http://www.ash.org.uk/files/documents/ASH_743.pdf (Accessed:April <strong>2010</strong>)Atri, J. (2006) Cardiac Catheterisation and Interventional Procedures <strong>for</strong> CHD.Investigation of equity of access. <strong>Dudley</strong>: <strong>Dudley</strong> PCTBirdi, A., Gaddu, U. and Jackson, K. (2006) <strong>Dudley</strong> Mental <strong>Health</strong> Promotion Plan2006-2009: Priorities <strong>for</strong> Action in <strong>Dudley</strong>. <strong>Dudley</strong>: Public <strong>Health</strong> Directorate. <strong>Dudley</strong>Primary Care Trust.British Heart Foundation (2006) Factfile: Delays in Treatment <strong>for</strong> AMI. [online]Available at: http://www.bhf.org.uk/idoc.ashx?docid=228971aa-b199-4d5e-8f89-5ae55b5d299b&version=-1 (Accessed: May <strong>2010</strong>)Care Quality Commission (2009) Closing the gap. <strong>Tackling</strong> CVD & <strong>Health</strong><strong>Inequalities</strong> by prescribing statins and stop smoking services. [online] Available at:http://www.cqc.org.uk/_db/_documents/Closing_the_gap.pdf (Accessed: August<strong>2010</strong>)Care Services Improvement Partnership (2007) National Suicide Prevention <strong>Strategy</strong><strong>for</strong> England: Annual report on progress. Care Services Improvement Partnership &National Institute <strong>for</strong> Mental <strong>Health</strong> in England. London: Department of <strong>Health</strong>Central Office of In<strong>for</strong>mation (2009) Stroke Awareness Campaign Tracking. London:Central Office of In<strong>for</strong>mationCommunities and Local Government (2008) Communities in control. Real people,real power. [online] Available at:http://www.communities.gov.uk/documents/localgovernment/pdf/1366312.pdf(Accessed: April <strong>2010</strong>)Craig, R. and Mindell, J.(eds.) (2008) <strong>Health</strong> Survey <strong>for</strong> England 2006. London:National Centre <strong>for</strong> Social ResearchDavey C, Austoker J. and Macleod U. (1999) Reducing <strong>Inequalities</strong> in Breast Cancer– A guide <strong>for</strong> primary care. London: Cancer Research Campaign<strong>Dudley</strong> Children‟s Trust (2009) <strong>Dudley</strong> Parenting Support and Family Learning<strong>Strategy</strong>. <strong>Dudley</strong>: <strong>Dudley</strong> Children‟s Trust.208
<strong>Dudley</strong> Community Partnership (2005) <strong>Dudley</strong> Community <strong>Strategy</strong> 2005–2020 – the<strong>Dudley</strong> Borough Challenge. [online] Available at:http://www.dudleylsp.org/community-strategy-<strong>2010</strong>-2013/community-strategy-2005(Accessed: September <strong>2010</strong>)<strong>Dudley</strong> Community Partnership (2008) Next Generation Local Area Agreement2008/11. [online] Available at: http://www.dudleylsp.org/local-area-agreements/ourapproach-to-the-next-generation-laa(Accessed: September <strong>2010</strong>)<strong>Dudley</strong> Community Partnership. (<strong>2010</strong>) Local compact between the voluntary andcommunity sector agencies in <strong>Dudley</strong> borough. [online] Available at:http://www.dudleylsp.org/local-compact (Accessed: September <strong>2010</strong>)<strong>Dudley</strong> Community Partnership.(<strong>2010</strong>) In it together. An empowering approach tocommunity engagement. [online] Available at: http://www.dosti.org.uk/downloads(Accessed: September <strong>2010</strong>)<strong>Dudley</strong> Community Safety Partnership (<strong>2010</strong>) Alcohol <strong>Strategy</strong>. <strong>Dudley</strong>: <strong>Dudley</strong>Community Partnership<strong>Dudley</strong> Group of Hospitals (<strong>2010</strong>) In<strong>for</strong>mation Team Smoking & Pregnancy datareports. <strong>Dudley</strong>. <strong>Dudley</strong> Group of Hospitals.<strong>Dudley</strong> Metropolitan Borough Council (2009) Corporate Engagement Principles.[online] Available at: http://www.dudley.gov.uk/council--democracy/engagement/approach-to-engagement (Accessed: September <strong>2010</strong>)<strong>Dudley</strong> Metropolitan Borough Council and <strong>Dudley</strong> Primary Care Trust (2005) Closingthe Gap: <strong>Tackling</strong> <strong>Health</strong> <strong>Inequalities</strong> in <strong>Dudley</strong>. <strong>Dudley</strong>: <strong>Dudley</strong> MetropolitanBorough Council and <strong>Dudley</strong> Primary Care Trust.<strong>Dudley</strong> Metropolitan Borough Council and <strong>Dudley</strong> Primary Care Trust (2009) JointAccident Prevention <strong>Strategy</strong> <strong>for</strong> <strong>Dudley</strong> 2009-2012. [online] Available at:http://www.nhsdudley.nhs.uk/sections/publications/documents/FOI26846170759.pdf(Accessed : October <strong>2010</strong>)<strong>Dudley</strong> Primary Care Trust (2009a) Mortality Trends Chart Package Spreadsheets.Public <strong>Health</strong> Intelligence. Public <strong>Health</strong> Compendium 2007. [online] Available at:http://www.dudleylsp.org/easysite/public/searchresults.asp?page=1&action=Search&keywords=adult+mental+health&CategoryString=&CategoryList=&SearchItemD=81&strSerchType=All&pgid=57595 (Accessed: April <strong>2010</strong>)<strong>Dudley</strong> Primary Care Trust (2009b) <strong>Dudley</strong> <strong>Health</strong> Survey, Preliminary Findings.Public <strong>Health</strong> Intelligence. [online] Available at:http://www.nhsdudley.nhs.uk/sites/documents/cms/937-<strong>2010</strong>-8-18-5472652.pdf(Accessed: August <strong>2010</strong>)209
Eden B. and Davies A. (<strong>2010</strong>) Primary Care Cancer Audit. West Midlands. GreaterWest Midlands Cancer NetworkElliott, E., Landes, R., Popay, J. and Edmans, T. (2001) Regeneration and health: aselected review of research. Nuffield Institute <strong>for</strong> <strong>Health</strong>. University of Leeds. KingsFund, LondonFinch, G. (1995) Handling Children‟s Behaviour. London: NCH Action <strong>for</strong> ChildrenFisher, P.A. (2009) An Examination of the Association between Temperature andMortality in the West Midlands from 1981 to 2007. Unpublished MPH Thesis.University of Birmingham.Foresight Mental Capital and Wellbeing Project (2008). Final project report. London:The Government Office <strong>for</strong> ScienceFriedli, L. (2009) Mental health, resilience and inequalities. [online] Available at:http://www.euro.who.int/__data/assets/pdf_file/0012/100821/E92227.pdf (Accessed:August <strong>2010</strong>)Gordon-Dseagu, V. (2009) Cancer and health inequalities: an introduction to thecurrent evidence. London: Cancer Research CampaignGreat Britain. Department of <strong>Health</strong> (1999) National Service Framework <strong>for</strong> Mental<strong>Health</strong>: Modern Standards and Service Models. London: Department of <strong>Health</strong>Great Britain. Department of <strong>Health</strong> (1999) Saving Lives: Our <strong>Health</strong>ier Nation.London: The Stationery Office. (CM4386)Great Britain. Department of <strong>Health</strong> (2001) National Confidential Inquiry: Safety First.[online] Available at: http://www.doh.gov.uk/mentalhealth/safetyfirst (Accessed:August <strong>2010</strong>)Great Britain. Department of <strong>Health</strong> (2002) National Suicide Prevention <strong>Strategy</strong> <strong>for</strong>England. London: Department of <strong>Health</strong>.Great Britain. Department of <strong>Health</strong> (2003) <strong>Tackling</strong> <strong>Health</strong> <strong>Inequalities</strong>: Aprogramme <strong>for</strong> action. London: Department of <strong>Health</strong>. (CM6374)Great Britain. Department of <strong>Health</strong> (2004) Choosing <strong>Health</strong>: Making healthy choiceseasier. London: The Stationery Office. (CM6374)Great Britain. Department of <strong>Health</strong> (2004) Valuing People: Moving ForwardTogether - the Government‟s annual report on Learning Disabilities. London: TheStationery OfficeGreat Britain. Department of <strong>Health</strong> (2006) Strong and prosperous communities, TheLocal Government White Paper. London: Department of <strong>Health</strong>.210
Great Britain. Department of <strong>Health</strong> (2007a) National Stroke <strong>Strategy</strong>. London:Department of <strong>Health</strong>. [online] Available at:http://www.dh.gov.uk/en/Publicationsandstatistics/Publications/PublicationsPolicyAndGuidance/DH_081062 (Accessed: August <strong>2010</strong>)Great Britain. Department of <strong>Health</strong> (2007b) Cancer Re<strong>for</strong>m <strong>Strategy</strong>. London: NHSGreat Britain. Department of <strong>Health</strong> (2009a) <strong>Health</strong> Profile <strong>for</strong> England 2008. [online]Available at:http://www.dh.gov.uk/en/Publicationsandstatistics/Publications/PublicationsStatistics/DH_093465 (Accessed: April <strong>2010</strong>)Great Britain. Department of <strong>Health</strong> (2009b) <strong>Health</strong> of Population Indicator: NHSFeedback as at Q3 2009/10- Smoking At time of delivery. [online] Available at:http://www.dh.gov.uk/prod_consum_dh/groups/dh_digitalassets/@dh@en/documents/digitalasset/dh_106797.pdf (Accessed: April <strong>2010</strong>)Great Britain. Department of <strong>Health</strong> (2009c) New Horizons: Towards a shared vision<strong>for</strong> mental health. Consultation. London: Department of <strong>Health</strong>Great Britain. Department of <strong>Health</strong> (<strong>2010</strong>) Liberating the NHS. London: TheStationery Office. (CM7881)Great Britain. Department of <strong>Health</strong> (<strong>2010</strong>) <strong>Tackling</strong> <strong>Health</strong> <strong>Inequalities</strong> in lifeexpectancy in areas with the worst health and deprivation. London: National AuditOfficeGreat Britain. Department of <strong>Health</strong> (<strong>2010</strong>a) Tobacco Control <strong>Strategy</strong> <strong>for</strong> England -A Smokefree Future. London: Department of <strong>Health</strong>. [online] Available at:http://www.dh.gov.uk/en/Publicationsandstatistics/Publications/PublicationsPolicyAndGuidance/DH_111749 (Accessed: April <strong>2010</strong>)Great Britain. Department of <strong>Health</strong> (<strong>2010</strong>b) Consultation on a strategy <strong>for</strong> services<strong>for</strong> chronic Obstructive Pulmonary Disease (COPD) England. London: Department of<strong>Health</strong>Laflamme, L., Burrows, S. and Hasselberg, M. (2009) Socioeconomic differences ininjury risks. A review of the findings and a discussion of the countermeasures.Geneva: World <strong>Health</strong> Organisation. [online] Available at:http://www.euro.who.int/__data/assets/pdf_file/0012/111036/E91823.pdf(Accessed: August <strong>2010</strong>)Little, V. And Moss, A. (2009) Joint Strategic Needs Assessment of Heath &Wellbeing in <strong>Dudley</strong>. – an update <strong>for</strong> 2009. <strong>Dudley</strong>: NHS <strong>Dudley</strong>. [online] Availableat: http://www.dudleylsp.org/needs-assessments--data-and-trends/health-jsna/copyof-copy-of-jsna-documents-<strong>for</strong>-dudleyLondon <strong>Health</strong> Observatory (<strong>2010</strong>) <strong>Health</strong> <strong>Inequalities</strong> Intervention Tool. [online]Available at: http://www.lho.org.uk/NHII?LEGap.aspx?la=00CR&comp=3(Accessed: September <strong>2010</strong>)211
Marmot, M. (<strong>2010</strong>) Fair Society, <strong>Health</strong>y Lives: a strategic review of healthinequalities in England post-<strong>2010</strong> - Executive Summary. London: The MarmotReviewMay, E. (<strong>2010</strong>) <strong>Health</strong> effects of Climate Change in the West Midlands: SummaryReport. Birmingham: <strong>Health</strong> Protection Agency.MINAP (2009) Myocardial Ischaemia National Audit Project - How the NHS managesheart attacks. London: Royal College of PhysiciansMorse, A. (<strong>2010</strong>) <strong>Tackling</strong> inequalities in life expectancy in areas with the worsthealth and deprivation. [online] Available at:http://www.nao.org.uk/publications/1011/health_inequalities.aspx (Accessed: August<strong>2010</strong>)Moss, A. (<strong>2010</strong>) <strong>Health</strong> <strong>Inequalities</strong> Joint Needs Assessment – <strong>Dudley</strong>. <strong>Dudley</strong>: NHS<strong>Dudley</strong>.Murfin, Mitchell et. al. (<strong>2010</strong>) <strong>Health</strong> Trainer National Work<strong>for</strong>ce Audit 2009. London:Department of <strong>Health</strong>.National Institute <strong>for</strong> <strong>Health</strong> and Clinical Excellence (2006) Parent-training/educationprogrammes in the management of children with conduct disorders. TA102. London:National Institute <strong>for</strong> <strong>Health</strong> and Clinical Excellence.National Institute <strong>for</strong> <strong>Health</strong> and Clinical Excellence (2008a) Community engagementto improve health. CG9. [online] Available at:http://www.nice.org.uk/media/pdf/PH9quidance.pdf (Accessed: August <strong>2010</strong>)National Institute <strong>for</strong> <strong>Health</strong> and Clinical Excellence (2008b) Smoking cessationservices in primary care, pharmacies, local authorities and workplaces, particularly<strong>for</strong> manual working groups, pregnant women and hard to reach groups. CG10.[online] Available at: http://www.nice.org.uk/media/pdf/PH10quidance.pdf (Accessed:April <strong>2010</strong>)National Institute <strong>for</strong> Mental <strong>Health</strong> in England (2003) Preventing Suicide: A toolkit<strong>for</strong> Mental <strong>Health</strong> Services. Leeds: National Institute <strong>for</strong> Mental <strong>Health</strong> in England.National Mental <strong>Health</strong> Development Unit (<strong>2010</strong>) Mental well-being checklist.National Mental <strong>Health</strong> Development Unit. [online] Available at:http://www.nmhdu.org.uk/silo/files/mental-wellbeing-checklist-a4.pdf(Accessed: April <strong>2010</strong>)NHS <strong>Dudley</strong> (2009) Communications and Engagement <strong>Strategy</strong> 2009-2014.[online] Available at: http://pctnet.dudley.nhs.uk/documents/cms/601-<strong>2010</strong>-4-6-4997010.pdf (Accessed: September <strong>2010</strong>)212
NHS <strong>Dudley</strong> and <strong>Dudley</strong> Metropolitan Borough Council (2008) <strong>Dudley</strong> <strong>Health</strong> andSocial Care Commissioning Framework and <strong>Strategy</strong> 2008-13. <strong>Dudley</strong>: NHS <strong>Dudley</strong>and <strong>Dudley</strong> Metropolitan Borough CouncilNHS <strong>Dudley</strong> and <strong>Dudley</strong> Metropolitan Borough Council (2009) Reaching Excellence– A Primary Care <strong>Strategy</strong> <strong>for</strong> <strong>Dudley</strong> 2009-14. <strong>Dudley</strong>: NHS <strong>Dudley</strong> and <strong>Dudley</strong>Metropolitan Borough CouncilNHS <strong>Dudley</strong>. <strong>Dudley</strong> Ageing Well Website. [online] Available at:http://nhsdudley.nhs/sites/older-people (Accessed: September <strong>2010</strong>)NHS Yorkshire and the Humber (2008-09) Altogether Better Executive Summary.Leeds: NHS Yorkshire and the Humber. [online] Available at:http://www.altogetherbetter.org.uk (Accessed: July <strong>2010</strong>)O‟Hara, K. (2009) Approaches to Whole Population Suicide Prevention: Final Report.West Midlands: NHS West Midlands Regional Development Centre.Office <strong>for</strong> National Statistics (2006) „Trends in injury and poisoning mortality usingthe ICE on injury statistics matrix, England and Wales, 1979-2004, <strong>Health</strong> StatisticsQuarterly, 32‟ (winter), pp. 5-18.Office <strong>for</strong> National Statistics (<strong>2010</strong>) General Lifestyle Survey, Smoking and Drinkingamong adults, 2008. [online] Available at: http://www.statistics.gov.uk/ghs/(Accessed: April <strong>2010</strong>)Pendry, L,. Roberts, D. and Walker, S. (2009) Corporate Community EngagementToolkit. <strong>Dudley</strong>: <strong>Dudley</strong> Metropolitan Borough Council.Pendry, L., Prescott, L. and Pritchard, J. (<strong>2010</strong>) The <strong>Dudley</strong> Community PartnershipInteractive Comprehensive Community Engagement <strong>Strategy</strong>. <strong>Dudley</strong>: <strong>Dudley</strong>Community Partnership.Royal College of Physicians (2000) Nicotine Addiction in Britain. A report of theTobacco Advisory Group of the Royal College of Physicians. London: Royal Collegeof Physicians.Royal College of Psychiatrists (<strong>2010</strong>) No health without public mental health: thecase <strong>for</strong> action PS24/<strong>2010</strong>. [online] Available at:http://www.rcpsych.ac.uk/pdf/Position%20Statement%204%20website.pdf(Accessed: April <strong>2010</strong>)Smithies, J. (<strong>2010</strong>) How to develop and implement a strategic framework <strong>for</strong>community engagement to support achievement of health and social care goals: the„Five Elements‟ model. London: Department of <strong>Health</strong>.South, J. (2009) People in Public <strong>Health</strong>. Leeds: Leeds Metropolitan University.213
The Stroke Association (2007) NOP Survey. [online] Available at:http://www:stroke.org.uk/media_centre/press_releases/older_people.html(Accessed: August <strong>2010</strong>)Thompson, E. and Gaddu, U. (2004) Taking Positive Steps In <strong>Dudley</strong>: Local SuicidePrevention and Reduction Action Plan 2004 – <strong>2010</strong>. <strong>Dudley</strong>: <strong>Dudley</strong> South PrimaryCare Trust, <strong>Dudley</strong> Beacon and Castle Primary Care Trust and <strong>Dudley</strong> MetropolitanBorough Council.University College London. (2009) Public awareness of cancer in Britain - Report <strong>for</strong>the National Awareness and Early Diagnosis Initiative. London: Department of<strong>Health</strong>.Wanless, D. (2002) Securing our Future <strong>Health</strong>: Taking a Long-Term View. [online]Available at: http://www.hm-treasury.gov.uk/wanless (Accessed: September <strong>2010</strong>)214
APPENDIX 1 - PERFORMANCE INDICATORSIndicator <strong>Dudley</strong> EnglandAverageLocal Economy and EmploymentIncome Support claimant rate (total claimants as percent of age 16 – 59/64(female/male)) (ONS Claimant Count NOMIS, May 2009)Job seekers allowance (% of working age population) (ONS ClaimantCount NOMIS, May 2009)Community CohesionPrimary Pupils who feel they are bullied due to colour, race or religion(<strong>Dudley</strong> <strong>Health</strong> Behaviour Survey, <strong>2010</strong>)Secondary Pupils who feel they are bullied due to colour, race or religion(<strong>Dudley</strong> <strong>Health</strong> Behaviour Survey, <strong>2010</strong>)Personal WellbeingChild wellbeing - % of LSOAs ranked in the bottom 20% nationally (Childwellbeing index 2009)Community SafetyBCS Comparator crimes per 1,000 population (<strong>Dudley</strong> Community SafetyPartnership, <strong>2010</strong>)Violence against the person offences per 1,000 population (<strong>Dudley</strong>Community Safety Partnership, <strong>2010</strong>)Skills% achieving 5 GCSEs graded A* to C (2008/09)(www.neighbourhood.statistics.gov.uk)SmokingSecondary school Smoking prevalence – current smoker (<strong>Dudley</strong> <strong>Health</strong>LeastDeprivedMostDeprivedExternal Internal InequalityInequalityGradient Value Gradient Value5.3% 4.0% 0.92% 10.92% 1.33* 1.3% 11.9* 10.0%5.6% 3.1% 2.5% 9.1% 1.8* 2.5% 3.6* 6.6%7.7% NA 4.2% 12.6% NA NA 3.00* -8.4%5.9% NA 4.6% 7.0% NA NA 1.52 -3.4%17.8% 20.0% 0.0% 83.3% 0.89* 2.2% 4.99+* 83.3%34.3 NA 16.5 55.6 NA NA 3.4* 39.16.0 NA 1.9 11.3 NA NA 5.9* 9.467.1% 69.8% 100.0% 52.6% 1.04 2.7% 1.90* -47.4%12.5% NA 9.1% 12.3% NA NA 1.35 3.3%Behaviour Survey, <strong>2010</strong>)Diet and NutritionBreastfeeding rate at initiation (<strong>Dudley</strong> Child <strong>Health</strong> System, 2009/10) 47.2% 72.7% 60.1% 38.4% 1.54* -25.5% 1.57* -21.7%Breastfeeding rate at 6-8 weeks (<strong>Dudley</strong> Child <strong>Health</strong> System, 2009/10) 26.2% 45.2% 40.2% 20.6% 1.73* -19.0% 1.95* -19.6%% Primary pupils eating five portions fruit and vegetables per day (<strong>Dudley</strong> 24.5% NA 27.2% 22.9% NA NA 1.19 -4.3%<strong>Health</strong> Behaviour Survey, <strong>2010</strong>)% secondary pupils eating five portions fruit and vegetables per day <strong>15</strong>.3% NA 19.1% 14.1% NA NA 1.35* -5.0%(<strong>Dudley</strong> <strong>Health</strong> Behaviour Survey, <strong>2010</strong>)Obesity% Reception children very overweight (NCMP, 2008/09) 9.0% 9.6% 3.6% 12.2% 0.94 -0.6% 3.39* 8.6%% Year 6 children very overweight (NCMP, 2008/09) 20.8% 18.3% 14.8% 23.5% 1.14* 2.5% 1.59* 8.7%2<strong>15</strong>
Indicator <strong>Dudley</strong> EnglandAverageAlcoholAlcohol related hospital admissions (standardized rate per 100,000population) 2004-2008 (SUS))LeastDeprivedMostDeprivedExternal Internal InequalityInequalityGradient Value Gradient Value1390 NA 1107 1707 NA NA 1.54* 600Life Expectancy and MortalityMale Life Expectancy 2005-2009 (Years) 77.4 77.7 81.4 72.3 1.00 -0.3 1.13* -9.1Female Life Expectancy 2005-2009 (Years) 81.9 81.8 85.0 79.0 1.00 0.1 1.08* -6.0Mortality from all causes persons (DSR per 100,000 population) (2004-2008)Premature mortality from all causes persons (DSR per 100,000population) (2004-2008)Child (
Indicator <strong>Dudley</strong> England Least Most External Internal InequalityAverage Deprived Deprived InequalityGradient Value Gradient ValuePremature mortality from prostate cancer males (DSR per 100,00010.0 8.8 11.5 8.9 1.14 1.2 0.77 -2.6population) (2004-2008)Incidence of Colorectal cancer persons (DSR per 100,000 population)50 45 43 57 1.11 5 1.33* 14(2004-2008)Premature mortality from Colorectal cancer persons (DSR per 100,000 10.9 10.6 11.2 14.1 1.03 0.3 1.26* 2.9population) (2004-2008)Respiratory DiseasePremature mortality from all respiratory diseases persons (DSR per31.8 25.6 12.3 54.4 1.24* 6.2 4.42* 42.1100,000 population) (2004-2008)Premature mortality from COPD persons (DSR per 100,000 population) 14.4 12.3 2.5 30.7 1.17* 2.1 12.28* 28.2(2004-2008)Chronic Liver DiseasePremature mortality from chronic liver disease persons (DSR per 100,000 13.0 10.1 6.6 28.5 1.29* 2.9 4.32* 21.9population) (2004-2008)Accidental InjuryMortality from accidents persons (DSR per 100,000 population) (2004- <strong>15</strong>.5 16.0 14.3 <strong>15</strong>.8 0.97 -0.5 1.10* 1.52008)Premature mortality from accidents persons (DSR per 100,000 population) 9.4 11.4 6.6 9.9 0.82 -2.0 1.50* 3.3(2004-2008)Hospital admissions from accidents persons (DSR per 100,000808 NA 6<strong>15</strong> 1011 NA NA 1.64* 396population) (2004-2008)SuicideMortality from suicide and undetermined injury persons (DSR per 100,000 7.1 8.1 4.8 10.1 0.88 -1.0 2.10* 5.3population) (2004-2008)Premature mortality from suicide and undetermined injury persons (DSR 6.9 8.1 4.4 10.5 0.85 -1.2 2.39* 6.1per 100,000 population) (2004-2008)Hospital admissions from suicide and undetermined injury persons (DSR 145 NA 58 248 NA NA 4.28* 190per 100,000 population) (2004-2008)DiabetesPremature mortality from diabetes persons (DSR per 100,000 population) 3.4 3.0 1.3 5.1 1.13* 0.4 3.92* 3.8(2004-2008)Alcohol Related HarmPremature mortality from alcohol related harm persons (DSR per 100,000 14.3 11.6 6.6 30.7 1.23* 2.7 4.65* 24.1population) (2004-2008)Hospital admissions from alcohol related harm persons (DSR per 100,000 1631 NA 1107 1707 NA NA 1.54* 600population) (2004-2008)Excess Winter Deaths217
Indicator <strong>Dudley</strong> England Least Most External Internal InequalityAverage Deprived Deprived InequalityGradient Value Gradient ValueExcess winter deaths index (2002/03-2006/07) 20.9% NA 25.2% 19.1% NA NA 0.76 -6.1%Emergency Hospital AdmissionsEmergency hospital admissions from CVD persons (DSR per 100,000 732 NA 546 969 NA NA 1.77* 423population) (2004/05-2008/09)Emergency hospital admissions from Cancer persons (DSR per 100,000 255 NA 220 295 NA NA 1.34* 75population) (2004/05-2008/09)Emergency hospital admissions from COPD persons (DSR per 100,000 131 NA 52.3 243.7 NA NA 4.66* 191.4population) (2004/05-2008/09)Emergency hospital admissions from Asthma persons (DSR per 100,000 101.5 NA 47.2 <strong>15</strong>0.0 NA NA 3.18* 102.8population) (2004/05-2008/09)Emergency hospital admissions from Diabetes mellitus persons (DSR per 53.1 NA 44.3 75.6 NA NA 1.71* 31.3100,000 population) (2004/05-2008/09)Emergency hospital admissions from Depression persons (DSR per42.2 NA 23.8 63.2 NA NA 2.66* 39.4100,000 population) (2004/05-2008/09)Uptake of Services3 Year Breast screening uptake (%) (2008/09) 72.2% 80.0% 77.9% 63.6% 1.11 -7.8% 1.22* -14.3%5 Year Cervical screening uptake (%) (2008/09) 80.4% 80.0% 86.2% 73.6% 1.00 0.4% 1.17* -12.6%2 Year Bowel screening uptake (%) (2008/09) 55.1% 60.0% 64.6% 43.7% 1.09 -4.9% 1.48* -20.9%Childhood vaccinations uptake uptake (%) (Quarter 2 <strong>2010</strong>/2011) 92.6% 95.0% 97.4% 91.9% 1.03 -2.4% 1.06 -5.5%218
APPENDIX 2 – DELIVERY PLANS FOR PRIORITY ACTIONSPRIORITY AREA: CVD SECONDARY PREVENTION IN THE PRIMARY CARE SETTING DELIVERY PLANRECOMMENDATION ACTIVITY OUTCOMES LEAD TIMESCALEImprove variation in per<strong>for</strong>manceacross practices <strong>for</strong> treatment,access and outcomes- ensuringoptimum use of vascular diseaseregisters to manage chronicdiseaseReduce the gaps between actualand expected prevalence <strong>for</strong> thekey vascular diseasesPrimary care services shouldbuild health equity assessmentinto routine auditIncrease referrals to & outcomesfrom Lifestyle Risk ManagementServicesQOF indicators <strong>for</strong> blood pressure,cholesterol and blood sugar management,and cardio-protective prescribing to beinvestigated <strong>for</strong> practice outliers,– startingwith blood pressureDevelop and implement a self-carestrategyImplementation of NHS health checksprogramme ensuring high uptake frommen, BME communities, deprived areasInvestigate practice outliers with lowlevels of prevalence <strong>for</strong> CHD and strokeregistersInclude in primary care and communityservice contractsImplementation of IBA ( identification,brief advice and referral) <strong>for</strong> lifestyleissuesImprove Stop Smoking Service outcomes<strong>for</strong> people from deprived areas - viatargeted stop smoking clinicsImproved management ofvascular long-term conditionsImproved health outcomes <strong>for</strong>people with long term conditionsReduction in CVDReduction in CVDImproved management ofvascular long-term conditionsEquity considered as part ofservice deliveryIncrease in numbers receivingearly interventions contributing toa reduction in mortality fromsmoking and alcohol relatedcausesReduction in smoking prevalencePublic <strong>Health</strong>Shelagh ClearyPublic <strong>Health</strong>Diane McNultyPublic <strong>Health</strong>Karen JacksonPublic <strong>Health</strong>Shelagh ClearyPrimary Care &communityCommissioning/ContractingPublic <strong>Health</strong>DMcNulty/KJacksonPublic <strong>Health</strong>Ruth OldingMarch 2011March 2011March 2013March 2011March 2012March 2012March 2011219
PRIORITY AREA: ACUTE CHD, STROKE AND TIA DELIVERY PLANRECOMMENDATION ACTION OUTCOMES LEAD TIMESCALERaise public awareness ofthe symptoms of heartattack and action to betakenConsolidation ofdiagnostics and treatmentservices <strong>for</strong> acute MIIntroduce public awareness campaigns with a targetedapproach to - over 65s, BME, women and deprived areas.Incorporate awareness <strong>for</strong> health care professionals toadvise patients with, or at high risk of, vascular disease tocall 999 should they experience unexplained chest paininto existing training programmesContinue to embed delivery of expanded services <strong>for</strong>acute MI diagnostics and revascularisation and review theequity of provision in a further 5 years time.Reduction in CHDmortalityImprovement in equity ofaccess <strong>for</strong>revascularisationImprovement in equity ofaccess <strong>for</strong>revascularisationCHD LIT/BCCN/patientsupportgroupsMarch 2012BCCN/PH March 20<strong>15</strong>Investigate demographicdifferences in referrals tocardiac rehabilitationImplement Stroke/TIAaction planRepeat the cardiac rehabilitation equity audit with largernumbers to establish a fuller picture and implementrecommendations made from this. This should include areview of DNAs and DNRs <strong>for</strong> cardiac rehabilitation andthe establishment of routine procedures to follow-up thesegroups.Continue implementation of current stroke/TIAworkstreams to increase speed of access to diagnosticsand treatment to meet the accelerating strokeimprovement programme targetsIncreased uptake ofcardiac rehabilitationAchievement ofaccelerated stroke caretargetsRT/BCCN March 2011STIG March 2012Raise public awareness ofF.A.S.TReview practice variationsin patients accessingstroke/TIA pathwaysReview equity of future provision <strong>for</strong> any target areaswhich remain significantly below targetContinue FAST awareness programmes with an emphasison segmentation and use of social marketing to ensurethe message reaches all communities, to include targetedcampaigns <strong>for</strong> BME & over 65sReview GP practice per<strong>for</strong>mance <strong>for</strong> outlying practices inrelation to admissions dataAudit GP TIA referral data <strong>for</strong> consistencyInc in % thrombolysedInc in % thrombolysedImproved patientoutcomes afterStroke/TIASTIG/BCCN/<strong>Dudley</strong>StrokeAssociationSTIG/clinicallead <strong>for</strong>stroke/TIAMarch 2014March 2012March 2012220
PRIORITY AREA: TOBACCO CONTROLRECOMMENDATION ACTIONS OUTCOMES LEAD TIMESCALEStrategic approach to TobaccoControl is best co-ordinated by aneffective multi-agency partnership:- Continued strong senior levelsupport and leadership <strong>for</strong> TCagenda- Review role of Tobacco ActionGroup (TAG)- TAG continued accountability toDCP via the H and WP- Refresh the Tobacco <strong>Strategy</strong>and action plan in line with newNational <strong>Strategy</strong>- Development of advocacy role ofthe Alliance around SHS andIllicit tobaccoTC identified as PCT WCC priority<strong>2010</strong>-13Discussed at TAG meeting in JAN10Report annually to H&W partnershipNational <strong>Strategy</strong> released in Feb 10Update local strategy <strong>2010</strong>/11Propose as Alliance priority <strong>for</strong><strong>2010</strong>/11 workplan at meeting endApr <strong>2010</strong>PID developed (copy attached)New terms of reference and newmembers invited to futuremeetingsProduce report and paper whenend of year data availableUpdated strategy and prioritiesProject planKJ &ROROROKJ & RORO2013End of Apr<strong>2010</strong>May <strong>2010</strong>Dec <strong>2010</strong>May <strong>2010</strong>Further develop an evidenced basedand proactive approach to illicittobacco- Plan local prioritiesIdentified in PCT Tobacco PIDPlans to develop action through theAlliance25 Workplace visits in conjunctionwith HMRCKJ& ROROMar 2011Included in role of EH workplacevisits25 workplaces in<strong>for</strong>med of illicittobacco per monthROMar 2011The PCT, Acute Trust, LA and otherpartners should explore ways inwhich data can be collected andshared to improve local intelligenceon key areas e.g. smoking inpregnancy, illicit tobacco, under agesalesAdded smoking and Pregnancy datacollection as CQUINIndicator 2009-10Made improvement to S&P SSS datamonitoring to track referrals anddevelop care plansData still not robustIdentify areas <strong>for</strong> improvementFeedback to DGH on referraloutcomesYHYHYHMar <strong>2010</strong>Mar 2011Monthly reports221
RECOMMENDATION ACTIONS OUTCOMES LEAD TIMESCALEInclude under age sales and illicitdata collection in TS en<strong>for</strong>cementpostTest purchase outcomesROMar 2011Intention to commission EH to carryout additional smokefree compliancechecks in routine and manualworkplaces to include illicit tobaccoand stop smoking in<strong>for</strong>mationThere would be a benefit tindeveloping a programme of ongoingtest purchasing to explore the issueof supply of tobacco to young peopleThe early adoption of DH StopSmoking in Secondary Care toolkitprovides an opportunity to ensureeffective care pathways are in place<strong>for</strong> smokers – this will impact on thekey contributors to tackling healthinequalities.- This would also provide anopportunity to ensure a <strong>for</strong>mallyagreed care pathway <strong>for</strong> smokingin pregnancy to be used by allstaff. (Infant Mortality NSTrecommendations provide furtherdetail on this issue).HINST recommend that the DH StopSmoking Interventions in PrimaryCare toolkit is rolled out to ensurestrengthened infrastructure <strong>for</strong>quality brief interventions.Looking at ways to improve datasharing between HMRC and TSthrough the Alliance0.5 WTE EH Technical Officer postcommissioned from Sep 09- Apr 10Contract renewed Apr 10 – Mar 11PCT has commissioned a jointalcohol and tobacco tradingstandards en<strong>for</strong>cement post from Apr<strong>2010</strong>- Mar 2011Early adopter action in progressPlans to develop a risk assessmenttool <strong>for</strong> pregnant smokers5 pilot sites conducting 10 pointstructures approachBI and referral included inCommunity CQUIN <strong>for</strong> <strong>2010</strong>-11Development of protocol <strong>for</strong>sharing data25 workplace visits /contacts permonthTotal 175 workplace visits300 workplace visits400 test purchases per year20 exercises50 contacts with smokersReduce IM and problematicpregnanciesIncreased access to DSSSBI training <strong>for</strong> HV and CNData on BI and referrals to DSSSROROMar 2011Mar <strong>2010</strong>ROMar 2011RO & JP Mar <strong>2010</strong>JPYHMar 2011Mar <strong>2010</strong>Mar 2011JP Mar <strong>2010</strong>Q1 & Q2-<strong>2010</strong>-11222
All of these initiatives will requiresenior level support and agreementbetween Primary and SecondaryCare organisations to ensure aseamless quality service <strong>for</strong> clients.Varenicline has been approved bythe MMC Dec 2009Through contractual arrangementsas aboveImproved SSS service provision RO OngoingImproved 4 week quit outcomes JP May <strong>2010</strong>223
PRIORITY AREA: ALCOHOL DELIVERY PLAN<strong>Health</strong> and <strong>Health</strong> ImprovementRECOMMENDATION ACTIVITY OUTCOMES LEAD TIMESCALERise awareness of alcohol harm inthe local communityEnsure in<strong>for</strong>mation on alcohol isavailable and accessible to allmembers of the local populationAll workplaces should have alcoholpolicies and provide awareness andsupport <strong>for</strong> staff on alcoholIdentify and target those groups mostat risk of alcohol related harmProvide access to support services<strong>for</strong> alcohol users and carersAlcohol awareness campaignsIn<strong>for</strong>mation about units andsensible drinking limits are availablein the main community languageson the council and PCT websites,and in key healthcare andcommunity settingsIncrease awareness of alcohol inthe workplace and ensurebusinesses are supported todevelop alcohol policiesIntroduce regular alcohol healthpromotion sessions with employersand community groupsTargeted interventions to reducealcohol related admissions tohospitalSmall grants scheme to supportuser and carer groupsThree general awarenesscampaigns to improve knowledge ofunits and health risks of drinking toexcess of the general populationTargeted campaign <strong>for</strong> under 25son the health risks of binge drinkingPartnership Campaign e.g.Christmas Alcohol and CocaineCampaignIncrease in awareness asmeasured by baseline lifestylesurveyIncrease in number ofplaces/services where alcoholin<strong>for</strong>mation is availableEnsure PCT, NHS Trust and LocalAuthority have up to date policieson alcohol in the workplace andmonitor implementationEstablish baseline to reduce alcoholrelated absenteeismDevelop and implement number ofsessions heldRaised awareness measured byevaluation of sessionsAwaiting outcome of socialmarketing study. The interventionsmay be campaigns or specificinterventions e.g. access to briefinterventions, etc.A minimum of five groups to besupported per annumPCT (Public<strong>Health</strong>) + allpartnersPCT (Public<strong>Health</strong>) + allpartnersPCT (Public<strong>Health</strong>) + allpartnersPCT (Public<strong>Health</strong>) + allpartnersPCT (Public<strong>Health</strong>) + allpartnersMarch 2011March 2011March 2013March 2012224
Empower community members toraise awareness of alcohol issues inthe local communityMake use of the <strong>Health</strong>y Townsinitiative to promote alcoholawareness and promote saferdrinkingAlcohol Misuse and Mental <strong>Health</strong>Implementation of accreditedcommunity training courseLinks between the Alcohol <strong>Strategy</strong>and the <strong>Health</strong>y Towns agenda tobe developedRaise awareness of the linksbetween mental ill health andalcohol misuseA minimum of 10 people trainedand accredited to deliver alcoholawareness training to communitygroupsPark Rangers to undertake Tier 1and Tier 2 Drug and AlcoholAwareness TrainingIncrease in the number of peoplereceiving appropriate treatmentPCT (Public<strong>Health</strong>) + allpartnersMarch 2011DMBC/DAAT March 2011PCT/DAAT March 2013225
Early intervention and treatmentRECOMMENDATION ACTIVITY OUTCOMES LEAD TIMESCALEImplement routine identification inA&E and provide brief advice tothose identifiedIntroduce routine identification andbrief advice in Primary CareContinue alcohol arrest referralschemeRoll out alcohol IBA training to healthcare professionals and a wide rangeof frontline staffUse the increased capacity of thedrug and alcohol liaison team toimplement IBA in A&E and follow uppatients after leaving EDDevelop an alcohol LES to supportthe existing DES <strong>for</strong> new registrantsInclude alcohol IBA in vascularchecksOffer routine identification and briefadvice when people are arrestedand in custodyTraining needs assessment toassess number of all staff requiringtraining and number of programmesto be offeredReduction in frequent attendees atED (baseline to be set)Reduction in alcohol consumption<strong>for</strong> patients given brief advicemeasured at 3 month follow-upAlcohol register to be set up toestablish baselineAlcohol LES to be offered tointerested GPsIncrease in referrals to alcoholservicesReduction in alcohol consumption<strong>for</strong> patients given brief advicemeasured at 6 month follow-upReduction in alcohol consumption<strong>for</strong> patients given brief advicemeasured at 3 month follow-upReduction in offending rateIncrease in number of staff trainedin general alcohol awareness. Briefadvice and signpostingBrief interventionsPCT March 2012PCT March 2011DAATPartnershipManagerMarch 2011PCT/DAAT March 2011Increase capacity of specialistalcohol services to match demandcreated by increased earlyidentificationTraining of healthcare work<strong>for</strong>ce inearly identification and offer briefadviceReview current specialist alcoholtreatment services in light ofMoCAM and the Review of theEffectiveness of Treatment <strong>for</strong>Alcohol ProblemsIncrease in skills and confidence ofstaffIncrease in numbers of harmful andhazardous drinkers identified andgiven brief adviceIdentify gaps, strengths andweaknesses in current provisionOutcome of review to determinefuture levels of service required toreduce waiting times and addressunmet needsPCT/DAAT March 2011226
Develop an integrated alcoholtreatment system across all tiers,including wrap around servicesEnsure robust systems are in place<strong>for</strong> monitoring service provisionInvolve service users and carers inthe planning and delivery of alcoholservicesEnsure the needs of vulnerablegroups are met, including thehomeless and asylum seekersReconfigure treatment provisionwhere appropriate to ensure that anaccessible integrated system ofeffective interventions is providedacross the four tiers to meet localneedsReview care pathways and ensurethey are fit <strong>for</strong> purposeReview commissioning andper<strong>for</strong>mance management systems<strong>for</strong> all levels of alcohol interventionDevelop a user and carers strategyImprove the identification of alcoholmisuse issues in respect of tenancysustainment referrals andhomelessness presentationsA treatment strategy and actionplan is in place and implementedPer<strong>for</strong>mance management andreporting systems in placeService user and carer involvementstrategy developedService users and carers aredemonstrably involvedBetter equipping of staff to respondappropriatelyPCT/DAAT March 2012PCT/DAAT March 2012PCT/DAAT March 2013Sian EvansDACHSMarch 2013227
Reducing crime and disorder, including domestic abuseRECOMMENDATION ACTIVITY OUTCOMES LEAD TIMESCALEReduce alcohol related harm andreduce crime and disorder througheffective advocacy and partnershipworkingAlcohol Arrest Referral SchemeTaxi Marshalling SchemePub WatchSocial Responsibility SchemeCumulative Impact PolicyTest PurchasingJAGReduce alcohol relatedoffending and improve healthoutcomesSustain funding <strong>for</strong> scheme tocontinueDevelop effective links withrelevant legislation and the “pubtrade”Explore further role out ofschemeReceive evaluation of schemeEnsure that cumulative impact isretained in StourbridgeOngoing test purchasing activityin<strong>for</strong>med by intelligenceImplement activities led byIntelligenceDAAT March 2011subject tofundingDMBCLicensingWest MidlandsPoliceDMBC TradingStandards/CommunityRenewal TeamWest MidlandsPoliceDMBC – TradingStandardsDMBC –Communitysafety TeamMarch 2011March 20<strong>15</strong>March 2011March 20<strong>15</strong>March 2011March 2012228
Offender ManagementRECOMMENDATION ACTIVITY OUTCOMES LEAD TIMESCALEProvide a range of interventions toreduce offending and alcoholmisuseDrink Impaired DriversProgrammeLow Intensity AlcoholProgrammeOffender Substance AbuseProgrammeTel<strong>for</strong>d TrainingConsortium 2000Reduce drink drive offences(groupwork)Reduce Alcohol related offences(groupwork)Work with offenders where alcoholhas contributed to their offending.Reduce offending and alcoholmisuse (groupwork)1 to 1 work with offenders who maydisclose problems with alcohol pre orpost sentence. Input may be tailoredto safer drinking/healthier lifestylesand/drink driving.Probation -Lead Officer -Bronwen ElphickProbation -LeadOfficer -Bronwen ElphickProbation -Lead Officer -Bronwen ElphickProbation -(Delivered byTTC staff)March 2011March 2011March 2011Time limiteddue to fundingAlcohol TreatmentRequirementEnsuring robust links withDrug Treatment ServicesTraining sessions are also arranged<strong>for</strong> probation staff to acquireexpertise in addressing alcohol usewith offenders and also to educatethem in leading healthier lifestylesthemselves1 to 1 work with drink dependentoffenders who may require detox orother medical treatment over 4sessionsWork<strong>for</strong>ce development – ensurethat all Drug Intervention ProgrammeWorkers are trained and skilled to beable to deliver a brief intervention orsignpost to specialist treatment thosedrug misusing offenders <strong>for</strong> whomalcohol is also a “problemEnsure that brief advice andin<strong>for</strong>mation is delivered to those whoreceive a DIP Conditional CautionProbation -Lead Officer -Bronwen ElphickCranstoun DrugServicesLead Officer -Dee RussellMarch 2011March 2012229
PRIORITY AREA: CANCER DELIVERY PLANRECOMMENDATION ACTIVITY OUTCOMES LEAD TIMESCALEDevelop effective early awarenesssocial marketing programmes <strong>for</strong> 6cancer sitesExtend screening age and increaseuptake of breast screening programmeAchieve 14 day turnaround target <strong>for</strong>results and increase uptake of cervicalscreening programmeDevelop and deliver social marketingprogrammesIncrease capacity of breast screeningprogrammeDevelop social marketingprogrammesRedesign cervical screening pathwayDevelop social marketingIncreased cancer awareness,earlier stage at diagnosisIncreased 1 year survivalIncreased 5 yr survivalIncreased uptake ratesIncreased early detection ratesIncreased breast cancer survivalIncreased uptake ratesIncreased early detection ratesIncreased cervical cancer survivalprogrammesImplement Tobacco Control <strong>Strategy</strong> See <strong>Strategy</strong> Decreased smoking ratesDecreased cancer incidence,particularly lung cancerTC/PS March 2014TC/PS March 2014TC/PS March 2014KJ/RO March 2014Implement obesity <strong>Strategy</strong> See <strong>Strategy</strong> Decreased obesity ratesKJ March 2014Decreased cancer incidence.Implement Improving Outcomes Ensure Peer review compliance Increased cancer survival rates TC/CS March 2014Guidance in fullUtilise Cancer Commissioning ToolkitAnalyse the results of the <strong>2010</strong>National Cancer Patient ExperiencesurveyIdentify experience by age, gender,deprivation and ethnicity.Identify areas <strong>for</strong> improvement inpatient experienceTC/CS March 2012MDTs should monitor new patients byethnicity, age, gender, postcode andprimary treatment also stage atpresentationProvide safe sun message and reducesunbed usageFocus on cancer survivorshipEnsure access to high quality end oflife careInclude in Acute Contract (?CQUINS)<strong>Health</strong>y schools sun protectionprogrammeWork with LA to limit access tosunbedsDevelop cancer survivorship strategySupport MacMillan CAB service <strong>for</strong>cancer survivorsImplement EOL strategyImproved understanding ofaccess to treatment in <strong>Dudley</strong>Decreased incidence of skincancerImproved rehabilitationImproved experienceImproved rehabilitationImproved experienceTC/CS March 2012JE/TC March 2014TC/PS March 2014PS March 2014230
RECOMMENDATION ACTIVITY OUTCOMES LEAD TIMESCALEReview primary care urgent 2 weekreferrals and conversion ratesExamine Primary Care Cancer Auditand develop cancer update trainingprogramme <strong>for</strong> GPsAddress capacity issues at localcancer chemotherapy unitReview referralsComplete Primary care Cancer Audit.Review results.Develop training programmeRedesign chemotherapy serviceEnsure most effective use ofurgent referral routeIncrease GP awareness of cancerEarlier diagnosis and referralIncreased access to treatmentImproved patient experienceTC March 2012TC/PS March 2012TC/DGoHs March 2014231
PRIORITY AREA: COPD DELIVERY PLANRECOMMENDATION ACTIVITY OUTCOMES LEAD TIMESCALENational COPD <strong>Strategy</strong> „Missing Millions‟ (previouslyundiagnosed COPD) pilot that hascommenced: Audit of 800 patientsvia GP surgeries, communitypharmacists, <strong>Dudley</strong> Stop SmokingNICE GuidanceImplement the new guidelines <strong>for</strong>COPD Mild, Moderate, Severe andVery Severe as part of the COPDLocal Enhanced ServiceIncrease prevalence numbers in<strong>Dudley</strong>Increase appropriate reviews ofCOPD patients and reduceadmissions to hospitals.Joanne Hamiltonand Dr MarkHopkinJoanne Hamilton(RespiratoryNurse) and DrMark Hopkin(Respiratory LITChair)National COPD <strong>Strategy</strong> End of life care lead <strong>for</strong> COPD Improve quality of life and choice Andrew Hindle(commissioner)Joanne Hamilton(RespiratoryNurse)March 2012March 2012March 2013232
PRIORITY AREA: SEASONAL EXCESS DEATHS DELIVERY PLANRECOMMENDATION ACTION OUTCOMES LEAD TIMESCALEDevelop a SED partnership strategyAnalysis of local SED dataSED communication strategy <strong>for</strong>af<strong>for</strong>dable warmthScale up the approach to af<strong>for</strong>dablewarmth across the partnershipExtend the use of the vulnerableadults list and identify key workers toincorporate seasonal protectionwork with vulnerable adultsEnsure people on the vulnerableadults list are assessed <strong>for</strong> a rangeof risk factors and they aresupported to take up the offers ofinterventionsJointly review the communityengagement work on af<strong>for</strong>dablewarmth, share the findings andin<strong>for</strong>m shared strategic approachesand actionsDevelop a training and monitoringprogramme <strong>for</strong> frontline staff tosupport af<strong>for</strong>dable warmth referralsbetween agenciesSet up a small partnership group assub-group of the Older Persons LITto develop a SED strategyData on SED produced as a JSNA<strong>for</strong> <strong>Health</strong> <strong>Inequalities</strong> strategyCommunication strategy to beproduced as part of the SEDstrategy developmentIncorporate an action plan in thestrategy to address the scaling up ofinitiatives in a planned wayInclude this as an action in theSED strategyDevelop a recording system toensure that vulnerable people on therisk register are assessed andsupported to take up interventionsImplement a failsafe scheme toensure that those not assessed ornot receiving support are followedupIncorporate the findings fromcommunity engagement into theSED action planWork with the training department toensure appropriate training isavailable to all frontline staffPartnership group set up andstrategy developed and action planimplementedHI JSNA producedData analysed to understand localvariations in SEDFindings shared across partnershipIn<strong>for</strong>mation on SED shared withfrontline staff and clear referralpathways being implementedCo-ordinated approach to SED isimplemented across partnershipagenciesA co-ordinated scaled-up approachto SED is in place and implementedacross the partnershipFewer vulnerable adults are at riskof SEDThe new strategy reflects thefindingsReferral pathways in place and stafftrained to refer appropriatelyOlder Person‟scommissionerSeptember <strong>2010</strong>PH In<strong>for</strong>mation April <strong>2010</strong>SED strategygroupSED strategygroupSED strategygroupSED strategygroupSED strategygroupSED strategygroupSeptember <strong>2010</strong>March 2011March 2011March 2011March 2011March 2011233
RECOMMENDATION ACTION OUTCOMES LEAD TIMESCALEIncorporate questions on cold, damphousing into the SAP <strong>for</strong> health andsocial careInvestigate why people who areeligible <strong>for</strong> influenza andpneumococcal vaccinations andaf<strong>for</strong>dable warmth grants do notapply and develop an action plan toaddress the issues<strong>Health</strong> and housing partners to worktogether to use the HHSRS to in<strong>for</strong>mstrategic commissioning plans toreduce SEDExamine the learning from Investing<strong>for</strong> <strong>Health</strong> project 2a on developinga robust framework to accelerate thenumbers of householders accessingwarmth in winter initiativesReview the decision on using„<strong>Health</strong>y Outlook‟ in view of therecent pilot study outcomesReview the questions on cold damphousing and incorporate into theSAPUse community engagement/PAapproaches to identify the reasons<strong>for</strong> poor uptake of pneumococcalvaccines and af<strong>for</strong>dable warmthgrants.Implement an action plan based onthe findingsTo be addressed as an action in theSED strategyIncorporate the learning fromInvesting <strong>for</strong> <strong>Health</strong> into the newSEE strategyUndertake a local review of the<strong>Health</strong>y Outlook findings and itsimplications <strong>for</strong> local healthinequalitiesHousing issues identified by healthand social care staff and they aretrained to make referralsAn increase in uptake ofpneumococcal vaccines and grantsHHSRS used to in<strong>for</strong>m the newSED strategyIncrease in numbers accessinghealth through warmth grantsMake recommendations as a resultof the reviewSED strategygroupSED strategygroupSED strategygroupSED strategygroupMarch 2011March 2011March 2011March 2011Public <strong>Health</strong> September 2011234
APPENDIX 3 – HEALTH INEQUALITIES CHECKLISTS FOR STRATEGIES AND PLANSPRIORITY ACTION – STRATEGIES AND PLANS Does the plan provide adequateassurance? (Tick)1. Does the strategy or policy make specific reference to reducing health inequalities?2. Is there evidence to illustrate the inequality?3. Are all relevant partners engaged in the process?4. Is there a named person with lead responsibility?5. Is there a national or local target set?6. How will progress against the target be measured and reported?YESNOPRIORITY ACTION – STRATEGY AND GOVERNANCE Does the plan provide adequateassurance?(Tick )1. Do the Strategic and Operating Plans address short term (<strong>2010</strong>), medium term (lifestyle) and longer term (wider determinants)?2. Spearhead obligations - are there specific strategies to meet AAAC mortality, CVD, Cancer, Infant Mortality PSA targets?3. Is reference made to the plans that will deliver targets, and who will be responsible <strong>for</strong> delivery of each?4. Are other causes COPD, Stroke, Alcohol Seasonal Excess Deaths (SEDs) part of the plans?5. Is there a reporting process to PCT Board/Partnership Board/ OSC on inequalities targets?6. Does the Strategic Plan raise any concerns about resources to deliver all the above?YESNOPRIORITY AREA – COMMUNITY ENGAGEMENT Does the plan provide adequateassurance? (Tick )1. Does the LSP have an infrastructure and processes in place to systematically work with all vulnerable and deprived communities?2. Does the PCT have mechanisms to harness LSP community engagement mechanisms:a. to access those seldom seen/heard?b. to improve local healthcare outcomes3. Does the Plan mention LSP strategy to develop Third Sector input e.g. on access <strong>for</strong> seldom seen/heard communities?4. Is a segmented approach being taken to develop customer access strategies?YESNO235
HEALTH INEQUALITIES CHECKLIST FOR SERVICESPRIORITY ACTION – ACCESS TO SERVICES Does the plan provide adequateassurance? (Tick)1. Has an assessment been made of evidence of need and a baseline established?2. Have physical barriers to access been assessed?3. Have hidden barriers to access been addressed?4. Is the service friendly to all service users?5. Is in<strong>for</strong>mation made available to all users in a variety of different <strong>for</strong>mats?6. Is there a mechanism <strong>for</strong> obtaining users‟ views and is there evidence of how the service changes to take account of these views?7. Do staff understand the health inequalities agenda and have they received appropriate training?8. Have the needs of specific users been taken into account?YESNOPRIORITY ACTION – PRIMARY CARE Does the plan provide adequateassurance?(Tick )1. Do all GPs in the PCT achieve 90% or more <strong>for</strong> total non-clinical QOF points (an indicator of organisational capability/capacity)?2. Is there a strategy <strong>for</strong> quality improvement of primary care, which includes:A „balanced scorecard‟?A clustering of practices, like-with-like, <strong>for</strong> benchmarking purposes?Strong multidisciplinary per<strong>for</strong>mance management systems in place (eg challenging QOF exception reporting)?A range of development resources, <strong>for</strong> short term deployment, to improve practice per<strong>for</strong>mance on outcomes?Support to practices to support development of business models to expand capacity/capability to achieve outcomes?3. Does the Plan mention a timely Primary Care strategy/actions to raise the bar <strong>for</strong> GMS/ PMS contracts, e.g. QOF plus?4. Is the PCT providing support to practices/PBCs to benchmark and use population health intelligence?5. Does the PCT use a dashboard of key per<strong>for</strong>mance in<strong>for</strong>mation (QOF, disease registers, admission data, prescribing)?YESNO236
PRIORITY ACTIONENGAGEMENT– WORKFORCE AND FRONTLINEDoes the plan provide adequate assurance?(Tick )YESNOFrontline Engagement1. Is there a systematic work<strong>for</strong>ce development and training plan to harness frontline staff into (at the least) components of SSS,alcohol and obesity management, covering identification of risk and brief interventions? Do these cover:Acute Trusts and along main patient pathwaysCommunity <strong>Health</strong> ServicesMental <strong>Health</strong>Local Authority Commissioned Services2. Are there a variety of managed referral pathways to specialist lifestyle risk support services from the main frontline services?3. Are referral numbers to specialist support services monitored, and actions taken to improve where necessary?4. Are the above points specified in commissioning schedules?237