- Page 1 and 2: 2010FDudley Strategy forTackling He
- Page 3 and 4: ENDORSEMENT OF THE 2010 - 2015HEALT
- Page 5 and 6: CONTENTSFOREWORD………………
- Page 7 and 8: Standardised Rate per 100,000 Popul
- Page 9 and 10: There were three principles that un
- Page 11 and 12: This work has been built on trustin
- Page 13 and 14: ENSURE A HEALTHY STANDARD OF LIVING
- Page 15 and 16: with, or at high risk of vascular d
- Page 17 and 18: Tackling underage/illegal alcohol c
- Page 19 and 20: 2. VISION STATEMENTThe mission stat
- Page 21 and 22: tackle health inequalities in the t
- Page 23 and 24: These recommendations are addressed
- Page 25 and 26: injustice and deprivation impact ne
- Page 27 and 28: - Giving priority to pre and post-n
- Page 29 and 30: Percentage of live and still births
- Page 31 and 32: EYFS Median Scores by National Depr
- Page 33 and 34: data which shows us locally what ac
- Page 35 and 36: instability. Factors such as job se
- Page 37 and 38: Proportion of population claiming J
- Page 39 and 40: Data is available for those ALMPs f
- Page 41 and 42: Labour market outcomes to date are
- Page 43 and 44: achieved through transfer payments,
- Page 45 and 46: % share of equivalised incomeA comp
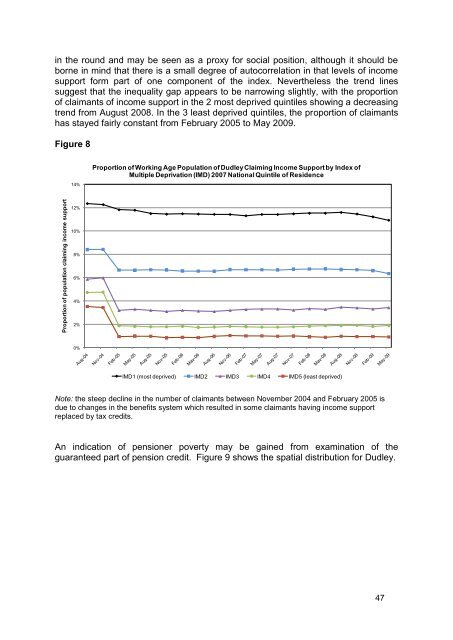
- Page 47: Figure 7 shows the income distribut
- Page 51 and 52: Although temperature variations dur
- Page 53 and 54: 5. LEADERSHIP AND PARTNERSHIPDudley
- Page 55 and 56: A Community Renewal team which coor
- Page 57 and 58: 6. COMMUNITY ENGAGEMENTCommunity En
- Page 59 and 60: o DMBC sharing their community enga
- Page 61 and 62: Transferring power to communitiesNI
- Page 63 and 64: Standardised Rate per 100,000 Popul
- Page 65 and 66: Secondary Prevention of CVDOptimum
- Page 67 and 68: Ratio of obsevred vs. expected prev
- Page 69 and 70: Performance variation cannot be exp
- Page 71 and 72: Table 4: Range of performance gapDi
- Page 73 and 74: Conclusions:The general conclusions
- Page 75 and 76: 7.2 ACUTE CARDIO-VASCULAR DISEASE (
- Page 77 and 78: Standardised Rate per 100,000 Popul
- Page 79: Timely ResponseApproximately 30% of
- Page 82 and 83: IMD ScoreRevascularisation Ward Rat
- Page 84 and 85: That an increase in access to diagn
- Page 86 and 87: Establishing the level of health eq
- Page 88 and 89: Standardised Rate per 100,000 Popul
- Page 90 and 91: Timely ResponseTimely access to tre
- Page 92 and 93: Continue implementation of current
- Page 94 and 95: “reduce smoking during pregnancy
- Page 96 and 97: Percentage who currently smokePerce
- Page 98 and 99:
1. Stop Smoking Service ProvisionDu
- Page 100 and 101:
Proportion of clients that have qui
- Page 102 and 103:
3. Communication and EducationDSSS
- Page 104 and 105:
The PCT, Acute Trust, Local Authori
- Page 106 and 107:
Standardised Rate per 100,000 Popul
- Page 108 and 109:
admissions. The following year Dudl
- Page 110 and 111:
Standardised Rate per 100,00 popula
- Page 112 and 113:
Netherton &WoodsideHalesowen NorthC
- Page 114 and 115:
women the Mosaic groups with signif
- Page 116 and 117:
numbers of alcohol related sexual o
- Page 118 and 119:
These include:Securing additional i
- Page 120 and 121:
Standardised Rate per 100,000 Popul
- Page 122 and 123:
The deprivation gap in invasive can
- Page 124 and 125:
Age standardised incidence rate rat
- Page 126 and 127:
Standardised Rate per 100,000 Popul
- Page 128 and 129:
One of the priorities of the Cancer
- Page 130 and 131:
Colorectal cancerProstate cancerThe
- Page 132 and 133:
and less radical treatment than you
- Page 134 and 135:
As more people than ever are surviv
- Page 136 and 137:
• Benchmarking of surgery aspirin
- Page 138 and 139:
Standardised Rate per 100,000 Popul
- Page 140 and 141:
Standardised Rate per 100,000 Popul
- Page 142 and 143:
There is a weak correlation between
- Page 144 and 145:
7.7 SEASONAL EXCESS DEATHSREDUCING
- Page 146 and 147:
Excess Winter Mortality Index (%)Me
- Page 148 and 149:
Brockmoor & PensnettSt JamesKingswi
- Page 150 and 151:
Percentage uptake of seasonal flu v
- Page 152 and 153:
Percentage uptake of seasonal flu v
- Page 154 and 155:
The group will establish terms of r
- Page 156 and 157:
Standardised Rate per 100,000 Popul
- Page 158 and 159:
Standardised Rate per 100,000 popul
- Page 160 and 161:
Standardised Rate per 100,000 popul
- Page 162 and 163:
PercentagePercentageFigure 7aMechan
- Page 164 and 165:
PercentageFigure 8bMechanism of inj
- Page 166 and 167:
Key findings from analysis of morta
- Page 168 and 169:
Standardised rate per 100,000 popul
- Page 170 and 171:
Standardised Rate per 100,000 popul
- Page 172 and 173:
Standardised Rate per 100,000 popul
- Page 174 and 175:
PercentageFigure 17bMechanism of in
- Page 176 and 177:
Key findings from analysis of emerg
- Page 178 and 179:
Action plan updated in 2008 to rein
- Page 180 and 181:
the minimum standards set out by th
- Page 182 and 183:
Further analysis shows that for hyp
- Page 184 and 185:
8.2 SOCIAL CAREAdult Social CareSoc
- Page 186 and 187:
8.3 TRANSFORMING COMMUNITY SERVICES
- Page 188 and 189:
DCS has some key performance target
- Page 190 and 191:
8.4 DEVELOPING THE ROLE OF THE VOLU
- Page 192 and 193:
at the heart of action to address c
- Page 194 and 195:
CHC‟s are trained and supported t
- Page 196 and 197:
capacity and confidence of individu
- Page 198 and 199:
which it has never done before. The
- Page 200 and 201:
centres‟ outreach workers and Hea
- Page 202 and 203:
9.1 DUDLEY HEALTH INEQUALITIES HIGH
- Page 204 and 205:
RECOMMENDATION ACTIVITY OUTCOMES LE
- Page 206 and 207:
RECOMMENDATION ACTIVITY OUTCOMES LE
- Page 208 and 209:
RECOMMENDATION ACTIVITY OUTCOMES LE
- Page 210 and 211:
Dudley Community Partnership (2005)
- Page 212 and 213:
Great Britain. Department of Health
- Page 214 and 215:
NHS Dudley and Dudley Metropolitan
- Page 216 and 217:
APPENDIX 1 - PERFORMANCE INDICATORS
- Page 218 and 219:
Indicator Dudley England Least Most
- Page 220 and 221:
APPENDIX 2 - DELIVERY PLANS FOR PRI
- Page 222 and 223:
PRIORITY AREA: TOBACCO CONTROLRECOM
- Page 224 and 225:
All of these initiatives will requi
- Page 226 and 227:
Empower community members toraise a
- Page 228 and 229:
Develop an integrated alcoholtreatm
- Page 230 and 231:
Offender ManagementRECOMMENDATION A
- Page 232 and 233:
RECOMMENDATION ACTIVITY OUTCOMES LE
- Page 234 and 235:
PRIORITY AREA: SEASONAL EXCESS DEAT
- Page 236 and 237:
APPENDIX 3 - HEALTH INEQUALITIES CH
- Page 238:
PRIORITY ACTIONENGAGEMENT- WORKFORC