operational committee's reports - Singapore Shipping Association
operational committee's reports - Singapore Shipping Association
operational committee's reports - Singapore Shipping Association

Create successful ePaper yourself
Turn your PDF publications into a flip-book with our unique Google optimized e-Paper software.
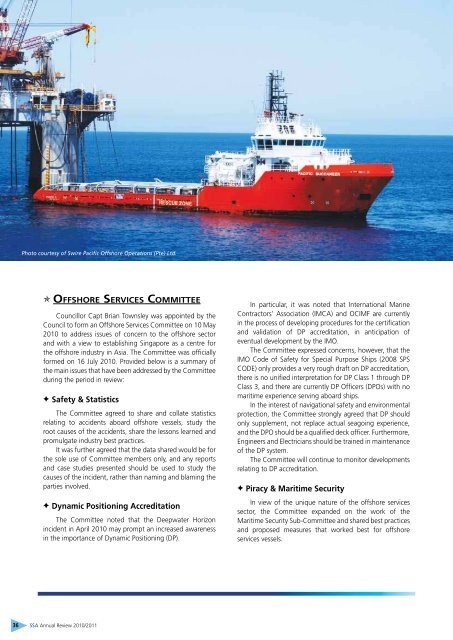
Photo courtesy of Swire Pacific Offshore Operations (Pte) Ltd.<br />
O offShore ServIceS commITTee<br />
Councillor Capt Brian Townsley was appointed by the<br />
Council to form an Offshore Services Committee on 10 May<br />
2010 to address issues of concern to the offshore sector<br />
and with a view to establishing <strong>Singapore</strong> as a centre for<br />
the offshore industry in Asia. The Committee was officially<br />
formed on 16 July 2010. Provided below is a summary of<br />
the main issues that have been addressed by the Committee<br />
during the period in review:<br />
F Safety & Statistics<br />
The Committee agreed to share and collate statistics<br />
relating to accidents aboard offshore vessels, study the<br />
root causes of the accidents, share the lessons learned and<br />
promulgate industry best practices.<br />
It was further agreed that the data shared would be for<br />
the sole use of Committee members only, and any <strong>reports</strong><br />
and case studies presented should be used to study the<br />
causes of the incident, rather than naming and blaming the<br />
parties involved.<br />
F Dynamic Positioning Accreditation<br />
The Committee noted that the Deepwater Horizon<br />
incident in April 2010 may prompt an increased awareness<br />
in the importance of Dynamic Positioning (DP).<br />
36 SSA Annual Review 2010/2011<br />
In particular, it was noted that International Marine<br />
Contractors’ <strong>Association</strong> (IMCA) and OCIMF are currently<br />
in the process of developing procedures for the certification<br />
and validation of DP accreditation, in anticipation of<br />
eventual development by the IMO.<br />
The Committee expressed concerns, however, that the<br />
IMO Code of Safety for Special Purpose Ships (2008 SPS<br />
CODE) only provides a very rough draft on DP accreditation,<br />
there is no unified interpretation for DP Class 1 through DP<br />
Class 3, and there are currently DP Officers (DPOs) with no<br />
maritime experience serving aboard ships.<br />
In the interest of navigational safety and environmental<br />
protection, the Committee strongly agreed that DP should<br />
only supplement, not replace actual seagoing experience,<br />
and the DPO should be a qualified deck officer. Furthermore,<br />
Engineers and Electricians should be trained in maintenance<br />
of the DP system.<br />
The Committee will continue to monitor developments<br />
relating to DP accreditation.<br />
F Piracy & Maritime Security<br />
In view of the unique nature of the offshore services<br />
sector, the Committee expanded on the work of the<br />
Maritime Security Sub-Committee and shared best practices<br />
and proposed measures that worked best for offshore<br />
services vessels.<br />
35<br />
30<br />
25<br />
15<br />
10<br />
5<br />
40<br />
20<br />
Photo courtesy of Rickmers Trust<br />
Management Pte Ltd.<br />
PORT & SHIPPING STATISTICS<br />
Total Seaborne Cargo (in ‘000 Tonnes)<br />
General Cargo Bulk Cargo<br />
Year Total Cargo Containerised Conventional Oil Others<br />
2000 325,591.10 185,857.00 13,719.80 113,329.40 12,684.90<br />
2001 313,487.00 171,208.60 14,867.10 113,759.10 13,652.20<br />
2002 335,155.90 183,954.90 14,565.60 120,667.30 15,968.10<br />
2003 347,694.10 191,687.60 14,759.90 123,374.70 17,872.00<br />
2004 393,417.60 223,503.30 17,378.20 129,328.20 23,207.90<br />
2005 423,267.60 241,973.00 20,291.10 137,826,20 23,176.30<br />
2006 448,503.90 258,553.00 22,840.30 153,029.50 14,081.20<br />
2007 483,616.10 289,094.20 25,823.20 157,382.30 11,316.40<br />
2008 515,415.30 308,489.70 27,934.90 167,318.90 11,671.80<br />
2009 472,300.30 268,898.80 17,452.10 177,323.70 14,627.70<br />
2010 503,342.00 289,693.50 23,989.60 177,070.20 12,588.70<br />
<strong>Singapore</strong> Merchant Fleet<br />
Year GT(millions) No. of Vessels<br />
2000 23.04 3335<br />
2001 23.17 3353<br />
2002 23.55 3355<br />
2003 25.57 3063<br />
2004 27.71 3109<br />
2005 32.96 3219<br />
2006 34.79 3249<br />
2007 39.6 3553<br />
2008 43.7 3843<br />
2009 45.63 3950<br />
2010 48.78 3978<br />
million TEUS<br />
million tonnes<br />
Container Throughput<br />
17.09<br />
15.57<br />
16.94<br />
18.41<br />
21.32<br />
23.19<br />
24.79<br />
27.94<br />
29.92<br />
25.87<br />
28.43<br />
2000 2001 2002 2003 2004 2005 2006 2007 2008 2009 2010<br />
18.65<br />
20.35<br />
Bunker Uplift<br />
20.10<br />
20.80<br />
23.57<br />
25.48<br />
28.38<br />
31.55<br />
34.94<br />
36.39<br />
40.85<br />
2000 2001 2002 2003 2004 2005 2006 2007 2008 2009 2010<br />
Total Cargo (in ‘000 Tonnes)<br />
GT (millions)<br />
600,000<br />
450,000<br />
300,000<br />
150,000<br />
0<br />
50<br />
38<br />
25<br />
13<br />
0<br />
2000<br />
2000<br />
2001<br />
2001<br />
2002<br />
2002<br />
2003<br />
2003<br />
2004<br />
2004<br />
2005<br />
2005<br />
2006<br />
2006<br />
2007<br />
2007<br />
2008<br />
2008<br />
2009<br />
2009<br />
2010<br />
2010<br />
SSA Annual Review 2010/2011<br />
37