species
species
species
- No tags were found...

You also want an ePaper? Increase the reach of your titles
YUMPU automatically turns print PDFs into web optimized ePapers that Google loves.
Copyright © 2008 Pearson Education, Inc., publishing as Pearson Benjamin Cummings
Copyright © 2008 Pearson Education, Inc., publishing as Pearson Benjamin Cummings
Copyright © 2008 Pearson Education, Inc., publishing as Pearson Benjamin Cummings
Copyright © 2008 Pearson Education, Inc., publishing as Pearson Benjamin Cummings
Copyright © 2008 Pearson Education, Inc., publishing as Pearson Benjamin Cummings
Copyright © 2008 Pearson Education, Inc., publishing as Pearson Benjamin Cummings
Copyright © 2008 Pearson Education, Inc., publishing as Pearson Benjamin Cummings
Copyright © 2008 Pearson Education, Inc., publishing as Pearson Benjamin Cummings
Copyright © 2008 Pearson Education, Inc., publishing as Pearson Benjamin Cummings
Copyright © 2008 Pearson Education, Inc., publishing as Pearson Benjamin Cummings
Copyright © 2008 Pearson Education, Inc., publishing as Pearson Benjamin Cummings
Copyright © 2008 Pearson Education, Inc., publishing as Pearson Benjamin Cummings
Chapter 26Phylogeny and the Tree of LifePowerPoint ® Lecture Presentations forBiologyEighth EditionNeil Campbell and Jane ReeceLectures by Chris Romero, updated by Erin Barley with contributions from Joan SharpCopyright © 2008 Pearson Education, Inc., publishing as Pearson Benjamin Cummings
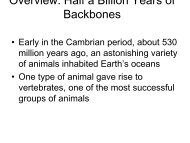
Overview: Investigating the Tree of Life• Phylogeny is the evolutionary history of a<strong>species</strong> or group of related <strong>species</strong>• The discipline of systematics classifiesorganisms and determines their evolutionaryrelationships• Systematists use fossil, molecular, and geneticdata to infer evolutionary relationshipsCopyright © 2008 Pearson Education, Inc., publishing as Pearson Benjamin Cummings
Fig. 26-2
Concept 26.1: Phylogenies show evolutionaryrelationships• Taxonomy is the ordered division and namingof organismsCopyright © 2008 Pearson Education, Inc., publishing as Pearson Benjamin Cummings
Binomial Nomenclature• In the 18th century, Carolus Linnaeuspublished a system of taxonomy based onresemblances• Two key features of his system remain usefultoday: two-part names for <strong>species</strong> andhierarchical classificationCopyright © 2008 Pearson Education, Inc., publishing as Pearson Benjamin Cummings
• The two-part scientific name of a <strong>species</strong> iscalled a binomial• The first part of the name is the genus• The second part, called the specific epithet, isunique for each <strong>species</strong> within the genus• The first letter of the genus is capitalized, andthe entire <strong>species</strong> name is italicized• Both parts together name the <strong>species</strong> (not thespecific epithet alone)Copyright © 2008 Pearson Education, Inc., publishing as Pearson Benjamin Cummings
Hierarchical Classification• Linnaeus introduced a system for grouping<strong>species</strong> in increasingly broad categories• The taxonomic groups from broad to narroware domain, kingdom, phylum, class, order,family, genus, and <strong>species</strong>• A taxonomic unit at any level of hierarchy iscalled a taxonCopyright © 2008 Pearson Education, Inc., publishing as Pearson Benjamin Cummings
Fig. 26-3Species:PantherapardusGenus: PantheraFamily: FelidaeOrder: CarnivoraClass: MammaliaPhylum: ChordataKingdom: AnimaliaBacteriaDomain: EukaryaArchaea
Fig. 26-3aClass: MammaliaPhylum: ChordataKingdom: AnimaliaBacteriaDomain: EukaryaArchaea
Fig. 26-3bSpecies:PantherapardusGenus: PantheraFamily: FelidaeOrder: Carnivora
Linking Classification and Phylogeny• Systematists depict evolutionary relationshipsin branching phylogenetic treesCopyright © 2008 Pearson Education, Inc., publishing as Pearson Benjamin Cummings
Fig. 26-4Order Family GenusSpeciesPantherapardusTaxideataxusLutra lutraCanislatransCanislupusPanthera Taxidea Lutra CanisFelidae Mustelidae CanidaeCarnivora
• Linnaean classification and phylogeny candiffer from each other• Systematists have proposed the PhyloCode,which recognizes only groups that include acommon ancestor and all its descendentsCopyright © 2008 Pearson Education, Inc., publishing as Pearson Benjamin Cummings
• A phylogenetic tree represents a hypothesisabout evolutionary relationships• Each branch point represents the divergenceof two <strong>species</strong>• Sister taxa are groups that share animmediate common ancestorCopyright © 2008 Pearson Education, Inc., publishing as Pearson Benjamin Cummings
• A rooted tree includes a branch to representthe last common ancestor of all taxa in the tree• A polytomy is a branch from which more thantwo groups emergeCopyright © 2008 Pearson Education, Inc., publishing as Pearson Benjamin Cummings
Fig. 26-5Branch point(node)Taxon AANCESTRALLINEAGETaxon BTaxon CTaxon DTaxon ESistertaxaCommon ancestor oftaxa A–FPolytomyTaxon F
What We Can and Cannot Learn fromPhylogenetic Trees• Phylogenetic trees do show patterns of descent• Phylogenetic trees do not indicate when<strong>species</strong> evolved or how much genetic changeoccurred in a lineage• It shouldn’t be assumed that a taxon evolvedfrom the taxon next to itCopyright © 2008 Pearson Education, Inc., publishing as Pearson Benjamin Cummings
Applying Phylogenies• Phylogeny provides important informationabout similar characteristics in closely related<strong>species</strong>• A phylogeny was used to identify the <strong>species</strong> ofwhale from which “whale meat” originatedCopyright © 2008 Pearson Education, Inc., publishing as Pearson Benjamin Cummings
Fig. 26-6RESULTSMinke(Antarctica)Minke(Australia)Unknown #1a,2, 3, 4, 5, 6, 7, 8Minke(North Atlantic)Unknown #9Humpback(North Atlantic)Humpback(North Pacific)Unknown #1bGrayBlue(North Atlantic)Blue(North Pacific)Unknown #10,11, 12Unknown #13Fin(Mediterranean)Fin (Iceland)
Fig. 26-6aRESULTSMinke(Antarctica)Minke(Australia)Unknown #1a,2, 3, 4, 5, 6, 7, 8Minke(North Atlantic)Unknown #9
Fig. 26-6bHumpback(North Atlantic)Humpback(North Pacific)Unknown #1bGrayBlue(North Atlantic)Blue(North Pacific)
Fig. 26-6cUnknown #10,11, 12Unknown #13Fin(Mediterranean)Fin (Iceland)
• Phylogenies of anthrax bacteria helpedresearchers identify the source of a particularstrain of anthraxCopyright © 2008 Pearson Education, Inc., publishing as Pearson Benjamin Cummings
Fig. 26-UN1ABCBDCDCBD(a) (b) (c)AA
Concept 26.2: Phylogenies are inferred frommorphological and molecular data• To infer phylogenies, systematists gatherinformation about morphologies, genes, andbiochemistry of living organismsCopyright © 2008 Pearson Education, Inc., publishing as Pearson Benjamin Cummings
Morphological and Molecular Homologies• Organisms with similar morphologies or DNAsequences are likely to be more closely relatedthan organisms with different structures orsequencesCopyright © 2008 Pearson Education, Inc., publishing as Pearson Benjamin Cummings
Sorting Homology from Analogy• When constructing a phylogeny, systematistsneed to distinguish whether a similarity is theresult of homology or analogy• Homology is similarity due to shared ancestry• Analogy is similarity due to convergentevolutionCopyright © 2008 Pearson Education, Inc., publishing as Pearson Benjamin Cummings
Fig. 25-18Close North American relative,the tarweed Carlquistia muiriiDubautia laxaKAUAI5.1millionyearsMOLOKAI 1.3MAUI millionyearsOAHU3.7 LANAImillionyearsHAWAII0.4millionyearsArgyroxiphium sandwicenseDubautia waialealaeDubautia scabraDubautia linearis
Fig. 26-7
• Convergent evolution occurs when similarenvironmental pressures and natural selectionproduce similar (analogous) adaptations inorganisms from different evolutionary lineagesCopyright © 2008 Pearson Education, Inc., publishing as Pearson Benjamin Cummings
• Bat and bird wings are homologous asforelimbs, but analogous as functional wings• Analogous structures or molecular sequencesthat evolved independently are also calledhomoplasies• Homology can be distinguished from analogyby comparing fossil evidence and the degree ofcomplexity• The more complex two similar structures are,the more likely it is that they are homologousCopyright © 2008 Pearson Education, Inc., publishing as Pearson Benjamin Cummings
Evaluating Molecular Homologies• Systematists use computer programs andmathematical tools when analyzing comparableDNA segments from different organismsCopyright © 2008 Pearson Education, Inc., publishing as Pearson Benjamin Cummings
Fig. 26-812DeletionInsertion34
Fig. 26-8a12DeletionInsertion
Fig. 26-8b34
• It is also important to distinguish homologyfrom analogy in molecular similarities• Mathematical tools help to identify molecularhomoplasies, or coincidences• Molecular systematics uses DNA and othermolecular data to determine evolutionaryrelationshipsCopyright © 2008 Pearson Education, Inc., publishing as Pearson Benjamin Cummings
Fig. 26-9
Concept 26.3: Shared characters are used toconstruct phylogenetic trees• Once homologous characters have beenidentified, they can be used to infer aphylogenyCopyright © 2008 Pearson Education, Inc., publishing as Pearson Benjamin Cummings
Cladistics• Cladistics groups organisms by commondescent• A clade is a group of <strong>species</strong> that includes anancestral <strong>species</strong> and all its descendants• Clades can be nested in larger clades, but notall groupings of organisms qualify as cladesCopyright © 2008 Pearson Education, Inc., publishing as Pearson Benjamin Cummings
• A valid clade is monophyletic, signifying that itconsists of the ancestor <strong>species</strong> and all itsdescendantsCopyright © 2008 Pearson Education, Inc., publishing as Pearson Benjamin Cummings
Fig. 26-10A A ABGroup IBBC C CDDDE E Group IIEFFFGroup IIIG G G(a) Monophyletic group (clade) (b) Paraphyletic group (c) Polyphyletic group
Fig. 26-10aABGroup ICDEFG(a) Monophyletic group (clade)
• A paraphyletic grouping consists of anancestral <strong>species</strong> and some, but not all, of thedescendantsCopyright © 2008 Pearson Education, Inc., publishing as Pearson Benjamin Cummings
Fig. 26-10bABCDEGroup IIFG(b) Paraphyletic group
• A polyphyletic grouping consists of various<strong>species</strong> that lack a common ancestorCopyright © 2008 Pearson Education, Inc., publishing as Pearson Benjamin Cummings
Fig. 26-10cABCDEGroup IIIFG(c) Polyphyletic group
Shared Ancestral and Shared Derived Characters• In comparison with its ancestor, an organismhas both shared and different characteristicsCopyright © 2008 Pearson Education, Inc., publishing as Pearson Benjamin Cummings
• A shared ancestral character is a characterthat originated in an ancestor of the taxon• A shared derived character is an evolutionarynovelty unique to a particular clade• A character can be both ancestral and derived,depending on the contextCopyright © 2008 Pearson Education, Inc., publishing as Pearson Benjamin Cummings
Inferring Phylogenies Using Derived Characters• When inferring evolutionary relationships, it isuseful to know in which clade a shared derivedcharacter first appearedCopyright © 2008 Pearson Education, Inc., publishing as Pearson Benjamin Cummings
Fig. 26-11TurtleLancelet(outgroup)TunaTAXASalamanderLeopardLancelet(outgroup)LampreyLampreyCHARACTERSVertebral column(backbone)Hinged jawsFour walking legsAmniotic (shelled) egg001011110000001011111111VertebralcolumnHinged jawsFour walking legsTunaSalamanderTurtleHair000 0 0 1Amniotic eggHairLeopard(a) Character table(b) Phylogenetic tree
TurtleFig. 26-11aTAXATunaSalamanderLeopardLancelet(outgroup)LampreyVertebral column(backbone)011111CHARACTERSHinged jawsFour walking legsAmniotic (shelled) egg0 0 1 10 0 0 10 0 0 0111111Hair000 0 0 1(a) Character table
Fig. 26-11bLancelet(outgroup)LampreyVertebralcolumnHinged jawsFour walking legsTunaSalamanderTurtleAmniotic egg(b) Phylogenetic treeHairLeopard
• An outgroup is a <strong>species</strong> or group of <strong>species</strong>that is closely related to the ingroup, thevarious <strong>species</strong> being studied• Systematists compare each ingroup <strong>species</strong>with the outgroup to differentiate betweenshared derived and shared ancestralcharacteristicsCopyright © 2008 Pearson Education, Inc., publishing as Pearson Benjamin Cummings
• Homologies shared by the outgroup andingroup are ancestral characters that predatethe divergence of both groups from a commonancestorCopyright © 2008 Pearson Education, Inc., publishing as Pearson Benjamin Cummings
Phylogenetic Trees with Proportional BranchLengths• In some trees, the length of a branch canreflect the number of genetic changes thathave taken place in a particular DNA sequencein that lineageCopyright © 2008 Pearson Education, Inc., publishing as Pearson Benjamin Cummings
Fig. 26-12DrosophilaLanceletZebrafishFrogChickenHumanMouse
• In other trees, branch length can representchronological time, and branching points canbe determined from the fossil recordCopyright © 2008 Pearson Education, Inc., publishing as Pearson Benjamin Cummings
Fig. 26-13DrosophilaLanceletZebrafishFrogChickenHumanMousePALEOZOICMESOZOICCENOZOIC542251Millions of years ago65.5Present
Maximum Parsimony and Maximum Likelihood• Systematists can never be sure of finding thebest tree in a large data set• They narrow possibilities by applying theprinciples of maximum parsimony andmaximum likelihoodCopyright © 2008 Pearson Education, Inc., publishing as Pearson Benjamin Cummings
• Maximum parsimony assumes that the treethat requires the fewest evolutionary events(appearances of shared derived characters) isthe most likely• The principle of maximum likelihood statesthat, given certain rules about how DNAchanges over time, a tree can be found thatreflects the most likely sequence ofevolutionary eventsCopyright © 2008 Pearson Education, Inc., publishing as Pearson Benjamin Cummings
Fig. 26-14HumanMushroomTulipHuman030%40%Mushroom040%Tulip0(a) Percentage differences between sequences15%5%5%15% 15%10%20%25%Tree 1: More likely(b) Comparison of possible treesTree 2: Less likely
Fig. 26-14aHumanMushroomTulipHuman 030%40%Mushroom040%Tulip0(a) Percentage differences between sequences
Fig. 26-14b15%5%5%15% 15%10%20%25%Tree 1: More likely(b) Comparison of possible treesTree 2: Less likely
• Computer programs are used to search fortrees that are parsimonious and likelyCopyright © 2008 Pearson Education, Inc., publishing as Pearson Benjamin Cummings
Fig. 26-15-1Species ISpecies IISpecies IIIThree phylogenetic hypotheses:IIIIIIIIIIIIIIIIII
Fig. 26-15-2Species I1CSite2 3T A4T1/CI1/CIIIISpecies IISpecies IIIAncestralsequenceCAATGGTATCCTIIIII1/CIIIII1/C1/CIII
Fig. 26-15-3Species ISiteSpecies IISpecies IIIIIIIIIIIIIIIIIIIIIAncestralsequence1/C1/C1/C1/C1/C4321CCCCTTTTTTAAAAGGIIIIIIIIIIIIIIIIII3/A3/A3/A3/A3/A2/T2/T2/T 2/T2/T4/C4/C4/C4/C4/C
Fig. 26-15-4Species I1CSite2 3T A4T1/CI1/CIIIISpecies IISpecies IIIAncestralsequenceCAATGGTATCCTIIIII1/CIIIII1/C1/CIII2/T3/AI3/A2/TI4/C3/AIII4/C3/A 4/CIIIIIIII4/CII2/T 4/C2/T2/T3/AIIIIIIIIIIIIIIIIIIIII6 events7 events7 events
Phylogenetic Trees as Hypotheses• The best hypotheses for phylogenetic trees fitthe most data: morphological, molecular, andfossil• Phylogenetic bracketing allows us to predictfeatures of an ancestor from features of itsdescendentsCopyright © 2008 Pearson Education, Inc., publishing as Pearson Benjamin Cummings
Fig. 26-16Lizardsand snakesCrocodiliansCommonancestor ofcrocodilians,dinosaurs,and birdsOrnithischiandinosaursSaurischiandinosaursBirds
• This has been applied to infer features ofdinosaurs from their descendents: birds andcrocodilesAnimation: The Geologic RecordCopyright © 2008 Pearson Education, Inc., publishing as Pearson Benjamin Cummings
Fig. 26-17Front limbHind limbEggs(a) Fossil remains of Oviraptorand eggs(b) Artist’s reconstruction of the dinosaur’s posture
Fig. 26-17aFront limbHind limbEggs(a) Fossil remains of Oviraptorand eggs
Fig. 26-17b(b) Artist’s reconstruction of the dinosaur’s posture
Concept 26.4: An organism’s evolutionary historyis documented in its genome• Comparing nucleic acids or other molecules toinfer relatedness is a valuable tool for tracingorganisms’ evolutionary history• DNA that codes for rRNA changes relativelyslowly and is useful for investigating branchingpoints hundreds of millions of years ago• mtDNA evolves rapidly and can be used toexplore recent evolutionary eventsCopyright © 2008 Pearson Education, Inc., publishing as Pearson Benjamin Cummings
Gene Duplications and Gene Families• Gene duplication increases the number ofgenes in the genome, providing moreopportunities for evolutionary changes• Like homologous genes, duplicated genes canbe traced to a common ancestorCopyright © 2008 Pearson Education, Inc., publishing as Pearson Benjamin Cummings
• Orthologous genes are found in a single copyin the genome and are homologous between<strong>species</strong>• They can diverge only after speciation occursCopyright © 2008 Pearson Education, Inc., publishing as Pearson Benjamin Cummings
• Paralogous genes result from geneduplication, so are found in more than onecopy in the genome• They can diverge within the clade that carriesthem and often evolve new functionsCopyright © 2008 Pearson Education, Inc., publishing as Pearson Benjamin Cummings
Fig. 26-18Ancestral geneAncestral <strong>species</strong>Speciation withdivergence of geneSpecies A(a) Orthologous genesOrthologous genesSpecies BSpecies AGene duplication and divergence(b) Paralogous genesParalogous genesSpecies A after many generations
Fig. 26-18aAncestral geneAncestral <strong>species</strong>Speciation withdivergence of geneSpecies A(a) Orthologous genesOrthologous genesSpecies B
Fig. 26-18bSpecies AGene duplication and divergence(b) Paralogous genesParalogous genesSpecies A after many generations
Genome Evolution• Orthologous genes are widespread and extendacross many widely varied <strong>species</strong>• Gene number and the complexity of anorganism are not strongly linked• Genes in complex organisms appear to be veryversatile and each gene can perform manyfunctionsCopyright © 2008 Pearson Education, Inc., publishing as Pearson Benjamin Cummings
Concept 26.5: Molecular clocks help trackevolutionary time• To extend molecular phylogenies beyond thefossil record, we must make an assumptionabout how change occurs over timeCopyright © 2008 Pearson Education, Inc., publishing as Pearson Benjamin Cummings
Molecular Clocks• A molecular clock uses constant rates ofevolution in some genes to estimate theabsolute time of evolutionary change• In orthologous genes, nucleotide substitutionsare proportional to the time since they lastshared a common ancestor• In paralogous genes, nucleotide substitutionsare proportional to the time since the genesbecame duplicatedCopyright © 2008 Pearson Education, Inc., publishing as Pearson Benjamin Cummings
• Molecular clocks are calibrated againstbranches whose dates are known from thefossil recordCopyright © 2008 Pearson Education, Inc., publishing as Pearson Benjamin Cummings
Fig. 26-1990Number of mutations60300030 60 90Divergence time (millions of years)120
Neutral Theory• Neutral theory states that much evolutionarychange in genes and proteins has no effect onfitness and therefore is not influenced byDarwinian selection• It states that the rate of molecular change inthese genes and proteins should be regular likea clockCopyright © 2008 Pearson Education, Inc., publishing as Pearson Benjamin Cummings
Difficulties with Molecular Clocks• The molecular clock does not run as smoothly asneutral theory predicts• Irregularities result from natural selection inwhich some DNA changes are favored overothers• Estimates of evolutionary divergences older thanthe fossil record have a high degree ofuncertainty• The use of multiple genes may improveestimatesCopyright © 2008 Pearson Education, Inc., publishing as Pearson Benjamin Cummings
Applying a Molecular Clock: The Origin of HIV• Phylogenetic analysis shows that HIV isdescended from viruses that infectchimpanzees and other primates• Comparison of HIV samples throughout theepidemic shows that the virus evolved in a veryclocklike way• Application of a molecular clock to one strain ofHIV suggests that that strain spread to humansduring the 1930sCopyright © 2008 Pearson Education, Inc., publishing as Pearson Benjamin Cummings
Fig. 26-20Index of base changes between HIV sequences1980 20000.200.150.100.0501900Computer modelof HIV1920 1940Year1960Range
Concept 26.6: New information continues to reviseour understanding of the tree of life• Recently, we have gained insight into the verydeepest branches of the tree of life throughmolecular systematicsCopyright © 2008 Pearson Education, Inc., publishing as Pearson Benjamin Cummings
From Two Kingdoms to Three Domains• Early taxonomists classified all <strong>species</strong> as eitherplants or animals• Later, five kingdoms were recognized: Monera(prokaryotes), Protista, Plantae, Fungi, andAnimalia• More recently, the three-domain system hasbeen adopted: Bacteria, Archaea, and Eukarya• The three-domain system is supported by datafrom many sequenced genomesAnimation: Classification SchemesCopyright © 2008 Pearson Education, Inc., publishing as Pearson Benjamin Cummings
Fig. 26-21EUKARYALand plantsDinoflagellatesGreen algaeForamsCiliates DiatomsRed algaeAmoebasCellular slime moldsAnimalsFungiEuglenaTrypanosomesLeishmaniaThermophilesSulfolobusGreen nonsulfur bacteria(Mitochondrion)HalophilesMethanobacteriumARCHAEACOMMONANCESTOROF ALLLIFESpirochetesChlamydiaGreensulfur bacteriaCyanobacteria(Plastids, includingchloroplasts)BACTERIA
Fig. 26-21aGreen nonsulfur bacteria(Mitochondrion)SpirochetesCOMMONANCESTOROF ALLLIFEGreensulfur bacteriaChlamydiaBACTERIACyanobacteria(Plastids, includingchloroplasts)
Fig. 26-21bSulfolobusThermophilesHalophilesMethanobacteriumARCHAEA
Fig. 26-21cEUKARYALand plantsDinoflagellatesGreen algaeForamsCiliates DiatomsRed algaeAmoebasCellular slime moldsAnimalsFungiEuglenaTrypanosomesLeishmania
A Simple Tree of All Life• The tree of life suggests that eukaryotes andarchaea are more closely related to each otherthan to bacteria• The tree of life is based largely on rRNA genes,as these have evolved slowlyCopyright © 2008 Pearson Education, Inc., publishing as Pearson Benjamin Cummings
• There have been substantial interchanges ofgenes between organisms in different domains• Horizontal gene transfer is the movement ofgenes from one genome to another• Horizontal gene transfer complicates efforts tobuild a tree of lifeCopyright © 2008 Pearson Education, Inc., publishing as Pearson Benjamin Cummings
Fig. 26-22BacteriaEukaryaArchaea4 32 1 0Billions of years ago
Is the Tree of Life Really a Ring?• Some researchers suggest that eukaryotesarose as an endosymbiosis between abacterium and archaean• If so, early evolutionary relationships might bebetter depicted by a ring of life instead of a treeof lifeCopyright © 2008 Pearson Education, Inc., publishing as Pearson Benjamin Cummings
Fig. 26-23EukaryaBacteriaArchaea
You should now be able to:1. Explain the justification for taxonomy based on aPhyloCode2. Explain the importance of distinguishing betweenhomology and analogy3. Distinguish between the following terms:monophyletic, paraphyletic, and polyphyleticgroups; shared ancestral and shared derivedcharacters; orthologous and paralogous genesCopyright © 2008 Pearson Education, Inc., publishing as Pearson Benjamin Cummings
4. Define horizontal gene transfer and explainhow it complicates phylogenetic trees5. Explain molecular clocks and discuss theirlimitationsCopyright © 2008 Pearson Education, Inc., publishing as Pearson Benjamin Cummings