Surface Water Interaction Modelling Using Visual MODFLOW and GIS
Surface Water Interaction Modelling Using Visual MODFLOW and GIS
Surface Water Interaction Modelling Using Visual MODFLOW and GIS
- No tags were found...

You also want an ePaper? Increase the reach of your titles
YUMPU automatically turns print PDFs into web optimized ePapers that Google loves.
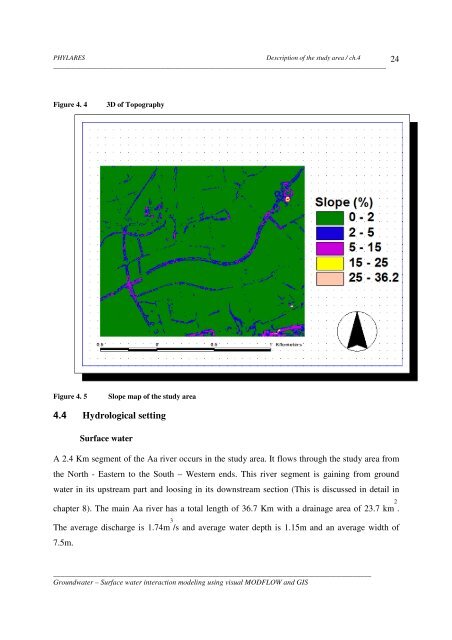
PHYLARESDescription of the study area / ch.4__________________________________________________________________________________________24Figure 4. 43D of TopographyFigure 4. 5Slope map of the study area4.4 Hydrological setting<strong>Surface</strong> waterA 2.4 Km segment of the Aa river occurs in the study area. It flows through the study area fromthe North - Eastern to the South – Western ends. This river segment is gaining from groundwater in its upstream part <strong>and</strong> loosing in its downstream section (This is discussed in detail inchapter 8). The main Aa river has a total length of 36.7 Km with a drainage area of 23.7 km 2 .The average discharge is 1.74m 3 /s <strong>and</strong> average water depth is 1.15m <strong>and</strong> an average width of7.5m.______________________________________________________________________________________Groundwater – <strong>Surface</strong> water interaction modeling using visual <strong>MODFLOW</strong> <strong>and</strong> <strong>GIS</strong>