Surface Water Interaction Modelling Using Visual MODFLOW and GIS
Surface Water Interaction Modelling Using Visual MODFLOW and GIS
Surface Water Interaction Modelling Using Visual MODFLOW and GIS
- No tags were found...

You also want an ePaper? Increase the reach of your titles
YUMPU automatically turns print PDFs into web optimized ePapers that Google loves.
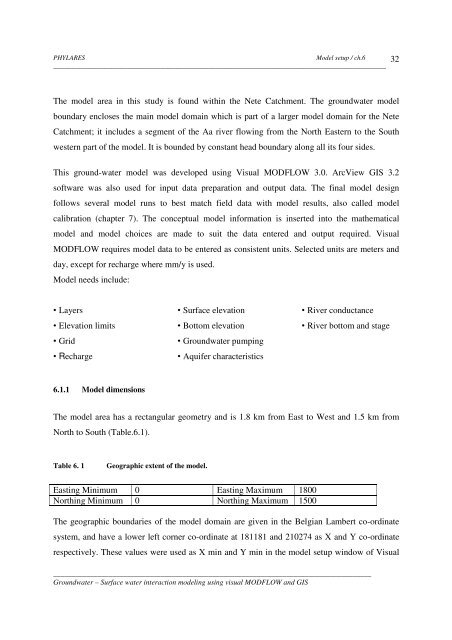
PHYLARESModel setup / ch.6__________________________________________________________________________________________32The model area in this study is found within the Nete Catchment. The groundwater modelboundary encloses the main model domain which is part of a larger model domain for the NeteCatchment; it includes a segment of the Aa river flowing from the North Eastern to the Southwestern part of the model. It is bounded by constant head boundary along all its four sides.This ground-water model was developed using <strong>Visual</strong> <strong>MODFLOW</strong> 3.0. ArcView <strong>GIS</strong> 3.2software was also used for input data preparation <strong>and</strong> output data. The final model designfollows several model runs to best match field data with model results, also called modelcalibration (chapter 7). The conceptual model information is inserted into the mathematicalmodel <strong>and</strong> model choices are made to suit the data entered <strong>and</strong> output required. <strong>Visual</strong><strong>MODFLOW</strong> requires model data to be entered as consistent units. Selected units are meters <strong>and</strong>day, except for recharge where mm/y is used.Model needs include:• Layers• Elevation limits• Grid• Recharge• <strong>Surface</strong> elevation• Bottom elevation• Groundwater pumping• Aquifer characteristics• River conductance• River bottom <strong>and</strong> stage6.1.1 Model dimensionsThe model area has a rectangular geometry <strong>and</strong> is 1.8 km from East to West <strong>and</strong> 1.5 km fromNorth to South (Table.6.1).Table 6. 1Geographic extent of the model.Easting Minimum 0 Easting Maximum 1800Northing Minimum 0 Northing Maximum 1500The geographic boundaries of the model domain are given in the Belgian Lambert co-ordinatesystem, <strong>and</strong> have a lower left corner co-ordinate at 181181 <strong>and</strong> 210274 as X <strong>and</strong> Y co-ordinaterespectively. These values were used as X min <strong>and</strong> Y min in the model setup window of <strong>Visual</strong>______________________________________________________________________________________Groundwater – <strong>Surface</strong> water interaction modeling using visual <strong>MODFLOW</strong> <strong>and</strong> <strong>GIS</strong>