2013 - ICC India
2013 - ICC India
2013 - ICC India
- No tags were found...

You also want an ePaper? Increase the reach of your titles
YUMPU automatically turns print PDFs into web optimized ePapers that Google loves.
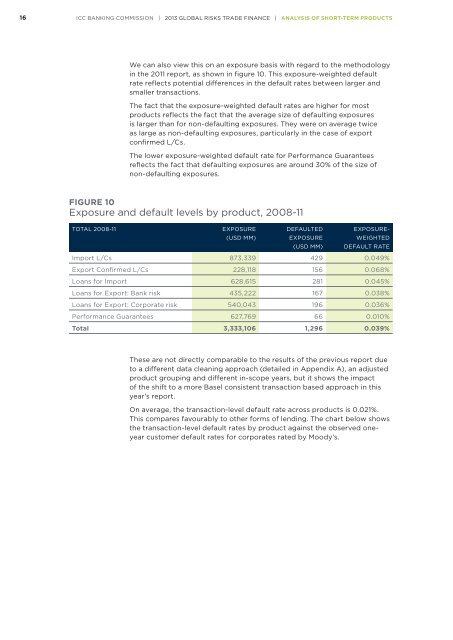
16<strong>ICC</strong> BANKING COMMISSION | <strong>2013</strong> GLOBAL RISKS TRADE FINANCE | ANALYSIS OF SHORT-TERM PRODUCTSWe can also view this on an exposure basis with regard to the methodologyin the 2011 report, as shown in figure 10. This exposure-weighted defaultrate reflects potential differences in the default rates between larger andsmaller transactions.The fact that the exposure-weighted default rates are higher for mostproducts reflects the fact that the average size of defaulting exposuresis larger than for non-defaulting exposures. They were on average twiceas large as non-defaulting exposures, particularly in the case of exportconfirmed L/Cs.The lower exposure-weighted default rate for Performance Guaranteesreflects the fact that defaulting exposures are around 30% of the size ofnon-defaulting exposures.FIGURE 10Exposure and default levels by product, 2008-11TOTAL 2008-11EXPOSURE(USD MM)DEFAULTEDEXPOSURE(USD MM)EXPOSURE-WEIGHTEDDEFAULT RATEImport L/Cs 873,339 429 0.049%Export Confirmed L/Cs 228,118 156 0.068%Loans for Import 628,615 281 0.045%Loans for Export: Bank risk 435,222 167 0.038%Loans for Export: Corporate risk 540,043 196 0.036%Performance Guarantees 627,769 66 0.010%Total 3,333,106 1,296 0.039%These are not directly comparable to the results of the previous report dueto a different data cleaning approach (detailed in Appendix A), an adjustedproduct grouping and different in-scope years, but it shows the impactof the shift to a more Basel consistent transaction based approach in thisyear’s report.On average, the transaction-level default rate across products is 0.021%.This compares favourably to other forms of lending. The chart below showsthe transaction-level default rates by product against the observed oneyearcustomer default rates for corporates rated by Moody’s.