2013 - ICC India
2013 - ICC India
2013 - ICC India
- No tags were found...

Create successful ePaper yourself
Turn your PDF publications into a flip-book with our unique Google optimized e-Paper software.
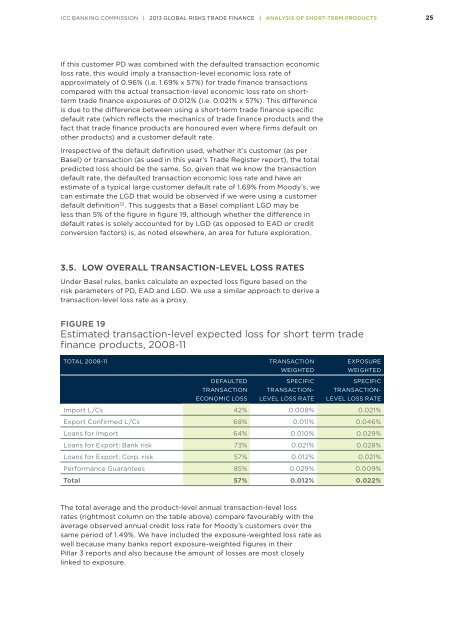
<strong>ICC</strong> BANKING COMMISSION | <strong>2013</strong> GLOBAL RISKS TRADE FINANCE | ANALYSIS OF SHORT-TERM PRODUCTS 25If this customer PD was combined with the defaulted transaction economicloss rate, this would imply a transaction-level economic loss rate ofapproximately of 0.96% (i.e. 1.69% x 57%) for trade finance transactionscompared with the actual transaction-level economic loss rate on shorttermtrade finance exposures of 0.012% (i.e. 0.021% x 57%). This differenceis due to the difference between using a short-term trade finance specificdefault rate (which reflects the mechanics of trade finance products and thefact that trade finance products are honoured even where firms default onother products) and a customer default rate.Irrespective of the default definition used, whether it’s customer (as perBasel) or transaction (as used in this year’s Trade Register report), the totalpredicted loss should be the same. So, given that we know the transactiondefault rate, the defaulted transaction economic loss rate and have anestimate of a typical large customer default rate of 1.69% from Moody’s, wecan estimate the LGD that would be observed if we were using a customerdefault definition 32 . This suggests that a Basel compliant LGD may beless than 5% of the figure in figure 19, although whether the difference indefault rates is solely accounted for by LGD (as opposed to EAD or creditconversion factors) is, as noted elsewhere, an area for future exploration.3.5. LOW OVERALL TRANSACTION-LEVEL LOSS RATESUnder Basel rules, banks calculate an expected loss figure based on therisk parameters of PD, EAD and LGD. We use a similar approach to derive atransaction-level loss rate as a proxy.FIGURE 19Estimated transaction-level expected loss for short term tradefinance products, 2008-11TOTAL 2008-11DEFAULTEDTRANSACTIONECONOMIC LOSSTRANSACTIONWEIGHTEDEXPOSUREWEIGHTEDSPECIFICTRANSACTION-LEVEL LOSS RATESPECIFICTRANSACTION-LEVEL LOSS RATEImport L/Cs 42% 0.008% 0.021%Export Confirmed L/Cs 68% 0.011% 0.046%Loans for Import 64% 0.010% 0.029%Loans for Export: Bank risk 73% 0.021% 0.028%Loans for Export: Corp. risk 57% 0.012% 0.021%Performance Guarantees 85% 0.029% 0.009%Total 57% 0.012% 0.022%The total average and the product-level annual transaction-level lossrates (rightmost column on the table above) compare favourably with theaverage observed annual credit loss rate for Moody’s customers over thesame period of 1.49%. We have included the exposure-weighted loss rate aswell because many banks report exposure-weighted figures in theirPillar 3 reports and also because the amount of losses are most closelylinked to exposure.