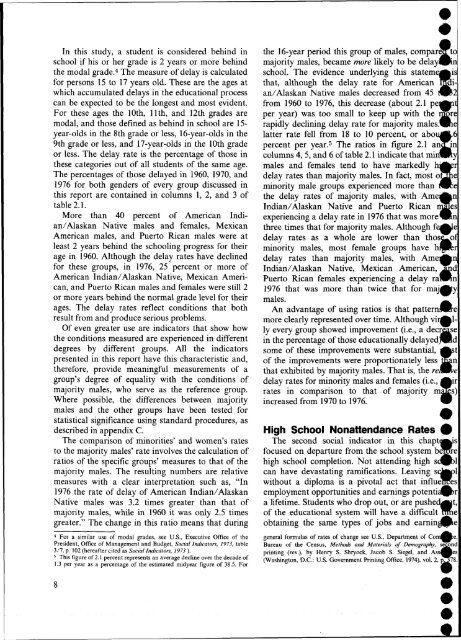
In this study, a student is considered behind inschool if his or her grade is 2 years or more behindthe modal grade. 4 The measure <strong>of</strong> delay is calculated<strong>for</strong> persons 15 to 17 years old. These are the ages atwhich accumulated delays in the educational processcan be expected to be the longest <strong>and</strong> most evident.For these ages the 10th, 11th, <strong>and</strong> 12th grades aremodal, <strong>and</strong> those defined as behind in school are 15-year-olds in the 8th grade or less, 16-year-olds in the9th grade or less, <strong>and</strong> 17-year-olds in the 10th gradeor less. The delay rate is the percentage <strong>of</strong> those inthese categories out <strong>of</strong> all students <strong>of</strong> the same age.The percentages <strong>of</strong> those delayed in 1960, 1970, <strong>and</strong>1976 <strong>for</strong> both genders <strong>of</strong> every group discussed inthis report are contained in columns 1, 2, <strong>and</strong> 3 <strong>of</strong>table 2.1.More than 40 percent <strong>of</strong> American Indian/AlaskanNative males <strong>and</strong> females, MexicanAmerican males, <strong>and</strong> Puerto Rican males were atleast 2 years behind the schooling progress <strong>for</strong> theirage in 1960. Although the delay rates have declined<strong>for</strong> these groups, in 1976, 25 percent or more <strong>of</strong>American Indian/Alaskan Native, Mexican American,<strong>and</strong> Puerto Rican males <strong>and</strong> females were still 2or more years behind the normal grade level <strong>for</strong> theirages. The delay rates reflect conditions that bothresult from <strong>and</strong> produce serious problems.Of even greater use are indicators that show howthe conditions measured are experienced in differentdegrees by different groups. All the indicatorspresented in this report have this characteristic <strong>and</strong>,there<strong>for</strong>e, provide meaningful measurements <strong>of</strong> agroup's degree <strong>of</strong> equality with the conditions <strong>of</strong>majority males, who serve as the reference group.Where possible, the differences between majoritymales <strong>and</strong> the other groups have been tested <strong>for</strong>statistical significance using st<strong>and</strong>ard procedures, asdescribed in appendix C.The comparison <strong>of</strong> minorities' <strong>and</strong> women's ratesto the majority males' rate involves the calculation <strong>of</strong>ratios <strong>of</strong> the specific groups' measures to that <strong>of</strong> themajority males. The resulting numbers are relativemeasures with a clear interpretation such as, "In1976 the rate <strong>of</strong> delay <strong>of</strong> American Indian/AlaskanNative males was 3.2 times greater than that <strong>of</strong>majority males, while in 1960 it was only 2.5 timesgreater." The change in this ratio means that during4 For a similar use <strong>of</strong> modal grades, see U.S., Executive Office <strong>of</strong> thePresident, Office <strong>of</strong> Management <strong>and</strong> Budget, <strong>Social</strong> <strong>Indicators</strong>, 1973, table3/7, p. 102 (hereafter cited as <strong>Social</strong> <strong>Indicators</strong>, 1973 ).5 This figure <strong>of</strong> 2.1 percent represents an average decline over the decade <strong>of</strong>1.3 per year as a percentage <strong>of</strong> the estimated midyear figure <strong>of</strong> 38.5. Forthe 16-year period this group <strong>of</strong> males, compare r^tmajority males, became more likely to be delaym to nschool. The evidence underlying this statem isthat, although the delay rate <strong>for</strong> American i-an/Alaskan Native males decreased from 45 2from 1960 to 1976, this decrease (about 2.1 pe tper year) was too small to keep up with the rerapidly declining delay rate <strong>for</strong> majority males. 1elatter rate fell from 18 to 10 percent, or abo 6percent per year. 5 The ratios in figure 2.1 an mcolumns 4, 5, <strong>and</strong> 6 <strong>of</strong> table 2.1 indicate that mini ymales <strong>and</strong> females tend to have markedly hjjdelay rates than majority males. In fact, most o: eminority male groups experienced more than ethe delay rates <strong>of</strong> majority males, with Ame nIndian/Alaskan Native <strong>and</strong> Puerto Rican esexperiencing a delay rate in 1976 that was more nthree times that <strong>for</strong> majority males. Althoughdelay rates as a whole are lower than thos
;ame incomes as those who complete their highICJPOI education. 6fe term "dropout" may be inappropriate <strong>for</strong> thisdeparture, since the implication is that theidual student took the initiative <strong>and</strong> "dropped|k <strong>of</strong> the educational system to spend his or herW at other, more highly valued activities. Some-)s the term "push-out" is more appropriate»use it focuses attention <strong>and</strong> responsibility on therool system itself <strong>for</strong> a student's failure to attain aP school education. 7 Regardless <strong>of</strong> why students^ot attend or finish high school, the consequences, if ever, desirable <strong>for</strong> either the individualsNation.nonattendance rate could signal a need <strong>for</strong>;cWective action. If nonattendance is concentratedr^prtain groups, then ef<strong>for</strong>ts to reduce nonattenecould be directed toward the needs <strong>of</strong> thoseps in order to deal most effectively with the)^Jlem. The second indicator in this series provideshak kind <strong>of</strong> in<strong>for</strong>mation. As with the previousnro;ator, this one is based on 15- to 17-year-olds. Intl^case, the nonattendance indicator reflects thePOiientage <strong>of</strong> the high school age group that is notlied in school; the actual indicator is the ratio <strong>of</strong>tfl^ninority percentage to the majority percentage,in<strong>for</strong>mation on nonattendance is contained in2.2 <strong>and</strong> figure 2.2.e indicator values show that minority groupnumbers are less likely than majority males to attendscWol during the important ages <strong>of</strong> 15 to 17.^Pough most groups have reduced their nonatteniamcQrates since 1960 <strong>and</strong> even since 1970, relative(^majority males many <strong>of</strong> the groups have notr^poved their likelihood <strong>of</strong> being in school. Fore^tfiple, in 1976 Mexican American females werenwe than twice as likely to be out <strong>of</strong> school asmales; this represented an increase <strong>of</strong> morethj| 40 percent over the 1970 ratio <strong>of</strong> the two groups.A^rerican Indian/Alaskan Native males <strong>and</strong> femaleslot noticeably reduce their nonattendance ratesbjg|een 1970 <strong>and</strong> 1976 while majority males reducednws by more than a third. Thus, the relativeAfrican Indian/Alaskan Native nonattendanceincreased appreciably. By 1976 AmericanInWan/Alaskan Native males were 2.80 times <strong>and</strong>African Indian/Alaskan Native females 3.00 timesstopher Lasch, "Inequality <strong>and</strong> Education," in The "Inequality"CblWoversy, edited by Mary Jo Bane <strong>and</strong> Donald M. Levine (New York:Cooks, 1975), pp. 45-62."dren's Defense Fund, Children Out <strong>of</strong> School in America (Cambridge,* Children's Defense Fund, 1974), p. 17.as likely as majority males not to be enrolled in highschool.By itself, a high nonattendance rate damageschildren by limiting their exposure to academicinstruction; however, an additional <strong>and</strong> more devastatingspin<strong>of</strong>f is the negative influence on educationalattainment, which in turn tends to restrict lifelongsocial <strong>and</strong> economic st<strong>and</strong>ing. The remaining indicators<strong>of</strong> equality in this chapter measure suchconsequences <strong>of</strong> the disproportionate nonattendancerates <strong>of</strong> minorities <strong>and</strong> women.Educational AttainmentThe third indicator in this series extends the ideabehind the delayed education indicator <strong>and</strong> thenonattendance indicator to the issue <strong>of</strong> educationalattainment. Some very common categories used todistinguish different levels <strong>of</strong> attainment are "highschool diploma," "some college," <strong>and</strong> "4-year collegedegree." The social condition reflected in this idea <strong>of</strong>attainment is the amount <strong>of</strong> time spent in <strong>for</strong>maleducation settings. As will be demonstrated later, thisinvestment <strong>of</strong> time in education is directly related tosubsequent levels <strong>of</strong> earnings <strong>and</strong> types <strong>of</strong> occupations.The amount <strong>of</strong> time spent in the educationalprocess has been exp<strong>and</strong>ing considerably <strong>for</strong> at leastas long as such statistics have been collected. Thepercentage <strong>of</strong> 17-year-olds who were high schoolgraduates was about 2 percent in 1870 <strong>and</strong> has grownsteadily to about 80 percent in the 1970s. 8 Inaddition to the increase in years <strong>of</strong> schooling, theschool year itself has exp<strong>and</strong>ed. About 34 additionaldays have been added to the usual school year sincethe start <strong>of</strong> this century. 9For the purposes <strong>of</strong> this study, the central issuehere is whether women <strong>and</strong> minority males achievethe same levels <strong>of</strong> educational attainment as majoritymales <strong>and</strong>, if not, whether the gap in educationalattainment between majority males <strong>and</strong> the rest <strong>of</strong>society has increased or decreased. To measure this,two separate social indicators have been developedbased on high school completion <strong>and</strong> completion <strong>of</strong>4 or more years <strong>of</strong> college.Selecting the age group <strong>for</strong> measuring these twoeducational characteristics has important consequences.The more common technique has been to8 U.S., Department <strong>of</strong> Commerce, Bureau <strong>of</strong> the Census, HistoricalStatistics <strong>of</strong> the United States, Colonial Times to 1970, Bicentennial Edition,part 1(1975), p. 379.9 U.S., Department <strong>of</strong> Health, Education, <strong>and</strong> Welfare, Toward A <strong>Social</strong>9 9 6 5
- Page 1 and 2: Thurgood Marshall Law LibraryThe Un
- Page 5: Letter of TransmittalU.S. COMMISSIO
- Page 8 and 9: Contents1. Introduction 12. Educati
- Page 11 and 12: CJupter 1Introductionr stematic eva
- Page 13 and 14: nWiave different geographic distrib
- Page 15 and 16: Craipter 2lucation/, education is p
- Page 17: Social Indicator Values: Ratios of
- Page 21 and 22: Social Indicator Values: Ratios of
- Page 23 and 24: Social Indicator Values: Ratios of
- Page 25 and 26: Social Indicator Values: Ratios of
- Page 27 and 28: ;orae consequences of educational a
- Page 29 and 30: catiSocial Indicator Values: Ratios
- Page 31 and 32: Social Indicator Values: Ratios of
- Page 33 and 34: Earnings$16,000"Majority Males14,00
- Page 35 and 36: Social Indicator Values: Ratios of
- Page 37 and 38: suWeed in completing a college educ
- Page 39 and 40: number of persons who were not work
- Page 41 and 42: Social Indicator Values: Ratios of
- Page 43 and 44: Social Indicator Values: Ratios of
- Page 45 and 46: cupationTABLE 3.3Prestige Scores fo
- Page 47 and 48: Social Indicator Values: Ratios of
- Page 49 and 50: :fflmge that do not in fact indicat
- Page 51 and 52: Social Indicator Values: Ratios of
- Page 53 and 54: Compared with majority males.! Male
- Page 55 and 56: some groups, the dissimilarity was
- Page 57 and 58: #(Mipter 4Income and Povertybased o
- Page 59 and 60: TABLE 4.1Median Income of Families:
- Page 61 and 62: Social Indicator Values: Ratios of
- Page 63 and 64: smre the ratio was higher at 0.52 i
- Page 65 and 66: Earnings Ralros for Adjusted(group/
- Page 67 and 68: Earnings$16,000^Majority Males14,00
- Page 69 and 70:
InSocial Indicator Values: Ratios o
- Page 71 and 72:
TABLE 4.5erty Cutoffs in 1975 by Se
- Page 73 and 74:
Familiesand UnrelatedIndividualsAme
- Page 75 and 76:
alWus government programs. If the P
- Page 77 and 78:
Carter 5MousingWK statistical repor
- Page 79 and 80:
filar climate and housing market) a
- Page 81 and 82:
i uSocial Indicator Values: Ratios
- Page 83 and 84:
Social Indicator Values: Ratios of
- Page 85 and 86:
in the other housing indicators, mi
- Page 87 and 88:
All Households-Renter OccupiedAmer.
- Page 89 and 90:
general, minority homeowners were m
- Page 91 and 92:
Social Indicator Values: Ratios of
- Page 93 and 94:
Social Indicator Values: Ratios of
- Page 95 and 96:
about one-half to two-thirds as lik
- Page 97 and 98:
mal tables that made up the primary
- Page 99 and 100:
stments to them. Through these indi
- Page 101 and 102:
IIT^) 1anpmeownership. Homes of maj
- Page 103 and 104:
g on the work begun in the Commerce
- Page 105 and 106:
Ed. PrestigeOccupational Title Req.
- Page 107 and 108:
21HsusWe Occupational Title«5 Insp
- Page 109 and 110:
nsus Ed. Prestigeode Occupational T
- Page 111 and 112:
susde Occupational Title|63 Sewers
- Page 113 and 114:
Occupational TitleGanged Occupation
- Page 115 and 116:
$364.62 will be added to the estima
- Page 117 and 118:
GroupFemaleConstantBAgeBSchoolYBPre
- Page 119 and 120:
"majority" was identified as the po
- Page 121 and 122:
Number of Cases for Each Social Ind
- Page 123 and 124:
INCOME AND POVERTYGroupTextTableSoc
- Page 125 and 126:
Number of Unweighted Cases for Each
- Page 127 and 128:
TABLE C-2Standard Deviations for Pr
- Page 129 and 130:
flrrnings Differential for College-
- Page 131 and 132:
trP persons would have less income
- Page 133 and 134:
Part II:Computer ProgramsFOLLOWING
- Page 135 and 136:
I FORMAT(1X,2A4,A2,I4,1X,2I4)f1 WKE
- Page 137 and 138:
T MEDIUMCASESCATEE LABELSHOURS1 55-
- Page 139 and 140:
IIMENT(FOR NON-HEAD TO INSURE RIGHT
- Page 141 and 142:
INTEGER OCC,SEX,AGE,IDDIMENSION X(1
- Page 143 and 144:
(SET EQ 4) G4 = 1.0(SET EQ 5) G5 =
- Page 145 and 146:
STATE(43)=22.99STATE(81)=3.42STATE(
- Page 148:
U. S. COMMISSION ON CIVIL RIGHTSWAS


