Social Indicators of Equality for Minorities and Women - University of ...
Social Indicators of Equality for Minorities and Women - University of ...
Social Indicators of Equality for Minorities and Women - University of ...
- No tags were found...

Create successful ePaper yourself
Turn your PDF publications into a flip-book with our unique Google optimized e-Paper software.
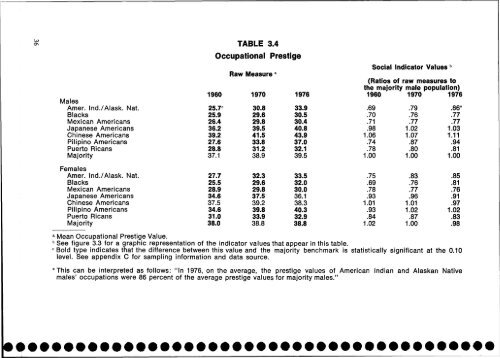
MalesAmer. Ind./Alask. Nat.BlacksMexican AmericansJapanese AmericansChinese AmericansPilipino AmericansPuerto RicansMajority196025.7 C25.926.436.239.227.628.837.1TABLE 3.4Occupational PrestigeRaw Measure1970 197630.829.629.839.541.533.831.238.933.930.530.440.843.937.032.139.5<strong>Social</strong> Indicator Values b(Ratios <strong>of</strong> raw measures tothe majority male population)1960 1970 1976.69.70.71.981.06.74.781.00.79.76.771.021.07.87.801.00.86.77.771.031.11.94.811.00FemalesAmer. Ind./Alask. Nat.BlacksMexican AmericansJapanese AmericansChinese AmericansPilipino AmericansPuerto RicansMajority27.725.528.934.637.534.631.038.032.329.629.837.539.239.833.938.833.532.030.036.138.340.332.938.8.75.69.78.931.01.93.841.02.83.76.77.961.011.02.871.00.85.81.76.91.971.02.83.98a Mean Occupational Prestige Value.b See figure 3.3 <strong>for</strong> a graphic representation <strong>of</strong> the indicator values that appear in this table.c Bold type indicates that the difference between this value <strong>and</strong> the majority benchmark is statistically significant at the 0.10level. See appendix C <strong>for</strong> sampling in<strong>for</strong>mation <strong>and</strong> data source.*This can be interpreted as follows: "In 1976, on the average, the prestige values <strong>of</strong> American Indian <strong>and</strong> Alaskan Nativemales' occupations were 86 percent <strong>of</strong> the average prestige values <strong>for</strong> majority males."