Social Indicators of Equality for Minorities and Women - University of ...
Social Indicators of Equality for Minorities and Women - University of ...
Social Indicators of Equality for Minorities and Women - University of ...
- No tags were found...

You also want an ePaper? Increase the reach of your titles
YUMPU automatically turns print PDFs into web optimized ePapers that Google loves.
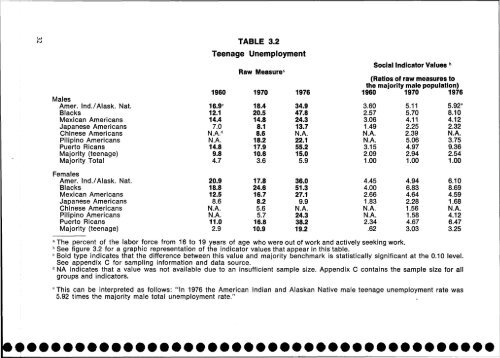
MalesAmer. Ind./Alask. Nat.BlacksMexican AmericansJapanese AmericansChinese AmericansPilipino AmericansPuerto RicansMajority (teenage)Majority TotalFemalesAmer. Ind./Alask. Nat.BlacksMexican AmericansJapanese AmericansChinese AmericansPilipino AmericansPuerto RicansMajority (teenage)TABLE 3.2Teenage Unemployment196016.9 C12.114.47.0N.A. dN.A.14.89.84.720.918.812.58.6N.A.N.A.11.02.9Raw Measure 31970 197618.420.514.88.18.618.217.910.63.617.824.616.78.25.65.716.810.934.947.824.313.7N.A.22.155.215.05.936.051.327.19.9N.A.24.338.219.2<strong>Social</strong> Indicator Values b(Ratios <strong>of</strong> raw measures tothe majority male population)1960 1970 19763.602.573.061.49N.A.N.A.3.152.091.004.454.002.661.83N.A.N.A.2.34.625.115.704.112.252.395.064.972.941.004.946.834.642.281.561.584.673.035.92 :8.104.122.32N.A.3.759.362.541.006.108.694.591.68N.A.4.126.473.25a The percent <strong>of</strong> the labor <strong>for</strong>ce from 16 to 19 years <strong>of</strong> age who were out <strong>of</strong> work <strong>and</strong> actively seeking work.b See figure 3.2 <strong>for</strong> a graphic representation <strong>of</strong> the indicator values that appear in this table.c Bold type indicates that the difference between this value <strong>and</strong> majority benchmark is statistically significant at the 0.10 level.See appendix C <strong>for</strong> sampling in<strong>for</strong>mation <strong>and</strong> data source.d NA indicates that a value was not available due to an insufficient sample size. Appendix C contains the sample size <strong>for</strong> allgroups <strong>and</strong> indicators.*This can be interpreted as follows: "In 1976 the American Indian <strong>and</strong> Alaskan Native male teenage unemployment rate was5.92 times the majority male total unemployment rate."