Social Indicators of Equality for Minorities and Women - University of ...
Social Indicators of Equality for Minorities and Women - University of ...
Social Indicators of Equality for Minorities and Women - University of ...
- No tags were found...

Create successful ePaper yourself
Turn your PDF publications into a flip-book with our unique Google optimized e-Paper software.
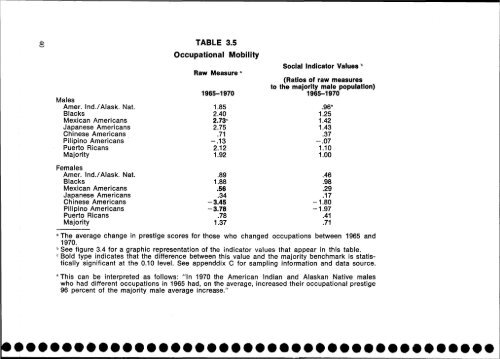
MalesAmer. Ind./Alask. Nat.BlacksMexican AmericansJapanese AmericansChinese AmericansPilipino AmericansPuerto RicansMajorityFemalesAmer. Ind./Alask. Nat.BlacksMexican AmericansJapanese AmericansChinese AmericansPilipino AmericansPuerto RicansMajorityTABLE 3.5Occupational MobilityRaw Measure a1965-19701.852.402.73 C2.75.71-.132.121.92.891.88.56.34-3.45-3.78.781.37<strong>Social</strong> Indicator Values b(Ratios <strong>of</strong> raw measuresto the majority male population)1965-1970.96*1.251.421.43.37-.071.101.00.46.98.29.17-1.80-1.97.41.71a The average change in prestige scores <strong>for</strong> those who changed occupations between 1965 <strong>and</strong>1970.b See figure 3.4 <strong>for</strong> a graphic representation <strong>of</strong> the indicator values that appear in this table.c Bold type indicates that the difference between this value <strong>and</strong> the majority benchmark is statisticallysignificant at the 0.10 level. See appenddix C <strong>for</strong> sampling in<strong>for</strong>mation <strong>and</strong> data source.*This can be interpreted as follows: "In 1970 the American Indian <strong>and</strong> Alaskan Native maleswho had different occupations in 1965 had, on the average, increased their occupational prestige96 percent <strong>of</strong> the majority male average increase."