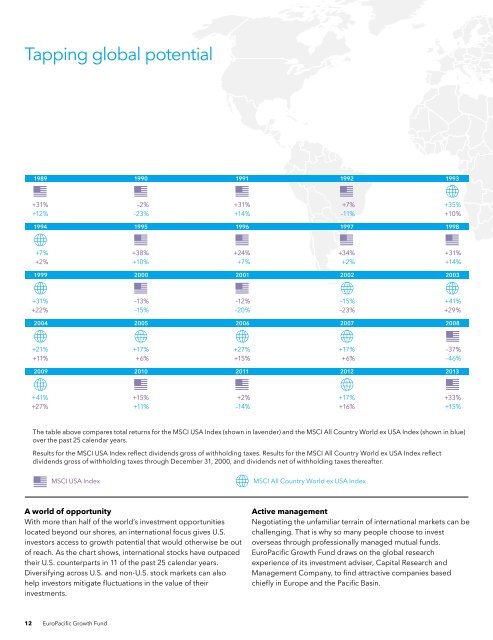
Tapping global potential1989 1990 1991 1992 1993+31% –2% +31% +7% +35%+12% –23% +14% –11% +10%1994 1995 1996 1997 1998+7% +38% +24% +34% +31%+2% +10% +7% +2% +14%1999 2000 2001 2002 2003+31% –13% –12% –15% +41%+22% –15% –20% –23% +29%2004 2005 2006 2007 2008+21% +17% +27% +17% –37%+11% +6% +15% +6% –46%2009 2010 2011 2012 2013+41% +15% +2% +17% +33%+27% +11% –14% +16% +15%The table above compares total returns for the MSCI USA Index (shown in lavender) and the MSCI All Country World ex USA Index (shown in blue)over the past 25 calendar years.Results for the MSCI USA Index reflect dividends gross of withholding taxes. Results for the MSCI All Country World ex USA Index reflectdividends gross of withholding taxes through December 31, 2000, and dividends net of withholding taxes thereafter.MSCI USA IndexMSCI All Country World ex USA IndexA world of opportunityWith more than half of the world’s investment opportunitieslocated beyond our shores, an international focus gives U.S.investors access to growth potential that would otherwise be outof reach. As the chart shows, international stocks have outpacedtheir U.S. counterparts in 11 of the past 25 calendar years.Diversifying across U.S. and non-U.S. stock markets can alsohelp investors mitigate fluctuations in the value of theirinvestments.Active managementNegotiating the unfamiliar terrain of international markets can bechallenging. That is why so many people choose to investoverseas through professionally managed mutual funds.<strong>EuroPacific</strong> <strong>Growth</strong> <strong>Fund</strong> draws on the global researchexperience of its investment adviser, Capital Research andManagement Company, to find attractive companies basedchiefly in Europe and the Pacific Basin.12 <strong>EuroPacific</strong> <strong>Growth</strong> <strong>Fund</strong>
Summary investment portfolio March 31, 2014Industry sector diversification Percent of net assets Country diversification Percent of net assetsInformation technology13.02%Health care12.90%Consumer discretionary12.66%Industrials9.73%Financials19.92%Other industries24.05%Short-term securities& other assetsless liabilities 7.39%Bonds, notes & otherdebt instruments 0.33%Euro zone* 25.9%United Kingdom 12.3Japan 12.1Switzerland 6.2Denmark 5.4India 5.1China 4.7Hong Kong 4.5South Korea 3.9Canada 2.3Sweden 1.4Taiwan 1.4South Africa 1.4Other countries 6.0Short-term securities & other assets less liabilities 7.4*Countries using the euro as a common currency; thoserepresented in the fund’s portfolio are Austria, Belgium,Finland, France, Germany, Greece, Ireland, Italy, theNetherlands, Portugal and Spain.Common stocks 92.28%Value Percent ofShares (000) net assetsFinancials Barclays PLC 1 527,797,757 $2,058,742 1.66%19.92% One of the largest retail and commercial banking groups in the U.K.Prudential PLC 1 94,089,984 1,993,220 1.61Major life insurance and pension provider with operations in theU.S., U.K. and Asia-Pacific region.HDFC Bank Ltd. 1 68,315,429 859,481HDFC Bank Ltd. (ADR) 5,116,600 209,934.86Provides financial services and a wide array of commercial, transactionaland electronic banking products.AXA SA 1 39,998,157 1,041,419 .84One of the world’s largest insurance and financial services companies.AIA Group Ltd. 1 214,949,200 1,021,256 .82Life insurance and financial services provider in the Asia-Pacific region.Société Générale 1 16,391,896 1,011,891 .81Has retail, corporate and investment banking operations around theworld, with particular strength in Europe.Housing Development Finance Corp. Ltd. 1 58,645,570 867,358 .70Offers home loans and other financial services through a network ofoffices in India.Mizuho Financial Group, Inc. 1 428,120,000 844,704 .68One of the world’s largest financial services providers.Bankia, SA 1,2 389,975,203 824,617 .66Accepts deposits and offers commercial banking services.Bank of Ireland 1,2,3 1,871,511,153 800,205 .64Banking, credit cards and stockbroking.UniCredit SpA 1 83,284,573 762,401 .61Operates one of the largest banking networks in Italy, with a significantpresence in Eastern Europe.Commerzbank AG, non-registered shares 1,2 38,971,901 717,017 .58Attracts deposits and offers retail and commercial banking services.Credit Suisse Group AG 1,2 20,591,691 666,797 .54One of the world’s largest private banks, and a provider of investmentbanking, insurance and asset management services.Fairfax Financial Holdings Ltd. 3 826,291 357,867Fairfax Financial Holdings Ltd. (CAD denominated) 3 525,000 227,951.47Focuses on property and insurance products.<strong>EuroPacific</strong> <strong>Growth</strong> <strong>Fund</strong> 13