Annual Report - EuroPacific Growth Fund - American Funds
Annual Report - EuroPacific Growth Fund - American Funds
Annual Report - EuroPacific Growth Fund - American Funds
- No tags were found...

You also want an ePaper? Increase the reach of your titles
YUMPU automatically turns print PDFs into web optimized ePapers that Google loves.
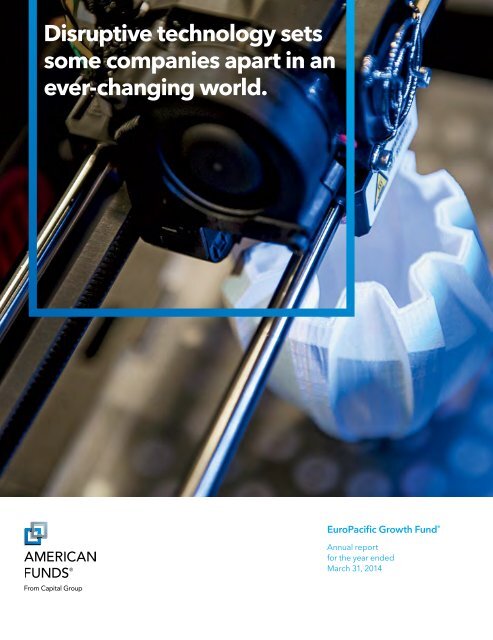
Disruptive technology setssome companies apart in anever-changing world.Special feature page 6<strong>EuroPacific</strong> <strong>Growth</strong> <strong>Fund</strong> ®<strong>Annual</strong> reportfor the year endedMarch 31, 2014
Washington <strong>EuroPacific</strong> <strong>Growth</strong> Mutual <strong>Fund</strong> Investors seeks <strong>Fund</strong> long-term seeks to growth produceincome of capital and by to investing provide primarily an opportunity in the securities for growth ofof companies principal based consistent in Europe with sound and the common Pacific stock Basin.investing. More than half of the world’s investment opportunitiescan be found beyond the borders of our country. As aThis shareholder fund is one in the of fund, more you than have 40 offered access by to what one of we thenation’s believe are largest the best mutual of those fund families, opportunities. <strong>American</strong> <strong>Fund</strong>s,from Capital Group. For more than 80 years, Capitalhas This invested fund is one with of a more long-term than 40 focus offered based by on one thorough of theresearch nation’s largest and attention mutual to fund risk. families, <strong>American</strong> <strong>Fund</strong>s,from Capital Group. For more than 80 years, Capitalhas invested with a long-term focus based on thoroughresearch and attention to risk.<strong>Fund</strong> results shown in this report, unless otherwise indicated, are for Class A sharesat net asset value. If a sales charge (maximum 5.75%) had been deducted, the resultswould have been lower. Results are for past periods and are not predictive of resultsfor future periods. Current and future results may be lower or higher than those shown.Share prices and returns will vary, so investors may lose money. Investing for shortperiods makes losses more likely. Investments are not FDIC-insured, nor are theydeposits of or guaranteed by a bank or any other entity, so they may lose value. Forcurrent information and month-end results, visit americanfunds.com.Here are the average annual total returns on a $1,000 investment with all distributionsreinvested for periods ended March 31, 2014:Class A shares 1 year 5 years 10 yearsReflecting 5.75% maximum sales charge 10.81% 14.18% 7.65%For other share class results, visit americanfunds.com and americanfundsretirement.com.The total annual fund operating expense ratio is 0.84% for Class A shares as of the prospectusdated June 1, 2014 (unaudited).Investment results assume all distributions are reinvested and reflect applicable fees andexpenses. When applicable, investment results reflect fee waivers, without which resultswould have been lower. Visit americanfunds.com for more information.Investing outside the United States may be subject to risks, such as currency fluctuations,periods of illiquidity and price volatility. These risks may be heightened in connection withinvestments in developing countries. Refer to the fund prospectus and the Risk Factorssection of this report for more information on these and other risks associated withinvesting in the fund.Cover: Additive manufacturing, popularly known as 3D printing, is revolutionizing industrialproduction and is but one example of the impact disruptive technology is having on the world.
Special feature6 Disruptive technology setssome companies apart inan ever-changing world.Contents1 Letter to investors4 The value of a long-termperspective13 Summary investment portfolio19 Financial statements38 Board of trustees and otherofficersFellow investors:Global stock markets rose during thefiscal year ended March 31, 2014,supported not only by solid fundamentalgrowth in underlying corporate earningsbut also by rising investor optimism aboutimprovement in the European economy.While there was much investor focus onthe U.S. Federal Reserve during theperiod, ranging from concern over theslowing of quantitative easing to worriesabout inflation and deflation, somemarkets seemed to be adapting betterthan others to the gradual slowdown ofcentral bank stimulus. Emerging marketswere particularly volatile during theperiod and continue to be amid ongoinggeopolitical tensions.Against this backdrop, <strong>EuroPacific</strong> <strong>Growth</strong><strong>Fund</strong>’s return for the 12-month period was17.6%, compared with 12.3% for theunmanaged MSCI All Country Worldex USA Index, which reflects the returnsof more than 40 developed- anddeveloping-country stock markets, and15.7% for the Lipper International <strong>Fund</strong>sAverage, a peer group measure. Asshown in the chart below, the fundcontinued to exceed both measures overthe 10-year period as well as the Lipperaverage over its 30-year lifetime (for moreon the fund’s average annual returns andvolatility over the past 30 years and howthey compare to other indexes andmarkets, see the chart on page 10).The market environmentEuropean stocks rallied as the 18-nationeuro zone began pulling itself out of thelongest recession of the post–World WarII era. Countries with the weakest andmost troubled economies in Europeposted some of the strongest marketgains, including Ireland, Italy and Spain.The euro zone officially emerged fromrecession during the second quarterof 2013, following six previous quartersof negative economic growth. However,concerns about deflationary pressurespersisted as consumer price increaseshovered near all-time lows.The European Central Bank (ECB)reduced interest rates twice duringthe period to a record low of 0.25%.The second cut came in response torenewed concerns about low inflation.The euro zone’s inflation rate of 0.5%was well below the ECB’s target rate andclose to a five-year low, sparking fearsResults at a glanceFor periods ended March 31, 2014, with all distributions reinvestedCumulative Average annual total returnstotal returnsLifetime1 year 5 years 10 years (since 4/16/84)<strong>EuroPacific</strong> <strong>Growth</strong> <strong>Fund</strong>(Class A shares) 17.6% 15.5% 8.3% 11.6%MSCI All Country Worldex USA Index 1,2 12.3 15.5 7.1 —Lipper International <strong>Fund</strong>s Average 15.7 15.7 6.4 9.3MSCI EAFE Index 1,3 17.6 16.0 6.5 9.01The indexes are unmanaged and, therefore, have no expenses. Investors cannot invest directly inan index.2The index did not exist prior to December 31, 1987. Results reflect dividends gross of withholdingtaxes through December 31, 2000, and dividends net of withholding taxes thereafter.3This was the fund’s primary benchmark until the fiscal year ended March 31, 2007. Results reflectdividends net of withholding taxes.<strong>EuroPacific</strong> <strong>Growth</strong> <strong>Fund</strong> 1
Where the fund’s assets are invested(percent invested by country)<strong>EuroPacific</strong> <strong>Growth</strong> <strong>Fund</strong> invests primarily in the stocks ofcompanies in Europe and the Pacific Basin. 1MSCIAll Country<strong>EuroPacific</strong>World ex USA<strong>Growth</strong> <strong>Fund</strong> Index 2Europe (3/31/14) (3/31/13) (3/31/14)Euro zone 3 25.9% 22.9% 23.0%United Kingdom 12.3 11.8 15.2Switzerland 6.2 7.4 6.7Denmark 5.4 4.0 .9Sweden 1.4 1.9 2.4Russia 1.2 1.5 1.1Other Europe .4 .3 1.452.8 49.8 50.7Pacific BasinJapan 12.1 11.1 14.2China 4.7 5.1 3.9Hong Kong 4.5 4.2 2.0South Korea 3.9 4.5 3.3Canada 2.3 2.9 7.3Taiwan 1.4 1.9 2.4Australia 1.0 1.9 5.7Other Pacific Basin 2.4 3.9 4.232.3 35.5 43.0OtherIndia 5.1 4.8 1.4South Africa 1.4 2.1 1.6Israel .7 1.0 .4Brazil .2 .7 2.2Other countries .1 — .77.5 8.6 6.3Short-term securities &other assets lessliabilities 7.4 6.1 —Total 100.0% 100.0% 100.0%1A country is considered part of the Pacific Basin if any of its borders touchesthe Pacific Ocean.2Weighted by market capitalization.3Countries using the euro as a common currency: Austria, Belgium, Cyprus,Estonia, Finland, France, Germany, Greece, Ireland, Italy, Latvia, Luxembourg,Malta, the Netherlands, Portugal, Slovakia, Slovenia and Spain.that the fragile economy could fall backinto recession. With anemic economicgrowth and unemployment at a nearrecordhigh of 12%, ECB President MarioDraghi said the bank is prepared to takefurther action, including launching newasset purchases, if needed to stimulate theeconomy. While Draghi’s statementboosted confidence, much as it did earlylast year when he backed the euro, thereis more uncertainty this time about whatfurther action will be necessary and howhe might actually respond.In Japan, massive central bank stimulusand a weaker yen helped send equitieshigher, further aided by investorenthusiasm for Prime Minister ShinzōAbe’s economic reform program. The yenfell early in the period on the perceptionthat Abe would push for looser monetarypolicy — this was confirmed when henominated Haruhiko Kuroda to head theBank of Japan. The weakening trendaccelerated when Kuroda unveiled amassive stimulus program and pledged todouble the monetary base in an effort toachieve a 2% inflation target by 2015. Thestimulus sent the yen lower versus thedollar, boosting shares of major exporters.However, late in the fiscal year, investorenthusiasm appeared to wane as astronger yen, weak economic data andconcerns over a sales tax hike weighed onthe market, and reservations grew aboutAbe’s commitment to structural reforms.Emerging markets stocks retreated,lagging developed markets amidconcerns about the Fed’s winding downof its quantitative easing program andslowing growth in several emergingmarkets economies. Emerging marketscurrencies fell particularly hard during arout from May to August as investorsworried that the U.S. government wouldcurtail its bond-buying program soonerthan expected, withdrawing liquidity from2 <strong>EuroPacific</strong> <strong>Growth</strong> <strong>Fund</strong>
the system. Currencies of countries withlarge current account deficits postedsome of the sharpest losses. Geopoliticalturmoil added to volatility in emergingmarkets later in the fiscal year amidconcerns about rising tensions betweenRussia and Ukraine, which could last foryears and cause Germany and othercountries to rethink their approach toRussia. Slowing economic growth inChina, while not unexpected as thegovernment seeks to increase the relianceon domestic demand for the long term,further eroded investor sentiment. Fearsalso remain about the health of theproperty sector and the country’sbanking system as companies struggledwith tighter access to financing.Inside the portfolioThe fund’s investments in the health care,information technology and telecommunicationservices sectors were amongthe biggest contributors to returns.Shares of pharmaceutical firms NovoNordisk, Bayer and Novartis all postedgains and remain three of the fund’slargest holdings. Novo Nordisk continuesto provide strong results due to its longtermprospects in the diabetes market, aswell as in promising new areas such asblood-clotting agents. The company alsoannounced a dividend increase and ashare repurchase program, boostingpositive market sentiment.Among the fund’s technology holdings,Chinese internet companies Baidu andTencent recorded strong gains during theperiod, helped by growth in their mobileplatforms in areas such as online chat andvideo applications. Another Chineseinternet company, travel booking websiteCtrip.com International, advanced sharplyas it continued to gain share in a largeand growing market. Several Japanesecompanies also contributed to returns,including SoftBank and Rakuten, ane-commerce and internet company.SoftBank, one of the biggest telecomcompanies in Japan, continues to be alarge holding in the fund. It has benefitedfrom positive market sentiment about itsacquisition of U.S. mobile carrier Sprint,as well as strong results from its holdingsin Chinese internet company Alibaba,which is expected to go public in thecoming months. Alibaba and Tencent arejust two examples of companies withdisruptive technology that are reshapingthe retail industry in China with theire-commerce platforms; for more on theseand other companies that are disruptingtheir industries, see the feature articlestarting on page 6.Investments in the financials sector weremixed, even as some portfolio managersare increasing their exposure to banksamid signs of improvement. Severalbanks advanced as the recoverycontinued for the sector, including Bankof Ireland, Commerzbank and SociétéGénérale. Another French firm, insuranceprovider AXA, also posted strong gainsduring the period, as did British providerPrudential. However, another U.K.company, Barclays, was one of thebiggest detractors during the period.Shares of Russia’s Sberbank also fell amidthe ongoing tensions with Ukraine.Looking aheadWhile the global economic picture hasbrightened over the last year, the outlookremains mixed. In Europe, the economyhas stabilized and appears to be growingmodestly. However, consumer spendingand unemployment must improve ifgrowth is to accelerate and keep pace withinvestors’ expectations. The direction ofJapan’s economy remains uncertain butAbe still seems willing to make somestructural changes, as reflected by therecent agricultural trade deal withAustralia. This is crucial as a sustainedrecovery will depend on larger structuralreforms that will allow for higher wages andexports to grow the economy. Althoughseveral developing economies arestruggling and emerging markets are likelyto remain volatile in the near future, thegrowing consumer demand there shouldcontinue to create long-term investmentopportunities for the fund in companieswith exposure to those markets.Elsewhere, our portfolio managers arefinding attractively valued, well-managedcompanies in industries experiencinggrowing consumer and businessdemand, including auto parts andaerospace. They also have focused oncompanies that should be helped bytechnological innovations in areas suchas health care and e-commerce,including many that are disrupting theirrespective industries. Doing so hasallowed the fund to keep pace with thefast-moving market — or in the case ofthis past fiscal year, exceed it. Our sizegives us the scope and scale necessary toscour the whole world for opportunitiesand invest in the areas we find mostattractive. As always, we thank you, ourfellow investors, for your continuedsupport of <strong>EuroPacific</strong> <strong>Growth</strong> <strong>Fund</strong>.Sincerely,Michael ThawleyVice Chairman of the BoardCarl KawajaPresidentMay 12, 2014For current information about the fund,visit americanfunds.com.<strong>EuroPacific</strong> <strong>Growth</strong> <strong>Fund</strong> 3
The value of along-term perspective<strong>Fund</strong> results shown are for Class Ashares and reflect deduction of themaximum sales charge of 5.75% onthe $10,000 investment.¹ Thus, thenet amount invested was $9,425.²Results are for past periods and arenot predictive of results for futureperiods. Current and future resultsmay be lower or higher than thoseshown. Share prices and returns willvary, so investors may lose money.For current information and monthendresults, visit americanfunds.com.$200,000100,00080,000Average annual total returns based on a $1,000 investment(for periods ended March 31, 2014)*1 year 5 years 10 yearsClass A shares 10.81% 14.18% 7.65%* Assumes reinvestment of all distributions and payment of themaximum 5.75% sales charge.The total annual fund operating expense ratio is 0.84% for Class Ashares as of the prospectus dated June 1, 2014 (unaudited).Investment results assume all distributions are reinvested and re flectapplicable fees and expenses. When applicable, investment resultsreflect fee waivers, without which results would have been lower. Visitamericanfunds.com for more information.The results shown are before taxes onfund distributions and sale of fund shares.60,0001 As outlined in the prospectus, the salescharge is reduced for accounts (andaggregated investments) of $25,000 ormore and is eliminated for purchases of$1 million or more. There is no salescharge on dividends or capital gaindistributions that are reinvested inadditional shares.2 The maximum initial sales charge was 8.5%prior to July 1, 1988.3 For the period April 16, 1984(commencement of operations), throughMarch 31, 1985.4 Includes reinvested dividends of $43,627and reinvested capital gain distributionsof $70,634.5 The index is unmanaged and, therefore,has no expenses. Investors cannot investdirectly in an index.6 From April 16, 1984, through December 31,1987, the MSCI EAFE Index was usedbecause the MSCI All Country World exUSA Index did not yet exist. Since January 1,1988, the MSCI All Country World ex USAIndex has been used. The MSCI EAFEIndex reflects dividends net of withholdingtaxes. The MSCI All Country World exUSA Index reflects dividends gross ofwithholding taxes through December 31,2000, and dividends net of withholdingtaxes thereafter.7 Computed from data supplied by theU.S. Department of Labor, Bureau of LaborStatistics.40,00020,00010,0008,000Year ended March 31 1985 3 1986 1987 1988 1989 1990 1991 1992 1993 1994TOTAL VALUEDividends reinvested $69 35 118 491 316 527 656 611 538 515Value at year-end $9,941 15,357 19,813 21,422 24,569 28,742 31,359 35,033 37,728 47,638EUPAC total return (0.6)% 54.5 29.0 8.1 14.7 17.0 9.1 11.7 7.7 26.34 <strong>EuroPacific</strong> <strong>Growth</strong> <strong>Fund</strong>
How a $10,000 investment has grownWhile notable for their volatility in recent years, financial markets have tended to reward investors over the long term. Activemanagement — bolstered by experience and careful research — can add even more value. As the chart shows, over its lifetime,<strong>EuroPacific</strong> <strong>Growth</strong> <strong>Fund</strong> has done demonstrably better than its relevant benchmark.$252,528 4<strong>EuroPacific</strong> <strong>Growth</strong> <strong>Fund</strong>,with dividends reinvested$153,006 5,6MSCI All Country World ex USA Index,with dividends reinvested$22,919 7Consumer Price Index(inflation)Average annualtotal return forfund’s lifetime:11.4% 4 <strong>EuroPacific</strong> <strong>Growth</strong> <strong>Fund</strong> 5$10,000Original investment1995 1996 1997 1998 1999 2000 2001 2002 2003 2004 2005 2006 2007 2008 2009 2010 2011 2012 2013 2014715 1,131 1,062 1,155 991 841 637 2,209 836 1,083 1,796 2,575 2,899 4,070 3,422 2,959 2,756 2,892 3,444 2,28147,974 57,494 66,627 80,601 87,198 134,560 96,853 94,302 72,463 113,848 127,604 166,207 193,850 206,256 122,641 186,699 209,834 196,710 214,777 252,5280.7 19.8 15.9 21.0 8.2 54.3 (28.0) (2.6) (23.2) 57.1 12.1 30.3 16.6 6.4 (40.5) 52.2 12.4 (6.3) 9.2 17.6
Disruptive technology setssome companies apart in anever-changing world.Portfolio manager Nick Grace considershimself somewhat of a Luddite when itcomes to technology, having served onlya brief stint as a technology analyst. Butthat has not kept him and other portfoliomanagers on <strong>EuroPacific</strong> <strong>Growth</strong><strong>Fund</strong> from investing in a new wave ofcompanies developing technologies thatare disrupting a number of industries,from retail to automotive — workingclosely, of course, with an assortment ofanalysts in their respective fields.“It’s obvious to me that we live in atransformational time, where emergingtechnologies are creating new businessmodels and destroying old ones,” saysNick. “Thinking back to my days as ananalyst, when I was able to identify astructural change that was large andpronounced, I could invest behind thatidea for a very long time. The samething is happening today with disruptivetechnology. Luckily our analysts havedone a great job of identifying a group ofcompanies that are driving those changes.”“Disruptive technology is having ahuge impact on the world and it isonly getting bigger,” adds portfoliomanager Mark Denning, who like Nickis based in London. “Name an industryand it is being disrupted — just look atretail with the impact of e-commerceand mobile payment systems. Asinvestors, we have to make sure weare on top of all the change that is takingplace, which is why having the properresources in place is crucial in theseindustries.”Nick, Mark and the other seven portfoliomanagers on the fund have been workingclosely with a number of analysts tocome up with the best investmentideas in this area, only investing inthose companies in which they have thestrongest convictions. “It’s important thatwe approach them with great diligenceand make sure they’re not just companieswe like, but that we also know how fastthey need to grow sales and improveprofits to be fruitful investments,” saysportfolio manager Carl Kawaja, alsopresident of <strong>EuroPacific</strong> <strong>Growth</strong> <strong>Fund</strong>.“This is a fund with investments in manylarge companies that have been aroundfor a while. But in addition to owningthose, we want to make sure that we’re notmissing out on the smaller, more nimblecompanies that are disrupting industries.”The impact of e-commerceLook no further than the averageshopping mall to see the impact thate-commerce companies are having inAsia. Mall operators are reconfiguringtheir layouts, reducing the overall numberof stores and renting much of the spacethat’s left for companies to showcase theirlatest products. Customers can see flashydisplays in an entertaining environment,but many of them actually wait and buythe products online — often using theirmobile devices.The most popular e-commerce sites inChina are Taobao and Tmall, which areboth owned by Alibaba Group. Thesesites account for roughly 80% of all onlineshopping transactions in the country.“E-commerce in China is having a verydisruptive role in the retail market andAlibaba is a big part of that,” says HongKong–based analyst Matt Wolf, notingthat growth of retail real estate prices andsame-store sales have slowed as a result.“Alibaba offers a range of products atcompetitive prices with fairly good service.Not to mention the convenience, whichis becoming more important in China’sfirst-tier cities, where many consumersmust travel great distances through trafficand smog. In the lower tier cities, the retailinfrastructure is much less developed, soAlibaba is often the best option.”Alibaba is also the go-to destination forcompanies looking to sell their productsin China as an entry point into the market.Taobao, the company’s primary site,still accounts for most of its business,making most of its money through searchand display advertising. However, somecompanies became wary of Taobaobecause there were too many brandknock-offs. So Alibaba introduced Tmall,a more business-friendly site with anincreased focus on brands. Althoughthere are transaction fees for Tmall,companies can more easily control theirbrands and who else sells them.“It’s not like anything you’d find in theU.S.,” says Matt. “Since most of thee-commerce traffic in China goes toAlibaba, brands that usually wouldn’t sellthrough online marketplaces, like Appleand Nike, have decided to pay the fees toopen stores on Tmall, often before theycreate their own websites in the country.”6 <strong>EuroPacific</strong> <strong>Growth</strong> <strong>Fund</strong>
This is a fund withinvestments in many largecompanies that have beenaround for a while. But inaddition to owning those,we want to make sure thatwe’re not missing out onthe smaller, more nimblecompanies that aredisrupting industries.Carl KawajaNick GracePortfolio managerCarl KawajaPortfolio manager<strong>EuroPacific</strong> <strong>Growth</strong> <strong>Fund</strong> 7
Sung LeePortfolio managerMark DenningPortfolio managerDisruptive technology is having a huge impact onthe world. As investors, we have to make sure we areon top of all the change that is taking place, which iswhy having the proper resources in place is crucialin these industries.Mark Denning“The growth has been staggeringbecause of how the market operates;consumers have been trained to go therewhen they want to buy stuff online,” henotes. “Alibaba learned some lessonsfrom the battle between eBay andAmazon, and as a result has been able toavoid many of the traps that other onlinemarketplaces have fallen into.”Matt and several of the fund’s portfoliomanagers have invested in AlibabaGroup through Japanese conglomerateSoftBank, which owns 37% of theChinese internet company. When Mattstarted coverage of SoftBank in late2009, Alibaba was already a key part ofthe investment thesis — but its value hascontinued to increase since then. Thecompany is now preparing to go publicin the U.S. and its value is likely toincrease even more. “Alibaba is an evenbigger part of the thesis now, and I’mmore comfortable with it being at highervaluations,” Matt says after doing an indepthreview of SoftBank. “I understandthe business better and have a higherconviction in its long-term value.”Another Chinese internet company,Tencent, is also a large holding in thefund, even as managers remain sensitiveto valuation concerns. The companyoffers several popular services, suchas WeChat, as well as other forms ofentertainment like online games. Nicksays he was attracted to Tencent whenhe first began investing in disruptivetechnology, consulting with Hong Kong–based analyst Sugi Widjaja.“I soon realized that anything that could bedigitized would be big, so I worked withSugi to identify sectors and companiesimpacted by this digitization,” says Nick,who also consulted with Matt on Alibaba.“After working with our analysts, I beganto see a thread and invested more moneyas we identified these changes.”Several trends came together in Chinato allow a company like Tencent tothrive and become a disruptive force.As is often the case in developingcountries, technology acceleratesrapidly as consumers tend to adoptcertain trends more quickly than in thedeveloped world. For instance, manysmartphone users in China do far morewith their devices than those in theU.S. The penetration of sophisticatedsmartphone users combined withsuperfast networks created a veryconducive environment for companieslike Tencent and their wide offering ofentertainment and services.The key is figuring out how to monetizethese products, especially on mobiledevices. Sugi said his familiarity with asimilar company in South Korea gave himconfidence that Tencent would also besuccessful with its WeChat service. “Thechief financial officer of the Korean firmkept me up-to-date on the rate of usergrowth and engagement,” he says. “I wasamazed by how quickly the chat servicewas growing and then the companybegan to monetize that by offeringmobile games. I have a strong convictionthat Tencent will also be able to do this.”Sugi says this flexibility to meet withrelated companies in other countriesand industries is key to identifying trendsand taking a broader view, helping himmake the best long-term investmentdecisions for the fund. This includesmeeting with private companies as wellas venture capitalists, who are often firstto fund some of the start-ups focused ondisruptive technologies. “I keep in closecontact with them because things changewith technology in a matter of months andthey are seeing these companies everyday,” he says. “The more contacts we canmeet within both the public and privatesectors, the better investment decisionswe are able to make.”Mobile payments on the riseAnother important aspect of Alibaba’sand Tencent’s business models is theirmobile payment systems — knownas Alipay and Tenpay, respectively.They allow the companies to track keyconsumer data, which they can use toincrease customer loyalty. “The bigproblem with an online marketplace inChina was trust, because people didn’tknow who they were buying from,” saysMatt. “When Alibaba came up with apayment system that included an escrowservice, it was an important innovationin bridging that trust gap. Just as PayPalhelped enable eBay in the U.S., Alipay hasdone the same with Alibaba in China.”Alipay and Tenpay are becoming so largein China that they potentially could disruptsome of the country’s banks and paymentnetworks. This is in part because the online8 <strong>EuroPacific</strong> <strong>Growth</strong> <strong>Fund</strong>
Analyst focusPrimark reshapingEuropean retailLara PelliniInvestment analystNo industry has been impacted more by disruptive companiesthan retail. While much of this disruption has come from theincrease in e-commerce and mobile payments, one brick-andmortarretailer is still shaking up the industry: Primark, a divisionof Associated British Foods that’s quickly become one of themost popular clothing stores in Europe.London-based analyst Lara Pellini, who’s been with CapitalGroup for 12 years, recently spent the day visiting localmanagement at Primark’s first store in Berlin. It has 11 stores inGermany, with a second opening in Berlin this summer. If the firstis any indication, the next one should do just fine. “Customers arewilling to drive three or four hours to come to the store and evenfarther during holidays, when they come from Poland,” says Lara,noting that the Berlin store achieved record sales of €600,000on its first day. “Pent-up demand has been huge. Primark has thepotential to triple its store count, mostly in mainland Europe.”When you think aboutinvesting in mobilepayments, it basicallycomes down to a companythat can enable security,regardless of which systemis being used.Johnny ChanInvestment analystPrimark has been successful at a time when e-commerce isdisrupting the retail industry because it is one of the only brickand-mortarstores whose profit margins are tight enough toremain competitive. “The clothing market is highly fragmentedand retailers generally command higher margins than othercategories, such as grocery stores and home improvementretailers,” says Lara. “Primark runs a disruptive business modelbased on low margins and overhead coupled with high salesdensities. This is why others can’t match its low prices.”Lara is a firm believer in firsthand observation when it comes toevaluating companies she covers, especially when they’re takinga different approach like Primark. “I visit stores and observecustomers’ reactions to better understand what makes it sounique, and in some cases disruptive,” says Lara. “It didn’t takeme long to realize that Primark’s business model of selling themost fashionable items at the lowest prices would be difficultto replicate.” She also had to consider the implications for someincumbent retailers, who were not able to sell items at full pricebecause customers perceived them as being too expensive.<strong>EuroPacific</strong> <strong>Growth</strong> <strong>Fund</strong> 9
Thirty years ofstrong returns withlow volatility<strong>EuroPacific</strong> <strong>Growth</strong> <strong>Fund</strong> hasprovided investors with strongreturns over its 30-year history,with an average annual totalreturn of 11.6% versus 9.6% forthe unmanaged MSCI All CountryWorld ex USA Index.* At the sametime, the fund has providedthese strong returns with lowervolatility compared to the indexand individual markets in Europeand around the Pacific Basin. Thefund’s portfolio managers havebeen able to achieve this balanceof low volatility with strong growthby investing not only in some ofthe world’s larger, more stablecompanies but also those that aresmaller, more nimble and oftenable to adapt more quickly to anever-changing global landscape.Average annual total return15%1015<strong>EuroPacific</strong><strong>Growth</strong> <strong>Fund</strong>MSCI All Country*World ex USA Index*SwitzerlandUnited KingdomNetherlandsCanadaVolatilityDenmarkFranceGermanyAustraliaReturns and volatility calculated from April 30, 1984, the first month-end after the fund’s inception, throughMarch 31, 2014, and include reinvestment of all dividends. Volatility is calculated at net asset value usingannualized standard deviation (based on monthly returns); a lower number signifies lower volatility.Country stock returns are based on MSCI indexes, expressed in U.S. dollars, and reflect dividends net ofwithholding taxes. The market indexes are unmanaged and, therefore, have no expenses. Investors cannotinvest directly in an index.*From April 30, 1984, to December 31, 1987, the MSCI EAFE was used because the MSCI ACWI ex USAdid not exist. The MSCI EAFE reflects dividends net of withholding taxes. The MSCI ACWI ex USA reflectsdividends gross of withholding taxes through December 31, 2000, and dividends net of withholdingtaxes thereafter.<strong>Fund</strong> result shown is for Class A shares at net asset value. If a sales charge (maximum 5.75%)had been deducted, the result would have been lower. Results are for past periods andare not predictive of results for future periods. Current and future results may be lower orhigher than those shown. Share prices and returns will vary, so investors may lose money.For current information and month-end results, visit americanfunds.com.SpainItalySingaporeHong KongNorway14% 16 18 20 22 24 26 28JapanMore volatile returns ➔accounts can be used to pay for purchaseson other e-commerce sites as well as forservices in the non-virtual world, such astaxi rides. Alibaba, which recently obtaineda banking license, even offers a moneymarket fund with interest rates above 5% —more than the 3% that banks typically offer.As of March 31, 2014, it had $87 billionin deposits, making it one of the largestmoney market funds in the world.“The fundamental difference betweenChina and more developed markets isthat the penetration of credit is very low— people mainly use cash and debit cardsinstead of credit cards,” Hong Kong–basedanalyst Johnny Chan says about the growthof mobile payment systems in China.“What’s more, these companies incentivizepaying online by offering discounts, whichonly drives further usage. As a result, theygrow very rapidly and disrupt the existingpayment networks in China.”With rapid growth also comes morescrutiny from regulators, so for nowAlibaba and Tencent are using theirpayment systems primarily as a wayto engage more customers. “Thesepayment systems enhance customers’experience, but they have little value inextracting profits directly,” Johnny says.“They are used as more of a targetedmarketing opportunity, because thepayment data can be associated toproducts, allowing the companies to setthe price for advertisers on their sitesmore appropriately. They can also betterunderstand consumers’ behavior andsell them what they want.”It will be difficult for any new paymentsystem to catch on globally, says Johnny,pointing to three factors a company mustpay close attention to when rolling out anew system: convenience, security andcost. “These three factors counterbalanceeach other,” he explains. “High security10 <strong>EuroPacific</strong> <strong>Growth</strong> <strong>Fund</strong>
Cars have been around in basically the same form forabout 100 years, so I’m paying close attention to theelectrification of the entire automobile. A structuralchange is taking place in the auto industry as we movefrom the combustion engine to the electric motor.Sung Leemeans more inconvenience because thereare more passwords and steps involved.It also means the system is more expensiveto create; but it protects users from losingmoney, which could be even more costly ifthey do.” These factors, along with the factthat existing open-loop payment systemssuch as Visa and MasterCard have globalacceptance and take many years to buildtheir networks, make it more difficult fornew payment systems to emerge.With these issues in mind, Johnny took astep back to see how he could best investin the growth of mobile payments, takingthe broadest approach possible sincethere are so many competing systems.“When you think about investing inmobile payments, it basically comes downto a company that can enable security,regardless of which system is beingused,” he says. As a result, he made thedecision to invest in Gemalto, a Frenchfirm that has built a trusted infrastructurethat is “technology agnostic” to paymentsystems. “Gemalto works with banks andother financial institutions to provide thedigital credentials to users who want tomake payments with their mobile phones.There will always be a need for some formof secure element, either hardware or inthe cloud, that stores financial records andcan’t be compromised.”Electrifying the auto industryElectric vehicles are not a new concept— many car companies have been tryingto make a viable model for years. Theproblem was, rather than use existinglithium ion batteries, they attempted todevelop their own batteries that weresafer and lasted longer. This process wasvery expensive and time-consuming,which is why many electric vehiclesnever became commercially viable.Additionally, it was against many of thecar companies’ best interest to make anelectric car, which would only acceleratethe decline in sales of traditionalautomobiles.In recent years, electric vehicles haveseen renewed interest as companies —most notably Tesla Motors — began todevelop cars with lithium ion batteries.“The genius of Tesla is that they havetaken existing materials that are freelyavailable and, against all odds, madethem into a product that works,” saysSingapore-based portfolio managerSung Lee. “It optimized the same batteryused in laptops and mobile phones forlonger usage. It also made them saferusing in-house technology that thecompany won’t disclose.”While the fund does not invest in Tesla,which is based in the U.S., it does holdshares of two companies that makelithium ion batteries: Samsung SDI andPanasonic (0.15% of the fund’s holdings atfiscal year-end). Panasonic is developinga large factory with the automaker thatwill equal the world’s existing lithium ionbattery capacity. Both Panasonic andSamsung SDI also continue to supplylithium ion batteries for mobile phones,benefiting from growth in that market.But it’s not just the engines that are beingreplaced in electric vehicles — it’s the othersystems, too, from the steering to theseats. “Cars have been around in basicallythe same form for about 100 years, so I’mpaying close attention to the electrificationof the entire automobile,” notes Sung. “Astructural change is taking place in the autoindustry as we move from the combustionengine to the electric motor.” To seek totake advantage of this, he is investing ina number of parts suppliers that makesmall electric motors that more efficientlypower the various systems in a car. Forexample, some companies are producingelectric motors that power the braking andsteering systems in an increasing number ofmodels, replacing the hydraulics, which useoil and gas to power these systems and area drain on mileage.“Many of these changes are going to beincremental, but we try to take advantageof the broader shifts as they happenby trying to identify the winners andinvesting early,” says Sung. “We have theresources and experience to see thesechanges through over many years, andthat perspective is what gives us theedge in terms of identifying them. Certaincompanies recognize these changesas well, but are too protective of theircurrent business model; once momentumbuilds, they get left behind. We want tobe invested in those companies who thinkstrategically about the long-term shifts inan industry. Our advantage is that we canalso take a long-term view because of ourinvestment horizon.” n<strong>EuroPacific</strong> <strong>Growth</strong> <strong>Fund</strong> 11
Tapping global potential1989 1990 1991 1992 1993+31% –2% +31% +7% +35%+12% –23% +14% –11% +10%1994 1995 1996 1997 1998+7% +38% +24% +34% +31%+2% +10% +7% +2% +14%1999 2000 2001 2002 2003+31% –13% –12% –15% +41%+22% –15% –20% –23% +29%2004 2005 2006 2007 2008+21% +17% +27% +17% –37%+11% +6% +15% +6% –46%2009 2010 2011 2012 2013+41% +15% +2% +17% +33%+27% +11% –14% +16% +15%The table above compares total returns for the MSCI USA Index (shown in lavender) and the MSCI All Country World ex USA Index (shown in blue)over the past 25 calendar years.Results for the MSCI USA Index reflect dividends gross of withholding taxes. Results for the MSCI All Country World ex USA Index reflectdividends gross of withholding taxes through December 31, 2000, and dividends net of withholding taxes thereafter.MSCI USA IndexMSCI All Country World ex USA IndexA world of opportunityWith more than half of the world’s investment opportunitieslocated beyond our shores, an international focus gives U.S.investors access to growth potential that would otherwise be outof reach. As the chart shows, international stocks have outpacedtheir U.S. counterparts in 11 of the past 25 calendar years.Diversifying across U.S. and non-U.S. stock markets can alsohelp investors mitigate fluctuations in the value of theirinvestments.Active managementNegotiating the unfamiliar terrain of international markets can bechallenging. That is why so many people choose to investoverseas through professionally managed mutual funds.<strong>EuroPacific</strong> <strong>Growth</strong> <strong>Fund</strong> draws on the global researchexperience of its investment adviser, Capital Research andManagement Company, to find attractive companies basedchiefly in Europe and the Pacific Basin.12 <strong>EuroPacific</strong> <strong>Growth</strong> <strong>Fund</strong>
Summary investment portfolio March 31, 2014Industry sector diversification Percent of net assets Country diversification Percent of net assetsInformation technology13.02%Health care12.90%Consumer discretionary12.66%Industrials9.73%Financials19.92%Other industries24.05%Short-term securities& other assetsless liabilities 7.39%Bonds, notes & otherdebt instruments 0.33%Euro zone* 25.9%United Kingdom 12.3Japan 12.1Switzerland 6.2Denmark 5.4India 5.1China 4.7Hong Kong 4.5South Korea 3.9Canada 2.3Sweden 1.4Taiwan 1.4South Africa 1.4Other countries 6.0Short-term securities & other assets less liabilities 7.4*Countries using the euro as a common currency; thoserepresented in the fund’s portfolio are Austria, Belgium,Finland, France, Germany, Greece, Ireland, Italy, theNetherlands, Portugal and Spain.Common stocks 92.28%Value Percent ofShares (000) net assetsFinancials Barclays PLC 1 527,797,757 $2,058,742 1.66%19.92% One of the largest retail and commercial banking groups in the U.K.Prudential PLC 1 94,089,984 1,993,220 1.61Major life insurance and pension provider with operations in theU.S., U.K. and Asia-Pacific region.HDFC Bank Ltd. 1 68,315,429 859,481HDFC Bank Ltd. (ADR) 5,116,600 209,934.86Provides financial services and a wide array of commercial, transactionaland electronic banking products.AXA SA 1 39,998,157 1,041,419 .84One of the world’s largest insurance and financial services companies.AIA Group Ltd. 1 214,949,200 1,021,256 .82Life insurance and financial services provider in the Asia-Pacific region.Société Générale 1 16,391,896 1,011,891 .81Has retail, corporate and investment banking operations around theworld, with particular strength in Europe.Housing Development Finance Corp. Ltd. 1 58,645,570 867,358 .70Offers home loans and other financial services through a network ofoffices in India.Mizuho Financial Group, Inc. 1 428,120,000 844,704 .68One of the world’s largest financial services providers.Bankia, SA 1,2 389,975,203 824,617 .66Accepts deposits and offers commercial banking services.Bank of Ireland 1,2,3 1,871,511,153 800,205 .64Banking, credit cards and stockbroking.UniCredit SpA 1 83,284,573 762,401 .61Operates one of the largest banking networks in Italy, with a significantpresence in Eastern Europe.Commerzbank AG, non-registered shares 1,2 38,971,901 717,017 .58Attracts deposits and offers retail and commercial banking services.Credit Suisse Group AG 1,2 20,591,691 666,797 .54One of the world’s largest private banks, and a provider of investmentbanking, insurance and asset management services.Fairfax Financial Holdings Ltd. 3 826,291 357,867Fairfax Financial Holdings Ltd. (CAD denominated) 3 525,000 227,951.47Focuses on property and insurance products.<strong>EuroPacific</strong> <strong>Growth</strong> <strong>Fund</strong> 13
Common stocks (continued)Value Percent ofShares (000) net assetsFinancials Axis Bank Ltd. 1 23,224,864 $ 567,341 .46%(continued)Provides a full range of banking services throughout India.Other securities 9,911,705 7.9824,743,906 19.92Information Samsung Electronics Co. Ltd. 1 1,739,100 2,199,211technology Samsung Electronics Co. Ltd., nonvoting preferred 1 48,800 48,42713.02% Korea’s top electronics manufacturer and a global leader insemiconductor production.Tencent Holdings Ltd. 1 21,128,300 1,471,079 1.19Major internet service portal in China.Murata Manufacturing Co., Ltd. 1,3 14,705,400 1,383,902 1.11Global supplier of passive electronic components used in dataprocessing, consumer electronics and telecommunications.Taiwan Semiconductor Manufacturing Co. Ltd. 1 302,957,649 1,183,765Taiwan Semiconductor Manufacturing Co. Ltd. (ADR) 5,822,723 116,571One of the world’s largest semiconductor manufacturers.Baidu, Inc., Class A (ADR) 2 8,118,900 1,237,158 1.00Internet search engine in China that also operates a Japaneselanguage service.Nintendo Co., Ltd. 1,3 10,185,600 1,213,192 .98Makes video game machines and software.Naver Corp. 1 1,320,006 960,983 .77Leading search engine and Web game company in Korea.ASML Holding NV 1 8,496,811 786,645 .64A leading supplier of lithography equipment used in manufacturingsemiconductors.Infineon Technologies AG 1,3 56,470,947 673,781 .54Designs and manufactures semiconductors used in communications,automotive, computer and industrial electronics.ARM Holdings PLC 1 38,430,700 648,041 .52Designs and licenses high-performance microprocessor sets used inelectronic devices.Gemalto NV 1,3 4,804,745 560,695 .45Provider of digital security products and services.Other securities 3,680,811 2.961.811.0516,164,261 13.02Health care Novo Nordisk A/S, Class B 1 131,071,580 5,979,424 4.8212.90% A global leader in drugs to treat diabetes.Bayer AG 1 21,448,384 2,900,609 2.34Makes pharmaceuticals and over-the-counter medicines, and developsmedical diagnostic equipment.Novartis AG 1 28,740,725 2,441,105 1.97One of the world’s largest pharmaceutical companies.Teva Pharmaceutical Industries Ltd. (ADR) 16,243,300 858,296 .69The leading drug company in Israel, and one of the largest genericdrug companies in the U.S.UCB SA 1 9,315,505 746,932 .60Produces chemicals and pharmaceuticals through its global operations.Roche Holding AG 1 2,283,000 686,239 .55A world leader in pharmaceuticals and diagnostic research.Other securities 2,402,126 1.9316,014,731 12.9014 <strong>EuroPacific</strong> <strong>Growth</strong> <strong>Fund</strong>
Value Percent ofShares (000) net assetsConsumer Volkswagen AG, nonvoting preferred 1 4,205,986 $ 1,089,750 .88%discretionaryEurope’s largest automobile manufacturer. Its brands include Audi,12.66% Bentley, Bugatti and Lamborghini.Honda Motor Co., Ltd. 1 27,484,250 966,372 .78Develops, manufactures and sells automobiles, motorcycles andpower equipment.Rakuten, Inc. 1 52,784,100 702,961 .57Operates an online shopping mall and trading community.Sands China Ltd. 1 93,499,200 702,046 .56Owns and operates integrated resorts and casinos in Macau.Industria de Diseño Textil, SA 1 4,657,000 699,969 .56Designs and retails up-to-the-minute clothing. Most of its shops arein Europe.Li & Fung Ltd. 1 412,044,000 610,845 .49Major consumer products global sourcing and logisticsservice provider.Naspers Ltd., Class N 1 5,534,900 610,682 .49Owns operations in pay-TV, internet services, print media andbook publishing.adidas AG 1 5,459,000 591,412 .48Global manufacturer of sports apparel.Other securities 9,744,527 7.8515,718,564 12.66Industrials Airbus Group NV 1 15,521,890 1,113,141 .909.73% Manufactures airplanes and military equipment.Ryanair Holdings PLC (ADR) 2 16,627,920 977,888 .79European discount airline serving Continental Europe, Ireland and theUnited Kingdom.International Consolidated Airlines Group, SA (CDI) 1,2,3 111,313,540 775,120 .62Provides international and domestic air passenger and cargotransportation services.Rolls-Royce Holdings PLC 1,2 41,805,535 749,922 .60Provides engineering systems and services to the airline, defense,marine shipping and energy industries.Deutsche Lufthansa AG 1,2,3 27,172,815 711,746 .57A leading European passenger airline and a top internationalcargo carrier.ASSA ABLOY AB, Class B 1 10,585,500 565,374 .46Manufactures mechanical, electromagnetic and electronic locks andsecurity systems.Other securities 7,184,655 5.7912,077,846 9.73<strong>EuroPacific</strong> <strong>Growth</strong> <strong>Fund</strong> 15
Common stocks (continued)Value Percent ofShares (000) net assetsConsumer staples Associated British Foods PLC 1 38,306,738 $ 1,776,373 1.43%8.37% Produces food products including bread, crackers, teas andcooking ingredients.British <strong>American</strong> Tobacco PLC 1 25,170,999 1,401,371 1.13The world’s second-largest tobacco company.Nestlé SA 1 17,656,799 1,330,420 1.07Global packaged food and beverage company based in Switzerland.Pernod Ricard SA 1 9,194,053 1,071,155 .86Produces wine, spirits and nonalcoholic beverages.Alimentation Couche-Tard Inc., Class B 8,255,600 667,692 .54Automated banking machines.Anheuser-Busch InBev NV 1 6,320,317 664,324 .53One of the world’s largest brewers.SABMiller PLC 1 11,065,435 552,700 .45Major global brewer with interests in over 60 countries. The company isalso one of the largest bottlers of Coca-Cola products.Other securities 2,932,603 2.3610,396,638 8.37Telecommunication SoftBank Corp. 1 36,013,300 2,716,102 2.19servicesInternet and telecommunications conglomerate and distributor of4.14% digital media and software.Other securities 2,425,016 1.955,141,118 4.14Materials Syngenta AG 1 1,963,315 744,694 .603.67% One of the world’s largest agrochemical companies. Develops seedsand crop protection products.Other securities 3,814,108 3.074,558,802 3.67Other Other securities 4,082,526 3.283.28%Miscellaneous Other common stocks in initial period of acquisition 5,701,664 4.594.59%Total common stocks (cost: $73,010,820,000) 114,600,056 92.28Rights 0.00%Miscellaneous Other rights in initial period of acquisition 5,758 .000.00%Total rights (cost: $0) 5,758 .00Bonds, notes & other debt instruments 0.33%Other Other securities 409,742 .330.33%Total bonds, notes & other debt instruments (cost: $408,935,000) 409,742 .3316 <strong>EuroPacific</strong> <strong>Growth</strong> <strong>Fund</strong>
Short-term securities 7.27%Principal amount Value Percent of(000) (000) net assetsFederal Home Loan Bank 0.06%–0.175% due 4/2–10/20/2014 $2,519,585 $ 2,519,155 2.03%Freddie Mac 0.095%–0.17% due 4/1/2014–2/9/2015 2,287,500 2,286,307 1.84Fannie Mae 0.11%–0.15% due 4/1–10/27/2014 914,600 914,409 .73Other securities 3,310,895 2.67Total short-term securities (cost: $9,030,089,000) 9,030,766 7.27Total investment securities (cost: $82,449,844,000) 124,046,322 99.88Other assets less liabilities 142,512 .12Net assets $124,188,834 100.00%This summary investment portfolio is designed to streamline the report and help investors better focus on the fund’s principal holdings. See page 40 fordetails on how to obtain a complete schedule of portfolio holdings.The descriptions of the companies shown in the summary investment portfolio, which were obtained from published reports and other sources believed tobe reliable, are supplemental and are not covered by the <strong>Report</strong> of Independent Registered Public Accounting Firm.As permitted by U.S. Securities and Exchange Commission regulations, “Miscellaneous” securities include holdings in their first year of acquisition that havenot previously been publicly disclosed.“Other securities” includes all issues that are not disclosed separately in the summary investment portfolio. Some of these securities (with an aggregate valueof $2,180,735,000, which represented 1.76% of the net assets of the fund) were acquired in transactions exempt from registration under Rule 144A or section4(2) of the Securities Act of 1933 and may be resold in the U.S. in transactions exempt from registration, normally to qualified institutional buyers. “Othersecurities” also includes a portion of a security which was pledged as collateral. The total value of pledged collateral was $1,758,000, which represented lessthan .01% of the net assets of the fund.Forward currency contractsThe fund has entered into forward currency contracts to sell currencies as shown in the following table. The average notional amountof open forward currency contracts was $2,930,846,000 over the prior 12-month period.Unrealized(depreciation)Contract amountappreciationSettlement Receive Deliver at 3/31/2014date Counterparty (000) (000) (000)Sales:Australian dollars 4/4/2014 UBS AG $35,099 A$39,300 $ (1,338)Euros 4/9/2014 HSBC Bank $145,000 €106,365 (1,530)Euros 4/14/2014 Bank of America, N.A. $221,808 €160,000 1,391Euros 4/14/2014 JPMorgan Chase $317,155 €228,819 1,932Euros 4/15/2014 UBS AG $41,014 €29,560 292Euros 4/24/2014 HSBC Bank $68,926 €50,000 48Euros 4/28/2014 Citibank $77,187 €55,900 181Euros 4/30/2014 Barclays Bank PLC $100,575 €73,183 (239)Euros 4/30/2014 JPMorgan Chase $89,336 €65,000 (205)Japanese yen 4/7/2014 Bank of New York Mellon $68,272 ¥6,975,000 692Japanese yen 4/9/2014 JPMorgan Chase $70,000 ¥7,306,950 (797)Japanese yen 4/14/2014 Barclays Bank PLC $42,323 ¥4,370,000 (19)Japanese yen 4/17/2014 Barclays Bank PLC $321,760 ¥33,042,500 1,597Japanese yen 4/24/2014 Bank of America, N.A. $63,754 ¥6,545,000 334Japanese yen 4/28/2014 Barclays Bank PLC $410,463 ¥41,957,500 3,894Japanese yen 4/28/2014 HSBC Bank $570,085 ¥58,258,446 5,561Japanese yen 4/28/2014 HSBC Bank $42,423 ¥4,300,000 756Japanese yen 5/2/2014 Bank of America, N.A. $159,133 ¥16,300,000 1,183Swiss francs 4/28/2014 Citibank $147,382 CHF130,280 (18)$13,715<strong>EuroPacific</strong> <strong>Growth</strong> <strong>Fund</strong> 17
Investments in affiliatesA company is considered to be an affiliate of the fund under the Investment Company Act of 1940 if the fund’s holdings in thatcompany represent 5% or more of the outstanding voting shares. The value of the fund’s affiliated-company holdings is either shown inthe summary investment portfolio or included in the value of “Other securities” under the respective industry sectors. Further detailson such holdings and related transactions during the year ended March 31, 2014, appear below.Beginning Ending Dividend Value ofshares or shares or or interest affiliates atprincipal principal income 3/31/2014amount Additions Reductions amount (000) (000)Murata Manufacturing Co., Ltd. 1 15,308,200 2,200 605,000 14,705,400 $ 17,409 $1,383,902Nintendo Co., Ltd. 1 6,482,100 3,703,500 — 10,185,600 8,991 1,213,192Bank of Ireland 1,2 2,410,600,276 250,000,000 789,089,123 1,871,511,153 — 800,205Bank of Ireland 10.24% (undated) — €5,190,000 — €5,190,000 289 7,833International ConsolidatedAirlines Group, SA (CDI) 1,2 30,070,400 81,243,140 — 111,313,540 — 775,120Deutsche Lufthansa AG 1,2 18,019,815 9,153,000 — 27,172,815 — 711,746Infineon Technologies AG 1 63,615,947 — 7,145,000 56,470,947 9,272 673,781Fairfax Financial Holdings Ltd. 711,291 115,000 — 826,291 7,023 357,867Fairfax Financial Holdings Ltd.(CAD denominated) 325,000 200,000 — 525,000 4,463 227,951Gemalto NV 1,4 3,373,083 1,876,982 445,320 4,804,745 1,963 560,695Power Grid Corp. of India Ltd. 1 162,690,336 133,333,086 — 296,023,422 9,058 520,410NetEase, Inc. (ADR) 6,578,800 1,366,743 986,376 6,959,167 9,812 468,352Ctrip.com International, Ltd. (ADR) 2 6,807,000 1,607,000 — 8,414,000 — 424,234Sysmex Corp. 1 3,206,800 9,976,800 — 13,183,600 2,478 422,989Carnival PLC 1 2,500,000 7,245,000 — 9,745,000 7,934 371,850Chr. Hansen Holding A/S 1 8,191,000 — 618,000 7,573,000 7,929 300,448Nokian Renkaat Oyj 1 6,206,000 471,000 — 6,677,000 10,021 270,584Paddy Power PLC 1 1,948,937 1,128,371 — 3,077,308 5,109 243,808UCB SA 5 12,702,491 2,726,781 6,113,767 9,315,505 12,381 —$114,132 $9,734,967The following footnotes apply to either the individual securities noted or one or more of the securities aggregated and listed as a single line item.1Valued under fair value procedures adopted by authority of the board of trustees. The total value of all such securities, including those in “Miscellaneous”and “Other securities,” was $104,684,243,000, which represented 84.29% of the net assets of the fund. This amount includes $104,403,143,000 related tocertain securities trading outside the U.S. whose values were adjusted as a result of significant market movements following the close of local trading.2Security did not produce income during the last 12 months.3Represents an affiliated company as defined under the Investment Company Act of 1940.4This security was an unaffiliated issuer in its initial period of acquisition at 3/31/2013; it was not publicly disclosed.5Unaffiliated issuer at 3/31/2014.Key to abbreviations and symbolsADR = <strong>American</strong> Depositary ReceiptsCDI = CREST Depository InterestA$ = Australian dollarsCAD = Canadian dollarsCHF = Swiss francs€ = Euros¥ = Japanese yenSee Notes to Financial Statements18 <strong>EuroPacific</strong> <strong>Growth</strong> <strong>Fund</strong>
Financial statementsStatement of assets and liabilities at March 31, 2014(dollars in thousands)Assets:Investment securities, at value:Unaffiliated issuers (cost: $74,974,847) $114,311,355Affiliated issuers (cost: $7,474,997) 9,734,967 $124,046,322Cash denominated in currencies other than U.S. dollars (cost: $42,532) 42,547Cash 57Unrealized appreciation on open forward currency contracts 17,861Receivables for:Sales of investments 326,298Sales of fund’s shares 289,700Dividends and interest 350,765 966,763125,073,550Liabilities:Unrealized depreciation on open forward currency contracts 4,146Payables for:Purchases of investments 383,833Repurchases of fund’s shares 398,765Closed forward currency contracts 778Investment advisory services 43,779Services provided by related parties 33,083Trustees’ deferred compensation 3,673Other 16,659 880,570Net assets at March 31, 2014 $124,188,834Net assets consist of:Capital paid in on shares of beneficial interest $ 89,473,265Undistributed net investment income 398,318Accumulated net realized loss (7,279,068)Net unrealized appreciation 41,596,319Net assets at March 31, 2014 $124,188,834(dollars and shares in thousands, except per-share amounts)Shares of beneficial interest issued and outstanding (no stated par value) —unlimited shares authorized (2,527,477 total shares outstanding)SharesNet asset valueNet assets outstanding per shareClass A $32,294,988 654,087 $49.37Class B 253,005 5,145 49.17Class C 1,990,393 41,281 48.22Class F-1 9,425,429 191,963 49.10Class F-2 10,713,436 217,240 49.32Class 529-A 1,187,023 24,279 48.89Class 529-B 31,048 642 48.39Class 529-C 377,998 7,896 47.88Class 529-E 62,814 1,295 48.49Class 529-F-1 90,275 1,847 48.89Class R-1 298,595 6,268 47.64Class R-2 1,079,284 22,504 47.96Class R-3 7,219,380 149,164 48.40Class R-4 14,393,790 296,920 48.48Class R-5 12,196,839 247,295 49.32Class R-6 32,574,537 659,651 49.38See Notes to Financial Statements<strong>EuroPacific</strong> <strong>Growth</strong> <strong>Fund</strong> 19
Statement of operations for the year ended March 31, 2014(dollars in thousands)Investment income:Income:Dividends (net of non-U.S. taxes of $241,173;also includes $113,843 from affiliates) $ 2,687,238Interest (includes $289 from affiliates) 10,867 $ 2,698,105Fees and expenses*:Investment advisory services 484,759Distribution services 204,856Transfer agent services 103,468Administrative services 45,025<strong>Report</strong>s to shareholders 3,613Registration statement and prospectus 1,559Trustees’ compensation 883Auditing and legal 286Custodian 19,812Other 2,200 866,461Net investment income 1,831,644Net realized gain and unrealized appreciation on investments,forward currency contracts and currency:Net realized gain (loss) on:Investments (net of non-U.S. taxes of $123; also includes$232,675 net gain from affiliates) 6,697,856Forward currency contracts (57,023)Currency transactions (38,118) 6,602,715Net unrealized appreciation on:Investments (net of non-U.S. taxes of $14,962) 10,322,332Forward currency contracts 1,907Currency translations 3,887 10,328,126Net realized gain and unrealized appreciation on investments,forward currency contracts and currency 16,930,841Net increase in net assets resulting from operations $18,762,485*Additional information related to class-specific fees and expenses is included in the Notes to Financial Statements.Statements of changes in net assets(dollars in thousands)Year ended March 31Operations:2014 2013Net investment income $ 1,831,644 $ 1,536,370Net realized gain on investments, forward currency contractsand currency transactions 6,602,715 512,404Net unrealized appreciation on investments, forward currencycontracts and currency translations 10,328,126 7,018,547Net increase in net assets resulting from operations 18,762,485 9,067,321Dividends paid to shareholders from net investment income (1,238,841) (1,820,998)Net capital share transactions (851,469) (949,939)Total increase in net assets 16,672,175 6,296,384Net assets:Beginning of year 107,516,659 101,220,275End of year (including undistributed and distributions in excess ofnet investment income: $398,318 and $(322,496), respectively) $124,188,834 $107,516,659See Notes to Financial Statements20 <strong>EuroPacific</strong> <strong>Growth</strong> <strong>Fund</strong>
Notes to financial statements1. Organization<strong>EuroPacific</strong> <strong>Growth</strong> <strong>Fund</strong> (the “fund”) is registered under the Investment Company Act of 1940 as an open-end, diversifiedmanagement investment company. The fund seeks long-term growth of capital by investing primarily in the securities of companiesbased in Europe and the Pacific Basin. Shareholders approved a proposal to reorganize the fund from a Massachusetts businesstrust to a Delaware statutory trust. The reorganization may be completed in 2014; however, the fund reserves the right to delay theimplementation.The fund has 16 share classes consisting of five retail share classes (Classes A, B and C, as well as two F share classes, F-1 and F-2), five529 college savings plan share classes (Classes 529-A, 529-B, 529-C, 529-E and 529-F-1) and six retirement plan share classes (ClassesR-1, R-2, R-3, R-4, R-5 and R-6). The 529 college savings plan share classes can be used to save for college education. The retirementplan share classes are generally offered only through eligible employer-sponsored retirement plans. The fund’s share classes aredescribed further in the following table:Contingent deferred salesShare class Initial sales charge charge upon redemption Conversion featureClasses A and 529-A Up to 5.75% None (except 1% for certain redemptions Nonewithin one year of purchase without aninitial sales charge)Classes B and 529-B* None Declines from 5% to 0% for redemptions Classes B and 529-B convert towithin six years of purchaseClasses A and 529-A, respectively,after eight yearsClass C None 1% for redemptions within one year Class C converts to Class F-1of purchaseafter 10 yearsClass 529-C None 1% for redemptions within one year Noneof purchaseClass 529-E None None NoneClasses F-1, F-2 and 529-F-1 None None NoneClasses R-1, R-2, R-3, None None NoneR-4, R-5 and R-6*Class B and 529-B shares of the fund are not available for purchase.Holders of all share classes have equal pro rata rights to assets, dividends and liquidation proceeds. Each share class has identicalvoting rights, except for the exclusive right to vote on matters affecting only its class. Share classes have different fees and expenses(“class-specific fees and expenses”), primarily due to different arrangements for distribution, administrative and shareholder services.Differences in class-specific fees and expenses will result in differences in net investment income and, therefore, the payment ofdifferent per-share dividends by each share class.2. Significant accounting policiesThe financial statements have been prepared to comply with accounting principles generally accepted in the United States of America.These principles require management to make estimates and assumptions that affect reported amounts and disclosures. Actual resultscould differ from those estimates. The fund follows the significant accounting policies described in this section, as well as the valuationpolicies described in the next section on valuation.Security transactions and related investment income — Security transactions are recorded by the fund as of the date the trades areexecuted with brokers. Realized gains and losses from security transactions are determined based on the specific identified cost of thesecurities. In the event a security is purchased with a delayed payment date, the fund will segregate liquid assets sufficient to meet itspayment obligations. Dividend income is recognized on the ex-dividend date and interest income is recognized on an accrual basis. Marketdiscounts, premiums and original issue discounts on fixed-income securities are amortized daily over the expected life of the security.Class allocations — Income, fees and expenses (other than class-specific fees and expenses) and realized and unrealized gains andlosses are allocated daily among the various share classes based on their relative net assets. Class-specific fees and expenses, such asdistribution, administrative and shareholder services, are charged directly to the respective share class.Dividends and distributions to shareholders — Dividends and distributions to shareholders are recorded on the ex-dividend date.<strong>EuroPacific</strong> <strong>Growth</strong> <strong>Fund</strong> 21
Currency translation — Assets and liabilities, including investment securities, denominated in currencies other than U.S. dollars aretranslated into U.S. dollars at the exchange rates supplied by one or more pricing vendors on the valuation date. Purchases and sales ofinvestment securities and income and expenses are translated into U.S. dollars at the exchange rates on the dates of such transactions.The effects of changes in exchange rates on investment securities are included with the net realized gain or loss and net unrealizedappreciation or depreciation on investments in the fund’s statement of operations. The realized gain or loss and unrealized appreciationor depreciation resulting from all other transactions denominated in currencies other than U.S. dollars are disclosed separately.3. ValuationCapital Research and Management Company (“CRMC”), the fund’s investment adviser, values the fund’s investments at fair value asdefined by accounting principles generally accepted in the United States of America. The net asset value of each share class of thefund is generally determined as of approximately 4:00 p.m. New York time each day the New York Stock Exchange is open.Methods and inputs — The fund’s investment adviser uses the following methods and inputs to establish the fair value of the fund’sassets and liabilities. Use of particular methods and inputs may vary over time based on availability and relevance as market andeconomic conditions evolve.Equity securities are generally valued at the official closing price of, or the last reported sale price on, the exchange or market onwhich such securities are traded, as of the close of business on the day the securities are being valued or, lacking any sales, at the lastavailable bid price. Prices for each security are taken from the principal exchange or market on which the security trades.Fixed-income securities, including short-term securities purchased with more than 60 days left to maturity, are generally valued atprices obtained from one or more pricing vendors. Vendors value such securities based on one or more of the inputs described inthe following table. The table provides examples of inputs that are commonly relevant for valuing particular classes of fixed-incomesecurities in which the fund is authorized to invest. However, these classifications are not exclusive, and any of the inputs may be usedto value any other class of fixed-income security.Fixed-income classAllCorporate bonds & notes; convertible securitiesBonds & notes of governments & government agenciesExamples of standard inputsBenchmark yields, transactions, bids, offers, quotations from dealers andtrading systems, new issues, spreads and other relationships observed inthe markets among comparable securities; and proprietary pricingmodels such as yield measures calculated using factors such as cashflows, financial or collateral performance and other reference data(collectively referred to as “standard inputs”)Standard inputs and underlying equity of the issuerStandard inputs and interest rate volatilitiesWhen the fund’s investment adviser deems it appropriate to do so (such as when vendor prices are unavailable or not deemed to berepresentative), fixed-income securities will be valued in good faith at the mean quoted bid and ask prices that are reasonably andtimely available (or bid prices, if ask prices are not available) or at prices for securities of comparable maturity, quality and type.Securities with both fixed-income and equity characteristics, or equity securities traded principally among fixed-income dealers, aregenerally valued in the manner described for either equity or fixed-income securities, depending on which method is deemed mostappropriate by the fund’s investment adviser. Short-term securities purchased within 60 days to maturity are valued at amortizedcost, which approximates fair value. The value of short-term securities originally purchased with maturities greater than 60 days isdetermined based on an amortized value to par when they reach 60 days. Forward currency contracts are valued at the mean ofrepresentative quoted bid and ask prices, generally based on prices supplied by one or more pricing vendors.Securities and other assets for which representative market quotations are not readily available or are considered unreliable by thefund’s investment adviser are fair valued as determined in good faith under fair valuation guidelines adopted by authority of the fund’sboard of trustees as further described. The investment adviser follows fair valuation guidelines, consistent with U.S. Securities andExchange Commission rules and guidance, to consider relevant principles and factors when making fair value determinations. Theinvestment adviser considers relevant indications of value that are reasonably and timely available to it in determining the fair value tobe assigned to a particular security, such as the type and cost of the security; contractual or legal restrictions on resale of the security;relevant financial or business developments of the issuer; actively traded similar or related securities; conversion or exchange rightson the security; related corporate actions; significant events occurring after the close of trading in the security; and changes in overallmarket conditions. In addition, the closing prices of equity securities that trade in markets outside U.S. time zones may be adjusted22 <strong>EuroPacific</strong> <strong>Growth</strong> <strong>Fund</strong>
to reflect significant events that occur after the close of local trading but before the net asset value of each share class of the fund isdetermined. Fair valuations and valuations of investments that are not actively trading involve judgment and may differ materially fromvaluations that would have been used had greater market activity occurred.Processes and structure — The fund’s board of trustees has delegated authority to the fund’s investment adviser to make fair valuedeterminations, subject to board oversight. The investment adviser has established a Joint Fair Valuation Committee (the “Fair ValuationCommittee”) to administer, implement and oversee the fair valuation process, and to make fair value decisions. The Fair ValuationCommittee regularly reviews its own fair value decisions, as well as decisions made under its standing instructions to the investment adviser’svaluation teams. The Fair Valuation Committee reviews changes in fair value measurements from period to period and may, as deemedappropriate, update the fair valuation guidelines to better reflect the results of back testing and address new or evolving issues. The FairValuation Committee reports any changes to the fair valuation guidelines to the board of trustees with supplemental information to supportthe changes. The fund’s board and audit committee also regularly review reports that describe fair value determinations and methods.The fund’s investment adviser has also established a Fixed-Income Pricing Review Group to administer and oversee the fixed-incomevaluation process, including the use of fixed-income pricing vendors. This group regularly reviews pricing vendor information andmarket data. Pricing decisions, processes and controls over security valuation are also subject to additional internal reviews, includingan annual control self-evaluation program facilitated by the investment adviser’s compliance group.Classifications — The fund’s investment adviser classifies the fund’s assets and liabilities into three levels based on the inputs usedto value the assets or liabilities. Level 1 values are based on quoted prices in active markets for identical securities. Level 2 valuesare based on significant observable market inputs, such as quoted prices for similar securities and quoted prices in inactive markets.Certain securities trading outside the U.S. may transfer between Level 1 and Level 2 due to valuation adjustments resulting fromsignificant market movements following the close of local trading. Level 3 values are based on significant unobservable inputs thatreflect the investment adviser’s determination of assumptions that market participants might reasonably use in valuing the securities.The valuation levels are not necessarily an indication of the risk or liquidity associated with the underlying investment. For example,U.S. government securities are reflected as Level 2 because the inputs used to determine fair value may not always be quoted prices inan active market. The following tables present the fund’s valuation levels as of March 31, 2014 (dollars in thousands):Investment securitiesLevel 1 Level 2* Level 3 TotalAssets:Common stocks:Financials $1,913,159 $ 22,829,674 $1,073 $ 24,743,906Information technology 2,143,272 14,020,989 — 16,164,261Health care 931,427 15,083,304 — 16,014,731Consumer discretionary 1,517,054 14,201,510 — 15,718,564Industrials 1,162,755 10,915,091 — 12,077,846Consumer staples 823,527 9,573,111 — 10,396,638Telecommunication services 150,257 4,990,861 — 5,141,118Materials 540,218 4,018,584 — 4,558,802Energy 397,876 1,866,012 — 2,263,888Utilities — 1,818,638 — 1,818,638Miscellaneous 372,026 5,329,638 — 5,701,664Rights — 5,758 — 5,758Bonds, notes & other debt instruments — 409,742 — 409,742Short-term securities — 9,030,766 — 9,030,766Total $9,951,571 $114,093,678 $1,073 $124,046,322Other investments †Level 1 Level 2 Level 3 TotalAssets:Unrealized appreciation on open forward currency contracts $ — $17,861 $ — $17,861Liabilities:Unrealized depreciation on open forward currency contracts — (4,146) — (4,146)Total $ — $13,715 $ — $13,715*Securities with a value of $91,127,553,000, which represented 73.38% of the net assets of the fund, transferred from Level 1 to Level 2 since the prior fiscalyear-end, primarily due to significant market movements following the close of local trading.† Forward currency contracts are not included in the investment portfolio.<strong>EuroPacific</strong> <strong>Growth</strong> <strong>Fund</strong> 23
4. Risk factorsInvesting in the fund may involve certain risks including, but not limited to, those described below.Market conditions — The prices of, and the income generated by, the common stocks and other securities held by the fund maydecline — sometimes rapidly or unpredictably — due to various factors, including events or conditions affecting the general economyor particular industries; overall market changes; local, regional or global political, social or economic instability; governmental orgovernmental agency responses to economic conditions; and currency, interest rate and commodity price fluctuations.Issuer risks — The values of, and the income generated by, securities held by the fund may also decline in response to various factorsdirectly related to the issuers of such securities, including reduced demand for an issuer’s goods or services, poor managementperformance and strategic initiatives such as mergers, acquisitions or dispositions and the market response to any such initiative.Investing in growth-oriented stocks — <strong>Growth</strong>-oriented common stocks and other equity-type securities (such as preferred stocks,convertible preferred stocks and convertible bonds) may involve larger price swings and greater potential for loss than other types ofinvestments. These risks may be even greater in the case of smaller capitalization stocks.Investing outside the U.S. — Securities of issuers domiciled outside the U.S., or with significant operations outside the U.S., may losevalue because of adverse political, social, economic or market developments in the countries or regions in which the issuers operate.These securities may also lose value due to changes in foreign currency exchange rates against the U.S. dollar and/or currencies ofother countries. Securities markets in certain countries may be more volatile and/or less liquid than those in the U.S. Investmentsoutside the U.S. may also be subject to different accounting practices and different regulatory, legal and reporting standards, and maybe more difficult to value, than those in the U.S. In addition, the value of investments outside the U.S. may be reduced by foreign taxes,including foreign withholding taxes on interest and dividends. Further, there may be increased risks of delayed settlement of securitiespurchased or sold by the fund. The risks of investing outside the U.S. may be heightened in connection with investments in emergingmarkets.Investing in emerging markets — Investing in emerging markets may involve risks in addition to and greater than those generallyassociated with investing in the securities markets of developed countries. For instance, developing countries may have lessdeveloped legal and accounting systems than those in developed countries. The governments of these countries may be lessstable and more likely to impose capital controls, nationalize a company or industry, place restrictions on foreign ownership andon withdrawing sale proceeds of securities from the country, and/or impose punitive taxes that could adversely affect the prices ofsecurities. In addition, the economies of these countries may be dependent on relatively few industries that are more susceptibleto local and global changes. Securities markets in these countries can also be relatively small and have substantially lower tradingvolumes. As a result, securities issued in these countries may be more volatile and less liquid, and may be more difficult to value, thansecurities issued in countries with more developed economies and/or markets. Additionally, there may be increased settlement risksfor transactions in local securities.Management — The investment adviser to the fund actively manages the fund’s investments. Consequently, the fund is subject to therisk that the methods and analyses employed by the investment adviser in this process may not produce the desired results. This couldcause the fund to lose value or its investment results to lag relevant benchmarks or other funds with similar objectives.5. Certain investment techniquesForward currency contracts — The fund has entered into forward currency contracts, which represent agreements to exchangecurrencies on specific future dates at predetermined rates. The fund’s investment adviser uses forward currency contracts to managethe fund’s exposure to changes in exchange rates. Upon entering into these contracts, risks may arise from the potential inability ofcounterparties to meet the terms of their contracts and from possible movements in exchange rates.On a daily basis, the fund’s investment adviser values forward currency contracts and records unrealized appreciation or depreciationfor open forward currency contracts in the fund’s statement of assets and liabilities. Realized gains or losses are recorded at the timethe forward currency contract is closed or offset by another contract with the same broker for the same settlement date and currency.Closed forward currency contracts that have not reached their settlement date are included in the respective receivables or payablesfor closed forward currency contracts in the fund’s statement of assets and liabilities. Net realized gains or losses from closed forwardcurrency contracts and net unrealized appreciation or depreciation from open forward currency contracts are recorded in the fund’sstatement of operations.24 <strong>EuroPacific</strong> <strong>Growth</strong> <strong>Fund</strong>
The following tables present the financial statement impacts resulting from the fund’s use of forward currency contracts as of March 31,2014 (dollars in thousands):AssetLiabilityLocation on statement ofLocation on statement ofContract assets and liabilities Value assets and liabilities ValueForward currency Unrealized appreciation on open $ 17,861 Unrealized depreciation on open $4,146forward currency contractsforward currency contractsForward currency Receivables for closed forward — Payables for closed forward 778currency contractscurrency contracts$ 17,861 $4,924Net realized lossNet unrealized appreciationLocation on statementLocation on statementContract of operations Value of operations ValueForward currency Net realized loss on forward $(57,023) Net unrealized appreciation on $1,907currency contractsforward currency contractsCollateral — The fund has entered into a collateral program due to its use of forward currency contracts. The program calls for thefund to either receive or pledge collateral based on the net gain or loss on unsettled forward currency contracts by counterparty.The purpose of the collateral is to cover potential losses that could occur in the event that either party cannot meet its contractualobligations.Rights of setoff — The fund has entered into enforceable master netting agreements with certain counterparties for forward currencycontracts, where amounts payable by each party to the other in the same currency, with the same settlement date and with the samecounterparty are settled net of each party’s payment obligation. For financial reporting purposes, the fund does not offset financialassets and financial liabilities that are subject to netting arrangements in the statement of assets and liabilities.The following table presents the fund’s forward currency contracts by counterparty, including those that are subject to potential offseton the statement of assets and liabilities as of March 31, 2014 (dollars in thousands):Gross amounts not offset in thestatement of assets and liabilities andGross amountssubject to a master netting agreementrecognized in thestatement of assets Available Non-cash Cash NetCounterparty and liabilities to offset collateral* collateral amountAssets Bank of America, N.A. $ 2,908 $ — $(2,368) $ — $ 540Bank of New York Mellon 692 — (430) — 262Barclays Bank PLC 5,491 (258) (1,770) — 3,463Citibank 181 (18) (163) — —HSBC Bank 6,365 (1,530) (2,753) — 2,082JPMorgan Chase 1,932 (1,002) (543) — 387UBS AG 292 (292) — — —$17,861 $(3,100) $(8,027) $ — $6,734Liabilities Barclays Bank PLC $ 258 $ (258) $ — $ — $ —Citibank 18 (18) — — —HSBC Bank 1,530 (1,530) — — —JPMorgan Chase 1,002 (1,002) — — —UBS AG 2,116 (292) (1,707) — 117*Non-cash collateral is shown on a settlement basis.$ 4,924 $(3,100) $(1,707) $ — $ 117<strong>EuroPacific</strong> <strong>Growth</strong> <strong>Fund</strong> 25
6. Taxation and distributionsFederal income taxation — The fund complies with the requirements under Subchapter M of the Internal Revenue Code applicable tomutual funds and intends to distribute substantially all of its net taxable income and net capital gains each year. The fund is not subjectto income taxes to the extent such distributions are made. Therefore, no federal income tax provision is required.As of and during the period ended March 31, 2014, the fund did not have a liability for any unrecognized tax benefits. The fundrecognizes interest and penalties, if any, related to unrecognized tax benefits as income tax expense in the statement of operations.During the period, the fund did not incur any interest or penalties.The fund is not subject to examination by U.S. federal tax authorities for tax years before 2010, by state tax authorities for tax yearsbefore 2009 and by tax authorities outside the U.S. for tax years before 2006.Non-U.S. taxation — Dividend and interest income are recorded net of non-U.S. taxes paid. Gains realized by the fund on the saleof securities in certain countries are subject to non-U.S. taxes. The fund records a liability based on unrealized gains to provide forpotential non-U.S. taxes payable upon the sale of these securities.Distributions — Distributions paid to shareholders are based on net investment income and net realized gains determined on a taxbasis, which may differ from net investment income and net realized gains for financial reporting purposes. These differences are dueprimarily to different treatment for items such as currency gains and losses; short-term capital gains and losses; capital losses related tosales of certain securities within 30 days of purchase; unrealized appreciation of certain investments in securities outside the U.S.; costof investments sold; and net capital losses. The fiscal year in which amounts are distributed may differ from the year in which the netinvestment income and net realized gains are recorded by the fund for financial reporting purposes.During the year ended March 31, 2014, the fund reclassified $73,000 from undistributed net investment income to capital paid in onshares of beneficial interest and $128,084,000 from accumulated net realized loss to undistributed net investment income to alignfinancial reporting with tax reporting.Under the Regulated Investment Company Modernization Act of 2010 (the “Act”), net capital losses recognized after March 31, 2011,may be carried forward indefinitely, and their character is retained as short-term and/or long-term losses. Previously, net capital losseswere carried forward for eight years and treated as short-term losses. As a transition rule, the Act requires that post-enactment netcapital losses be used before pre-enactment net capital losses.As of March 31, 2014, the tax basis components of distributable earnings, unrealized appreciation (depreciation) and cost ofinvestment securities were as follows (dollars in thousands):Undistributed ordinary income $ 1,029,409Capital loss carryforward expiring 2018* (6,846,399)Post-October capital loss deferral † (7,553)Gross unrealized appreciation on investment securities 42,087,172Gross unrealized depreciation on investment securities (1,529,593)Net unrealized appreciation on investment securities 40,557,579Cost of investment securities 83,488,743*Reflects the utilization of capital loss carryforward of $6,377,259,000. The capital loss carryforward will be used to offset any capital gains realized by thefund in future years through the expiration date. The fund will not make distributions from capital gains while a capital loss carryforward remains.†This deferral is considered incurred in the subsequent year.26 <strong>EuroPacific</strong> <strong>Growth</strong> <strong>Fund</strong>
Tax-basis distributions paid to shareholders from ordinary income were as follows (dollars in thousands):Year ended March 31Share class 2014 2013Class A $ 299,130 $ 490,114Class B 199 2,741Class C 4,118 16,880Class F-1 81,016 129,588Class F-2 118,419 144,367Class 529-A 10,359 15,943Class 529-B — 286Class 529-C 758 2,993Class 529-E 416 726Class 529-F-1 972 1,308Class R-1 556 2,813Class R-2 2,853 10,111Class R-3 49,012 97,678Class R-4 135,957 216,783Class R-5 160,460 266,737Class R-6 374,616 421,930Total $1,238,841 $1,820,9987. Fees and transactions with related partiesCRMC, the fund’s investment adviser, is the parent company of <strong>American</strong> <strong>Fund</strong>s Distributors,® Inc. (“AFD”), the principal underwriterof the fund’s shares, and <strong>American</strong> <strong>Fund</strong>s Service Company® (“AFS”), the fund’s transfer agent. CRMC, AFD and AFS are consideredrelated parties to the fund.Investment advisory services — The fund has an investment advisory and service agreement with CRMC that provides for monthly feesaccrued daily. These fees are based on a series of decreasing annual rates beginning with 0.690% on the first $500 million of daily netassets and decreasing to 0.397% on such assets in excess of $115 billion. For the year ended March 31, 2014, the investment advisoryservices fee was $484,759,000, which was equivalent to an annualized rate of 0.421% of average daily net assets.Class-specific fees and expenses — Expenses that are specific to individual share classes are accrued directly to the respective shareclass. The principal class-specific fees and expenses are described below:Distribution services — The fund has plans of distribution for all share classes, except Class F-2, R-5 and R-6 shares. Under theplans, the board of trustees approves certain categories of expenses that are used to finance activities primarily intended to sellfund shares and service existing accounts. The plans provide for payments, based on an annualized percentage of average dailynet assets, ranging from 0.25% to 1.00% as noted in this section. In some cases, the board of trustees has limited the amountsthat may be paid to less than the maximum allowed by the plans. All share classes with a plan may use up to 0.25% of averagedaily net assets to pay service fees, or to compensate AFD for paying service fees, to firms that have entered into agreements withAFD to provide certain shareholder services. The remaining amounts available to be paid under each plan are paid to dealers tocompensate them for their sales activities.For Class A and 529-A shares, distribution-related expenses include the reimbursement of dealer and wholesaler commissionspaid by AFD for certain shares sold without a sales charge. These share classes reimburse AFD for amounts billed within the prior15 months but only to the extent that the overall annual expense limit of 0.25% is not exceeded. As of March 31, 2014, there wereno unreimbursed expenses subject to reimbursement for Class A or 529-A shares.Share class Currently approved limits Plan limitsClass A 0.25% 0.25%Class 529-A 0.25 0.50Classes B and 529-B 1.00 1.00Classes C, 529-C and R-1 1.00 1.00Class R-2 0.75 1.00Classes 529-E and R-3 0.50 0.75Classes F-1, 529-F-1 and R-4 0.25 0.50<strong>EuroPacific</strong> <strong>Growth</strong> <strong>Fund</strong> 27
Transfer agent services — The fund has a shareholder services agreement with AFS under which the fund compensates AFSfor providing transfer agent services to each of the fund’s share classes. These services include recordkeeping, shareholdercommunications and transaction processing. In addition, the fund reimburses AFS for amounts paid to third parties forperforming transfer agent services on behalf of fund shareholders.Administrative services — The fund has an administrative services agreement with CRMC under which the fund compensates CRMCfor providing administrative services to Class A, C, F, 529 and R shares. These services include, but are not limited to, coordinating,monitoring, assisting and overseeing third parties that provide services to fund shareholders. Under the agreement, Class A sharespay an annual fee of 0.01% and Class C, F, 529 and R shares pay an annual fee of 0.05% of their respective average daily net assets.529 plan services — Each 529 share class is subject to service fees to compensate the Commonwealth of Virginia for themaintenance of the 529 college savings plan. For the year ended March 31, 2014, the quarterly fee was based on a series ofdecreasing annual rates beginning with 0.10% on the first $30 billion of the net assets invested in Class 529 shares of the <strong>American</strong><strong>Fund</strong>s and decreasing to 0.06% on such assets between $120 billion and $150 billion. Effective April 1, 2014, the quarterly fee wasamended to provide for reduced annual rates of 0.07%, 0.06% and 0.05% over $30 billion, $50 billion and $70 billion, respectively,of the net assets invested in Class 529 shares of the <strong>American</strong> <strong>Fund</strong>s. The fee for any given calendar quarter is accrued andcalculated on the basis of the average net assets of Class 529 shares of the <strong>American</strong> <strong>Fund</strong>s for the last month of the prior calendarquarter. The fee is included in other expenses in the fund’s statement of operations. The Commonwealth of Virginia is notconsidered a related party.For the year ended March 31, 2014, class-specific expenses under the agreements were as follows (dollars in thousands):Distribution Transfer agent Administrative 529 planShare class services services services servicesClass A $ 74,419 $ 45,446 $ 3,110 Not applicableClass B 2,935 403 Not applicable Not applicableClass C 19,295 2,445 969 Not applicableClass F-1 21,894 11,343 4,398 Not applicableClass F-2 Not applicable 8,373 4,526 Not applicableClass 529-A 2,312 999 541 $1,055Class 529-B 349 41 18 34Class 529-C 3,482 360 176 343Class 529-E 288 38 29 56Class 529-F-1 — 77 41 81Class R-1 2,897 329 145 Not applicableClass R-2 7,845 3,575 529 Not applicableClass R-3 35,395 10,178 3,551 Not applicableClass R-4 33,745 13,574 6,760 Not applicableClass R-5 Not applicable 6,197 6,508 Not applicableClass R-6 Not applicable 90 13,724 Not applicableTotal class-specific expenses $204,856 $103,468 $45,025 $1,569Trustees’ deferred compensation — Trustees who are unaffiliated with CRMC may elect to defer the cash payment of part or all oftheir compensation. These deferred amounts, which remain as liabilities of the fund, are treated as if invested in shares of the fund orother <strong>American</strong> <strong>Fund</strong>s. These amounts represent general, unsecured liabilities of the fund and vary according to the total returns ofthe selected funds. Trustees’ compensation of $883,000 in the fund’s statement of operations includes $346,000 in current fees (eitherpaid in cash or deferred) and a net increase of $537,000 in the value of the deferred amounts.Affiliated officers and trustees — Officers and certain trustees of the fund are or may be considered to be affiliated with CRMC, AFDand AFS. No affiliated officers or trustees received any compensation directly from the fund.28 <strong>EuroPacific</strong> <strong>Growth</strong> <strong>Fund</strong>
8. Capital share transactionsCapital share transactions in the fund were as follows (dollars and shares in thousands):Reinvestments ofNet (decrease)Sales* dividends Repurchases* increaseShare class Amount Shares Amount Shares Amount Shares Amount SharesYear ended March 31, 2014Class A $ 3,117,893 67,652 $ 291,351 6,020 $ (5,795,209) (126,005) $(2,385,965) (52,333)Class B 5,483 119 197 4 (128,445) (2,809) (122,765) (2,686)Class C 262,029 5,784 4,006 84 (466,768) (10,381) (200,733) (4,513)Class F-1 2,265,788 49,621 79,710 1,656 (2,543,987) (55,945) (198,489) (4,668)Class F-2 3,289,346 70,625 103,593 2,144 (1,857,593) (40,436) 1,535,346 32,333Class 529-A 132,482 2,892 10,357 216 (118,339) (2,614) 24,500 494Class 529-B 721 16 — — (14,107) (313) (13,386) (297)Class 529-C 42,312 944 758 16 (47,318) (1,066) (4,248) (106)Class 529-E 7,307 161 416 9 (6,905) (153) 818 17Class 529-F-1 16,326 359 971 20 (13,598) (295) 3,699 84Class R-1 52,278 1,177 555 12 (86,297) (1,958) (33,464) (769)Class R-2 223,949 5,023 2,850 61 (348,879) (7,840) (122,080) (2,756)Class R-3 1,453,227 32,318 48,991 1,032 (2,324,885) (51,699) (822,667) (18,349)Class R-4 3,210,218 71,249 135,938 2,861 (3,965,194) (88,560) (619,038) (14,450)Class R-5 2,523,579 55,341 160,113 3,314 (6,193,730) (136,097) (3,510,038) (77,442)Class R-6 10,409,982 227,020 373,366 7,719 (5,166,307) (111,691) 5,617,041 123,048Total net increase(decrease) $27,012,920 590,301 $1,213,172 25,168 $(29,077,561) (637,862) $ (851,469) (22,393)Year ended March 31, 2013Class A $ 2,379,519 59,951 $ 475,517 11,615 $ (6,351,562) (161,770) $(3,496,526) (90,204)Class B 3,948 100 2,706 66 (162,254) (4,179) (155,600) (4,013)Class C 138,887 3,547 16,361 408 (491,314) (12,888) (336,066) (8,933)Class F-1 2,600,862 66,610 127,239 3,125 (2,406,183) (61,519) 321,918 8,216Class F-2 2,697,120 68,073 125,753 3,078 (1,484,515) (37,323) 1,338,358 33,828Class 529-A 111,068 2,824 15,939 393 (123,071) (3,150) 3,936 67Class 529-B 753 19 286 7 (16,817) (439) (15,778) (413)Class 529-C 36,113 940 2,992 75 (52,464) (1,378) (13,359) (363)Class 529-E 6,182 158 726 18 (7,174) (185) (266) (9)Class 529-F-1 14,348 367 1,307 32 (12,105) (308) 3,550 91Class R-1 49,265 1,297 2,806 71 (84,127) (2,201) (32,056) (833)Class R-2 232,252 6,038 10,097 253 (369,238) (9,634) (126,889) (3,343)Class R-3 1,519,083 39,050 97,591 2,430 (2,042,380) (52,694) (425,706) (11,214)Class R-4 2,807,400 72,154 216,741 5,390 (3,426,909) (88,172) (402,768) (10,628)Class R-5 2,654,661 66,931 266,003 6,512 (4,119,258) (104,205) (1,198,594) (30,762)Class R-6 7,278,252 183,103 420,217 10,274 (4,112,562) (102,676) 3,585,907 90,701Total net increase(decrease) $22,529,713 571,162 $1,782,281 43,747 $(25,261,933) (642,721) $ (949,939) (27,812)*Includes exchanges between share classes of the fund.9. Investment transactionsThe fund made purchases and sales of investment securities, excluding short-term securities and U.S. government obligations, if any,of $30,018,570,000 and $33,334,143,000, respectively, during the year ended March 31, 2014.<strong>EuroPacific</strong> <strong>Growth</strong> <strong>Fund</strong> 29
Financial highlightsIncome (loss) frominvestment operations 1Net assetvalue,beginningof periodNetinvestmentincome 2Net gains(losses) onsecurities(bothrealized andunrealized)Total frominvestmentoperationsDividends(from netinvestmentincome)Net assetvalue, endof periodTotalreturn 3Net assets,end of period(in millions)Ratio ofexpenses toaverage netassetsRatio ofnet incometo averagenet assets 2Class A:Year ended 3/31/2014 $42.38 $.69 $ 6.75 $ 7.44 $(.45) $49.37 17.57% $32,295 .84% 1.50%Year ended 3/31/2013 39.47 .58 3.02 3.60 (.69) 42.38 9.19 29,939 .86 1.48Year ended 3/31/2012 42.81 .65 (3.40) (2.75) (.59) 39.47 (6.25) 31,443 .84 1.65Year ended 3/31/2011 38.62 .54 4.22 4.76 (.57) 42.81 12.39 39,417 .82 1.39Year ended 3/31/2010 25.78 .51 12.95 13.46 (.62) 38.62 52.23 40,426 .85 1.45Class B:Year ended 3/31/2014 42.16 .33 6.71 7.04 (.03) 49.17 16.70 253 1.58 .73Year ended 3/31/2013 39.20 .32 2.96 3.28 (.32) 42.16 8.39 330 1.59 .81Year ended 3/31/2012 42.39 .37 (3.34) (2.97) (.22) 39.20 (6.95) 464 1.58 .96Year ended 3/31/2011 38.21 .26 4.15 4.41 (.23) 42.39 11.57 741 1.57 .69Year ended 3/31/2010 25.52 .26 12.79 13.05 (.36) 38.21 51.12 923 1.59 .77Class C:Year ended 3/31/2014 41.41 .32 6.59 6.91 (.10) 48.22 16.69 1,990 1.62 .72Year ended 3/31/2013 38.57 .28 2.92 3.20 (.36) 41.41 8.34 1,896 1.63 .73Year ended 3/31/2012 41.76 .34 (3.28) (2.94) (.25) 38.57 (6.97) 2,111 1.62 .89Year ended 3/31/2011 37.70 .23 4.10 4.33 (.27) 41.76 11.51 2,851 1.61 .60Year ended 3/31/2010 25.21 .22 12.65 12.87 (.38) 37.70 51.06 2,901 1.63 .66Class F-1:Year ended 3/31/2014 42.15 .67 6.72 7.39 (.44) 49.10 17.55 9,425 .87 1.47Year ended 3/31/2013 39.27 .57 3.01 3.58 (.70) 42.15 9.19 8,288 .85 1.45Year ended 3/31/2012 42.59 .63 (3.37) (2.74) (.58) 39.27 (6.25) 7,399 .86 1.62Year ended 3/31/2011 38.43 .52 4.20 4.72 (.56) 42.59 12.36 8,868 .85 1.35Year ended 3/31/2010 25.66 .49 12.91 13.40 (.63) 38.43 52.24 8,601 .86 1.39Class F-2:Year ended 3/31/2014 42.33 .82 6.74 7.56 (.57) 49.32 17.90 10,714 .59 1.78Year ended 3/31/2013 39.44 .66 3.05 3.71 (.82) 42.33 9.47 7,828 .59 1.67Year ended 3/31/2012 42.80 .73 (3.39) (2.66) (.70) 39.44 (6.02) 5,958 .58 1.86Year ended 3/31/2011 38.62 .61 4.25 4.86 (.68) 42.80 12.65 6,216 .59 1.54Year ended 3/31/2010 25.78 .47 13.10 13.57 (.73) 38.62 52.65 4,028 .60 1.31Class 529-A:Year ended 3/31/2014 41.98 .66 6.69 7.35 (.44) 48.89 17.52 1,187 .90 1.45Year ended 3/31/2013 39.12 .55 2.99 3.54 (.68) 41.98 9.12 999 .91 1.40Year ended 3/31/2012 42.45 .61 (3.35) (2.74) (.59) 39.12 (6.30) 928 .89 1.56Year ended 3/31/2011 38.31 .51 4.20 4.71 (.57) 42.45 12.36 982 .87 1.31Year ended 3/31/2010 25.59 .48 12.86 13.34 (.62) 38.31 52.14 826 .89 1.37Class 529-B:Year ended 3/31/2014 41.51 .28 6.60 6.88 — 48.39 16.58 31 1.70 .62Year ended 3/31/2013 38.61 .26 2.92 3.18 (.28) 41.51 8.26 39 1.71 .68Year ended 3/31/2012 41.77 .32 (3.29) (2.97) (.19) 38.61 (7.05) 52 1.70 .83Year ended 3/31/2011 37.68 .21 4.09 4.30 (.21) 41.77 11.43 79 1.68 .56Year ended 3/31/2010 25.20 .20 12.63 12.83 (.35) 37.68 50.94 91 1.71 .59Class 529-C:Year ended 3/31/2014 41.15 .29 6.54 6.83 (.10) 47.88 16.57 378 1.68 .66Year ended 3/31/2013 38.36 .24 2.93 3.17 (.38) 41.15 8.29 329 1.70 .62Year ended 3/31/2012 41.60 .29 (3.26) (2.97) (.27) 38.36 (7.05) 321 1.68 .77Year ended 3/31/2011 37.58 .20 4.09 4.29 (.27) 41.60 11.46 356 1.67 .52Year ended 3/31/2010 25.14 .20 12.62 12.82 (.38) 37.58 50.98 313 1.70 .57Class 529-E:Year ended 3/31/2014 41.65 .54 6.63 7.17 (.33) 48.49 17.22 63 1.15 1.19Year ended 3/31/2013 38.82 .44 2.97 3.41 (.58) 41.65 8.86 53 1.17 1.14Year ended 3/31/2012 42.11 .50 (3.32) (2.82) (.47) 38.82 (6.58) 50 1.16 1.29Year ended 3/31/2011 38.02 .39 4.16 4.55 (.46) 42.11 12.03 55 1.16 1.02Year ended 3/31/2010 25.41 .37 12.77 13.14 (.53) 38.02 51.73 46 1.19 1.08See page 28 for footnotes.30 <strong>EuroPacific</strong> <strong>Growth</strong> <strong>Fund</strong>
<strong>Report</strong> of Independent Registered Public Accounting FirmTo the Shareholders and Board of Trustees of <strong>EuroPacific</strong> <strong>Growth</strong> <strong>Fund</strong>:We have audited the accompanying statement of assets and liabilities of <strong>EuroPacific</strong> <strong>Growth</strong> <strong>Fund</strong> (the “<strong>Fund</strong>”), including the summaryinvestment portfolio, as of March 31, 2014, and the related statement of operations for the year then ended, the statements of changesin net assets for each of the two years in the period then ended, and the financial highlights for each of the periods presented. Thesefinancial statements and financial highlights are the responsibility of the <strong>Fund</strong>’s management. Our responsibility is to express anopinion on these financial statements and financial highlights based on our audits.We conducted our audits in accordance with the standards of the Public Company Accounting Oversight Board (United States). Thosestandards require that we plan and perform the audit to obtain reasonable assurance about whether the financial statements andfinancial highlights are free of material misstatement. The <strong>Fund</strong> is not required to have, nor were we engaged to perform, an audit ofits internal control over financial reporting. Our audits included consideration of internal control over financial reporting as a basisfor designing audit procedures that are appropriate in the circumstances, but not for the purpose of expressing an opinion on theeffectiveness of the <strong>Fund</strong>’s internal control over financial reporting. Accordingly, we express no such opinion. An audit also includesexamining, on a test basis, evidence supporting the amounts and disclosures in the financial statements, assessing the accountingprinciples used and significant estimates made by management, as well as evaluating the overall financial statement presentation.Our procedures included confirmation of securities owned as of March 31, 2014, by correspondence with the custodian and brokers;where replies were not received from brokers, we performed other auditing procedures. We believe that our audits provide areasonable basis for our opinion.In our opinion, such financial statements and financial highlights referred to above present fairly, in all material respects, the financialposition of <strong>EuroPacific</strong> <strong>Growth</strong> <strong>Fund</strong> as of March 31, 2014, the results of its operations for the year then ended, the changes in its netassets for each of the two years in the period then ended, and the financial highlights for each of the periods presented, in conformitywith accounting principles generally accepted in the United States of America.Deloitte & Touche LLPCosta Mesa, CaliforniaMay 12, 201432 <strong>EuroPacific</strong> <strong>Growth</strong> <strong>Fund</strong>
Tax informationunauditedWe are required to advise you of the federal tax status of certain distributions received by shareholders during the fiscal year. The fundhereby designates the following amounts for the fund’s fiscal year ended March 31, 2014:Foreign taxes$0.10 per shareForeign source income$1.16 per shareQualified dividend income 100%U.S. government income that may be exempt from state taxation $2,992,000Individual shareholders should refer to their Form 1099 or other tax information, which will be mailed in January 2015, todetermine the calendar year amounts to be included on their 2014 tax returns. Shareholders should consult their tax advisors.<strong>EuroPacific</strong> <strong>Growth</strong> <strong>Fund</strong> 33
Expense exampleunauditedAs a fund shareholder, you incur twotypes of costs: (1) transaction costs,such as initial sales charges on purchasepayments and contingent deferred salescharges on redemptions (loads), and (2)ongoing costs, including managementfees, distribution and service (12b-1)fees, and other expenses. This exampleis intended to help you understand yourongoing costs (in dollars) of investing inthe fund so you can compare these costswith the ongoing costs of investing inother mutual funds. The example is basedon an investment of $1,000 invested at thebeginning of the period and held for theentire six-month period (October 1, 2013,through March 31, 2014).Actual expenses:The first line of each share class in the table on the following page provides informationabout actual account values and actual expenses. You may use the information in thisline, together with the amount you invested, to estimate the expenses that you paid overthe period. Simply divide your account value by $1,000 (for example, an $8,600 accountvalue divided by $1,000 = 8.6), then multiply the result by the number in the first lineunder the heading entitled “Expenses paid during period” to estimate the expenses youpaid on your account during this period.Hypothetical example for comparison purposes:The second line of each share class in the table on the following page providesinformation about hypothetical account values and hypothetical expenses based onthe actual expense ratio for the share class and an assumed rate of return of 5.00% peryear before expenses, which is not the actual return of the share class. The hypotheticalaccount values and expenses may not be used to estimate the actual ending accountbalance or expenses you paid for the period. You may use this information to comparethe ongoing costs of investing in the fund and other funds. To do so, compare this5.00% hypothetical example with the 5.00% hypothetical examples that appear in theshareholder reports of the other funds.Notes:There are some account fees that are charged to certain types of accounts, such asindividual retirement accounts and 529 college savings plan accounts (generally, a $10fee is charged to set up the account and an additional $10 fee is charged to the accountannually), that would increase the amount of expenses paid on your account. In addition,retirement plan participants may be subject to certain fees charged by the plan sponsor,and Class F-1, F-2 and 529-F-1 shareholders may be subject to fees charged by financialintermediaries, typically ranging from 0.75% to 1.50% of assets annually depending onservices offered. You can estimate the impact of these fees by adding the amount ofthe fees to the total estimated expenses you paid on your account during the period ascalculated above. In addition, your ending account value would be lower by the amountof these fees.Note that the expenses shown in the table on the following page are meant to highlightyour ongoing costs only and do not reflect any transactional costs, such as sales charges(loads). Therefore, the second line of each share class in the table is useful in comparingongoing costs only and will not help you determine the relative total costs of owningdifferent funds. In addition, if these transactional costs were included, your costs wouldhave been higher.34 <strong>EuroPacific</strong> <strong>Growth</strong> <strong>Fund</strong>
BeginningEndingaccount value account value Expenses paid <strong>Annual</strong>ized10/1/2013 3/31/2014 during period* expense ratioClass A — actual return $1,000.00 $1,082.98 $4.26 .82%Class A — assumed 5% return 1,000.00 1,020.84 4.13 .82Class B — actual return 1,000.00 1,079.04 8.09 1.56Class B — assumed 5% return 1,000.00 1,017.15 7.85 1.56Class C — actual return 1,000.00 1,079.02 8.29 1.60Class C — assumed 5% return 1,000.00 1,016.95 8.05 1.60Class F-1 — actual return 1,000.00 1,082.95 4.47 .86Class F-1 — assumed 5% return 1,000.00 1,020.64 4.33 .86Class F-2 — actual return 1,000.00 1,084.45 3.01 .58Class F-2 — assumed 5% return 1,000.00 1,022.04 2.92 .58Class 529-A — actual return 1,000.00 1,082.62 4.62 .89Class 529-A — assumed 5% return 1,000.00 1,020.49 4.48 .89Class 529-B — actual return 1,000.00 1,078.47 8.76 1.69Class 529-B — assumed 5% return 1,000.00 1,016.50 8.50 1.69Class 529-C — actual return 1,000.00 1,078.42 8.71 1.68Class 529-C — assumed 5% return 1,000.00 1,016.55 8.45 1.68Class 529-E — actual return 1,000.00 1,081.28 5.97 1.15Class 529-E — assumed 5% return 1,000.00 1,019.20 5.79 1.15Class 529-F-1 — actual return 1,000.00 1,083.79 3.53 .68Class 529-F-1 — assumed 5% return 1,000.00 1,021.54 3.43 .68Class R-1 — actual return 1,000.00 1,078.90 8.29 1.60Class R-1 — assumed 5% return 1,000.00 1,016.95 8.05 1.60Class R-2 — actual return 1,000.00 1,078.91 8.19 1.58Class R-2 — assumed 5% return 1,000.00 1,017.05 7.95 1.58Class R-3 — actual return 1,000.00 1,081.35 5.86 1.13Class R-3 — assumed 5% return 1,000.00 1,019.30 5.69 1.13Class R-4 — actual return 1,000.00 1,083.14 4.36 .84Class R-4 — assumed 5% return 1,000.00 1,020.74 4.23 .84Class R-5 — actual return 1,000.00 1,084.50 2.81 .54Class R-5 — assumed 5% return 1,000.00 1,022.24 2.72 .54Class R-6 — actual return 1,000.00 1,084.78 2.55 .49Class R-6 — assumed 5% return 1,000.00 1,022.49 2.47 .49*The “expenses paid during period” are equal to the “annualized expense ratio,” multiplied by the average account value over the period, multiplied bythe number of days in the period, and divided by 365 (to reflect the one-half year period).<strong>EuroPacific</strong> <strong>Growth</strong> <strong>Fund</strong> 35
Approval of Investment Advisory and Service AgreementThe <strong>EuroPacific</strong> <strong>Growth</strong> <strong>Fund</strong>’s boardhas approved the fund’s InvestmentAdvisory and Service Agreement(the “agreement”) with CapitalResearch and Management Company(“CRMC”) for an additional one-yearterm through December 31, 2014.The board approved the agreementfollowing the recommendation ofthe fund’s Contracts Committee (the“committee”), which is composedof all of the fund’s independentboard members. The board and thecommittee determined that the fund’sadvisory fee structure was fair andreasonable in relation to the servicesprovided and that approving theagreement was in the best interests ofthe fund and its shareholders.In reaching this decision, the boardand the committee took into accountinformation furnished to themthroughout the year and otherwiseprovided to them, as well as informationprepared specifically in connection withtheir review of the agreement, and wereadvised by their independent counsel.They considered the following factors,among others, but did not identifyany single issue or particular piece ofinformation that, in isolation, was thecontrolling factor, and each board andcommittee member did not necessarilyattribute the same weight to each factor.1. Nature, extent and quality of servicesThe board and the committee considered the depth and quality of CRMC’s investmentmanagement process, including its global research capabilities; the experience,capability and integrity of its senior management and other personnel; the low turnoverrates of its key personnel; the overall financial strength and stability of it and the Capitalorganization; and the ongoing evolution of CRMC’s organizational structure designed tomaintain and strengthen these qualities. The board and the committee also consideredthe nature, extent and quality of administrative, compliance and shareholder servicesprovided by CRMC to the fund under the agreement and other agreements, as well asthe benefits to fund shareholders from investing in a fund that is part of a large family offunds. The board and the committee concluded that the nature, extent and quality of theservices provided by CRMC have benefited and should continue to benefit the fund andits shareholders.2. Investment resultsThe board and the committee considered the investment results of the fund in lightof its objective of providing long-term growth of capital. They compared the fund’sinvestment results with those of other relevant funds (including funds that form thebasis of the Lipper index for the category in which the fund is included), and data suchas relevant market and fund indexes, over various periods through June 30, 2013. Thisreport, including the letter to shareholders and related disclosures, contains certaininformation about the fund’s investment results. The board and the committee reviewedthe fund’s investment results measured against various indexes, including the LipperInternational <strong>Fund</strong>s Index, the MSCI All Country World ex-U.S. Index and the MSCIEAFE Index. They noted that the investment results of the fund compared favorably tothose of these indexes for the 20-year, 10‐year and five-year periods. The board and thecommittee concluded that the fund’s investment results have been satisfactory and thatCRMC’s record in managing the fund indicated that its continued management shouldbenefit the fund and its shareholders.3. Advisory fees and total expensesThe board and the committee compared the advisory fees and total expense levels ofthe fund to those of other relevant funds. They observed that the fund’s advisory feesand expenses generally compared favorably to those of other similar funds includedin the Lipper International <strong>Fund</strong>s Index category. The board and the committee alsoconsidered the breakpoint discounts in the fund’s advisory fee structure that reducethe level of fees charged by CRMC to the fund as fund assets increase. In addition, theyreviewed information regarding the effective advisory fees charged to non-mutual fundclients by CRMC and its affiliates. They noted that, to the extent there were differencesbetween the advisory fees paid by the fund and the advisory fees paid by those clients,the differences appropriately reflected the investment, operational and regulatorydifferences between advising the fund and the other clients. The board and thecommittee concluded that the fund’s cost structure was fair and reasonable in relationto the services provided, and that the fund’s shareholders receive reasonable value inreturn for the advisory fees and other amounts paid to CRMC by the fund.36 <strong>EuroPacific</strong> <strong>Growth</strong> <strong>Fund</strong>
4. Ancillary benefitsThe board and the committee considered a variety of other benefits that CRMC and itsaffiliates receive as a result of CRMC’s relationship with the fund and the other <strong>American</strong><strong>Fund</strong>s, including fees for administrative services provided to certain share classes; feespaid to CRMC’s affiliated transfer agent; sales charges and distribution fees receivedand retained by the fund’s principal underwriter, an affiliate of CRMC; and possibleancillary benefits to CRMC and its institutional management affiliates in managingother investment vehicles. The board and the committee reviewed CRMC’s portfoliotrading practices, noting that while CRMC receives the benefit of research provided bybroker-dealers executing portfolio transactions on behalf of the fund, it does not obtainthird-party research or other services in return for allocating brokerage to such brokerdealers.The board and the committee took these ancillary benefits into account inevaluating the reasonableness of the advisory fees and other amounts paid to CRMC bythe fund.5. Adviser financial informationThe board and the committee reviewed information regarding CRMC’s costs ofproviding services to the <strong>American</strong> <strong>Fund</strong>s, including personnel, systems and resourcesof investment, compliance, trading, accounting and other administrative operations.They considered CRMC’s costs and willingness to invest in technology, infrastructureand staff to maintain and expand services and capabilities, respond to industry andregulatory developments, and attract and retain qualified personnel. They notedinformation regarding the compensation structure for CRMC’s investment professionals.The board and the committee also compared CRMC’s profitability and compensationdata to the reported results and data of several large, publicly held investmentmanagement companies. The board and the committee noted the competitiveness andcyclicality of both the mutual fund industry and the capital markets, and the importancein that environment of CRMC’s long-term profitability for maintaining its independence,company culture and management continuity. They further considered the breakpointdiscounts in the fund’s advisory fee structure. The board and the committee concludedthat the fund’s advisory fee structure reflected a reasonable sharing of benefits betweenCRMC and the fund’s shareholders.<strong>EuroPacific</strong> <strong>Growth</strong> <strong>Fund</strong> 37
Board of trustees and other officers“Independent” trustees 1Year firstNumber ofelectedportfolios in funda trustee complex overseen Other directorships 3Name and age of the fund 2 Principal occupation(s) during past five years by trustee held by trusteeElisabeth Allison, 67 1991 Director, The Stanton Foundation; former Senior 3 NoneBusiness Advisor, Harvard Medical SchoolVanessa C.L. Chang, 61 2005 Director, EL & EL Investments (real estate) 7 Edison International;Transocean Ltd.Nicholas Donatiello, Jr., 53 2008 President and CEO, Odyssey Ventures, Inc. (business 3 Dolby Laboratories, Inc.strategy and marketing consulting); Lecturer, GraduateSchool of Business, Stanford UniversityPablo R. González Guajardo, 46 2014 CEO, Kimberly-Clark de México, S.A.B. de C.V. 3 Kimberly-Clark de México,S.A.B. de C.V.;América Móvil,S.A.B. de C.V.;Grupo Sanborns,S.A.B. de C.V.;Grupo Lala, S.A.B. de C.V.Koichi Itoh, 73 1994 Chairman of the Board, Itoh Building Co., Ltd. 6 NoneChairman of the Board(building management)(Independent and Non-Executive)William H. Kling, 72 1987 President Emeritus and former CEO, <strong>American</strong> 10 NonePublic MediaWilliam I. Miller, 58 1992 President, The Wallace Foundation; Chairman of the 3 Cummins, Inc.Board, Irwin Management Company; former Chairmanof the Board and CEO, Irwin Financial CorporationAlessandro Ovi, 70 2002 Publisher and Editor, Technology Review; President, 3 Guala Closures SpA;TechRev.srl; former Special Advisor to the Italian PrimeLandi Renzo SpA;Minister (2005–2008); former Special Advisor to theST Microelectronics SNVPresident of the European Commission (2001–2005)“Interested” trustees 4,5Year firstelectedNumber ofa trustee Principal occupation(s) during past five years portfolios in fundName, age and or officer and positions held with affiliated entities or complex overseen Other directorships 3position with fund of the fund 2 the principal underwriter of the fund by trustee held by trusteeMichael J. Thawley, 64 2008 Senior Vice President, Capital Research and Management 5 NoneVice Chairman of the BoardCompany; Senior Vice President and International Advisor,Capital Strategy Research, Inc. 6Carl M. Kawaja, 49 2003 Senior Vice President — Capital World Investors, Capital 1 NonePresidentResearch and Management Company; Chairman of theBoard, Capital International Asset Management (Canada),Inc.; 6 Director, The Capital Group Companies, Inc. 6The fund’s statement of additional information includes further details about fund trustees and is available without charge upon request by calling<strong>American</strong> <strong>Fund</strong>s Service Company at (800) 421-4225 or by visiting the <strong>American</strong> <strong>Fund</strong>s website at americanfunds.com. The address for all trusteesand officers of the fund is 333 South Hope Street, Los Angeles, CA 90071, Attention: Secretary.38 <strong>EuroPacific</strong> <strong>Growth</strong> <strong>Fund</strong>
Other officers 5Year firstelectedName, age and an officer Principal occupation(s) during past five years and positions held with affiliated entitiesposition with fund of the fund 2 or the principal underwriter of the fundMark E. Denning, 56 1994 Director, Capital Research and Management Company; Senior Vice President — Capital ResearchExecutive Vice President Global Investors, Capital Research Company 6Jonathan Knowles, Ph.D., 53 2012 Director, Capital Research and Management Company; Senior Vice President — Capital World Investors,Senior Vice President Capital Research Company 6Sung Lee, 47 2003 Senior Vice President — Capital Research Global Investors, Capital Research Company 6Senior Vice PresidentRobert W. Lovelace, 51 1996 President and Director, Capital Research and Management Company;Senior Vice PresidentSenior Vice President — Capital International Investors, Capital Research and Management Company;Director, The Capital Group Companies, Inc. 6Walter R. Burkley, 47 2012 Senior Vice President and Senior Counsel — <strong>Fund</strong> Business Management Group, Capital Research andVice President Management Company; Director, Capital Research Company 6Michael J. Downer, 59 2004 Director, Senior Vice President, Secretary and Chief Legal Officer, Capital Research and ManagementVice PresidentCompany; Director, <strong>American</strong> <strong>Fund</strong>s Distributors, Inc.; 6 Chairman of the Board, Capital Bank andTrust Company 6Nicholas J. Grace, 48 2004 Senior Vice President — Capital World Investors, Capital Research Company 6Vice PresidentJesper Lyckeus, 46 2010 Senior Vice President — Capital Research Global Investors, Capital Research Company 6Vice PresidentJoerg Sponer, 42 2010 Senior Vice President — Capital Research Global Investors, Capital Research Company 6Vice PresidentMichael W. Stockton, 47 2013 Vice President — <strong>Fund</strong> Business Management Group, Capital Research and Management CompanySecretaryBrian C. Janssen, 42 2010 Vice President — <strong>Fund</strong> Business Management Group, Capital Research and Management CompanyTreasurerJennifer L. Butler, 48 2013 Assistant Vice President — <strong>Fund</strong> Business Management Group, Capital Research and ManagementAssistant SecretaryCompanyDori Laskin, 62 2010 Vice President — <strong>Fund</strong> Business Management Group, Capital Research and Management CompanyAssistant TreasurerAri M. Vinocor, 39 2011 Vice President — <strong>Fund</strong> Business Management Group, Capital Research and Management CompanyAssistant Treasurer1The term “independent” trustee refers to a trustee who is not an “interested person” of the fund within the meaning of the Investment Company Act of 1940.2Trustees and officers of the fund serve until their resignation, removal or retirement.3This includes all directorships (other than those in the <strong>American</strong> <strong>Fund</strong>s or other funds managed by Capital Research and Management Company or itsaffiliates) that are held by each trustee as a trustee or director of a public company or a registered investment company.4The term “interested” trustee refers to a trustee who is an “interested person” within the meaning of the Investment Company Act of 1940, on the basisof their affiliation with the fund’s investment adviser, Capital Research and Management Company, or affiliated entities (including the fund’s principalunderwriter).5All of the officers listed are officers and/or directors/trustees of one or more of the other funds for which Capital Research and Management Companyserves as investment adviser.6Company affiliated with Capital Research and Management Company.<strong>EuroPacific</strong> <strong>Growth</strong> <strong>Fund</strong> 39
Offices of the fund and of theinvestment adviserCapital Research and Management Company333 South Hope StreetLos Angeles, CA 90071-14066455 Irvine Center DriveIrvine, CA 92618-4518Transfer agent for shareholder accounts<strong>American</strong> <strong>Fund</strong>s Service Company(Write to the address near you.)P.O. Box 6007Indianapolis, IN 46206-6007P.O. Box 2280Norfolk, VA 23501-2280Custodian of assetsJPMorgan Chase Bank270 Park AvenueNew York, NY 10017-2070CounselK&L Gates LLPFour Embarcadero Center, Suite 1200San Francisco, CA 94111-5994Independent registered publicaccounting firmDeloitte & Touche LLP695 Town Center DriveSuite 1200Costa Mesa, CA 92626-7188Principal underwriter<strong>American</strong> <strong>Fund</strong>s Distributors, Inc.333 South Hope StreetLos Angeles, CA 90071-1406Investors should carefully consider investment objectives, risks, chargesand expenses. This and other important information is contained in the fundprospectus and summary prospectus, which can be obtained from your financialprofessional and should be read carefully before investing. You may also call<strong>American</strong> <strong>Fund</strong>s Service Company (AFS) at (800) 421-4225 or visit the <strong>American</strong><strong>Fund</strong>s website at americanfunds.com.“<strong>American</strong> <strong>Fund</strong>s Proxy Voting Procedures and Principles” — which describes howwe vote proxies relating to portfolio securities — is available on the <strong>American</strong> <strong>Fund</strong>swebsite or upon request by calling AFS. The fund files its proxy voting record with theU.S. Securities and Exchange Commission (SEC) for the 12 months ended June 30 byAugust 31. The proxy voting record is available free of charge on the SEC website atsec.gov and on the <strong>American</strong> <strong>Fund</strong>s website.A complete March 31, 2014, portfolio of <strong>EuroPacific</strong> <strong>Growth</strong> <strong>Fund</strong>’s investments isavailable free of charge by calling AFS or visiting the SEC website (where it is part ofForm N-CSR).<strong>EuroPacific</strong> <strong>Growth</strong> <strong>Fund</strong> files a complete list of its portfolio holdings with the SEC forthe first and third quarters of each fiscal year on Form N-Q. This filing is available freeof charge on the SEC website. You may also review or, for a fee, copy this filing at theSEC’s Public Reference Room in Washington, D.C. Additional information regarding theoperation of the Public Reference Room may be obtained by calling the SEC’s Office ofInvestor Education and Advocacy at (800) SEC-0330. Additionally, the list of portfolioholdings is available by calling AFS.This report is for the information of shareholders of <strong>EuroPacific</strong> <strong>Growth</strong> <strong>Fund</strong>, but italso may be used as sales literature when preceded or accompanied by the currentprospectus or summary prospectus, which gives details about charges, expenses,investment objectives and operating policies of the fund. If used as sales material afterJune 30, 2014, this report must be accompanied by an <strong>American</strong> <strong>Fund</strong>s statisticalupdate for the most recently completed calendar quarter.40 <strong>EuroPacific</strong> <strong>Growth</strong> <strong>Fund</strong>
The <strong>American</strong> <strong>Fund</strong>s AdvantageSince 1931, <strong>American</strong> <strong>Fund</strong>s, part of Capital Group, has helpedinvestors pursue long-term investment success. Our consistentapproach — in combination with The Capital System SM — hasresulted in a superior long-term track record.Aligned withinvestor successWe base our decisions ona long-term perspective,which we believe alignsour goals with theinterests of our clients.Our portfolio managersaverage 26 years ofinvestment experience,including 21 years at ourcompany, reflecting acareer commitment to ourlong-term approach. 1The CapitalSystem SMOur investment process,The Capital System,combines individualaccountability withteam work. Each fund isdivided into portions thatare managed independentlyby investmentprofessionals with diversebackgrounds, ages andinvestment approaches.An extensive globalresearch effort is thebackbone of our system.Superior long-termtrack recordOur equity funds havebeaten their Lipper peerindexes in 90% of 10-yearperiods and 96% of20-year periods. Ourfixed-income funds havebeaten their Lipperindexes in 56% of 10-yearperiods and 57% of20-year periods. 2 Ourfund management feeshave been among thelowest in the industry. 31Portfolio manager experience as of December 31, 2013.2Based on Class A share results for rolling periods through December 31, 2013. Periods coveredare the shorter of the fund’s lifetime or since the comparable Lipper index inception date(except SMALLCAP World <strong>Fund</strong>, for which the Lipper average was used).3Based on management fees for the 20-year period ended December 31, 2013, versuscomparable Lipper categories, excluding funds of funds.Printed on paper containing 10% post-consumer waste Printed with inks containing soy and/or vegetable oilLit. No. MFGEARX-016-0514P Litho in USA AGD/Q/8055-S37049