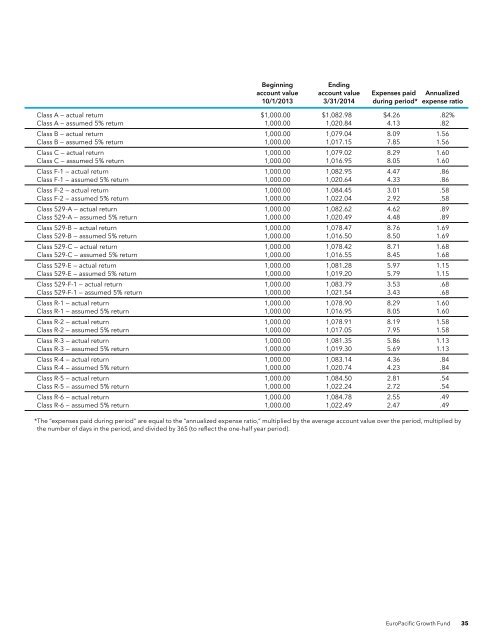
Expense exampleunauditedAs a fund shareholder, you incur twotypes of costs: (1) transaction costs,such as initial sales charges on purchasepayments and contingent deferred salescharges on redemptions (loads), and (2)ongoing costs, including managementfees, distribution and service (12b-1)fees, and other expenses. This exampleis intended to help you understand yourongoing costs (in dollars) of investing inthe fund so you can compare these costswith the ongoing costs of investing inother mutual funds. The example is basedon an investment of $1,000 invested at thebeginning of the period and held for theentire six-month period (October 1, 2013,through March 31, 2014).Actual expenses:The first line of each share class in the table on the following page provides informationabout actual account values and actual expenses. You may use the information in thisline, together with the amount you invested, to estimate the expenses that you paid overthe period. Simply divide your account value by $1,000 (for example, an $8,600 accountvalue divided by $1,000 = 8.6), then multiply the result by the number in the first lineunder the heading entitled “Expenses paid during period” to estimate the expenses youpaid on your account during this period.Hypothetical example for comparison purposes:The second line of each share class in the table on the following page providesinformation about hypothetical account values and hypothetical expenses based onthe actual expense ratio for the share class and an assumed rate of return of 5.00% peryear before expenses, which is not the actual return of the share class. The hypotheticalaccount values and expenses may not be used to estimate the actual ending accountbalance or expenses you paid for the period. You may use this information to comparethe ongoing costs of investing in the fund and other funds. To do so, compare this5.00% hypothetical example with the 5.00% hypothetical examples that appear in theshareholder reports of the other funds.Notes:There are some account fees that are charged to certain types of accounts, such asindividual retirement accounts and 529 college savings plan accounts (generally, a $10fee is charged to set up the account and an additional $10 fee is charged to the accountannually), that would increase the amount of expenses paid on your account. In addition,retirement plan participants may be subject to certain fees charged by the plan sponsor,and Class F-1, F-2 and 529-F-1 shareholders may be subject to fees charged by financialintermediaries, typically ranging from 0.75% to 1.50% of assets annually depending onservices offered. You can estimate the impact of these fees by adding the amount ofthe fees to the total estimated expenses you paid on your account during the period ascalculated above. In addition, your ending account value would be lower by the amountof these fees.Note that the expenses shown in the table on the following page are meant to highlightyour ongoing costs only and do not reflect any transactional costs, such as sales charges(loads). Therefore, the second line of each share class in the table is useful in comparingongoing costs only and will not help you determine the relative total costs of owningdifferent funds. In addition, if these transactional costs were included, your costs wouldhave been higher.34 <strong>EuroPacific</strong> <strong>Growth</strong> <strong>Fund</strong>
BeginningEndingaccount value account value Expenses paid <strong>Annual</strong>ized10/1/2013 3/31/2014 during period* expense ratioClass A — actual return $1,000.00 $1,082.98 $4.26 .82%Class A — assumed 5% return 1,000.00 1,020.84 4.13 .82Class B — actual return 1,000.00 1,079.04 8.09 1.56Class B — assumed 5% return 1,000.00 1,017.15 7.85 1.56Class C — actual return 1,000.00 1,079.02 8.29 1.60Class C — assumed 5% return 1,000.00 1,016.95 8.05 1.60Class F-1 — actual return 1,000.00 1,082.95 4.47 .86Class F-1 — assumed 5% return 1,000.00 1,020.64 4.33 .86Class F-2 — actual return 1,000.00 1,084.45 3.01 .58Class F-2 — assumed 5% return 1,000.00 1,022.04 2.92 .58Class 529-A — actual return 1,000.00 1,082.62 4.62 .89Class 529-A — assumed 5% return 1,000.00 1,020.49 4.48 .89Class 529-B — actual return 1,000.00 1,078.47 8.76 1.69Class 529-B — assumed 5% return 1,000.00 1,016.50 8.50 1.69Class 529-C — actual return 1,000.00 1,078.42 8.71 1.68Class 529-C — assumed 5% return 1,000.00 1,016.55 8.45 1.68Class 529-E — actual return 1,000.00 1,081.28 5.97 1.15Class 529-E — assumed 5% return 1,000.00 1,019.20 5.79 1.15Class 529-F-1 — actual return 1,000.00 1,083.79 3.53 .68Class 529-F-1 — assumed 5% return 1,000.00 1,021.54 3.43 .68Class R-1 — actual return 1,000.00 1,078.90 8.29 1.60Class R-1 — assumed 5% return 1,000.00 1,016.95 8.05 1.60Class R-2 — actual return 1,000.00 1,078.91 8.19 1.58Class R-2 — assumed 5% return 1,000.00 1,017.05 7.95 1.58Class R-3 — actual return 1,000.00 1,081.35 5.86 1.13Class R-3 — assumed 5% return 1,000.00 1,019.30 5.69 1.13Class R-4 — actual return 1,000.00 1,083.14 4.36 .84Class R-4 — assumed 5% return 1,000.00 1,020.74 4.23 .84Class R-5 — actual return 1,000.00 1,084.50 2.81 .54Class R-5 — assumed 5% return 1,000.00 1,022.24 2.72 .54Class R-6 — actual return 1,000.00 1,084.78 2.55 .49Class R-6 — assumed 5% return 1,000.00 1,022.49 2.47 .49*The “expenses paid during period” are equal to the “annualized expense ratio,” multiplied by the average account value over the period, multiplied bythe number of days in the period, and divided by 365 (to reflect the one-half year period).<strong>EuroPacific</strong> <strong>Growth</strong> <strong>Fund</strong> 35