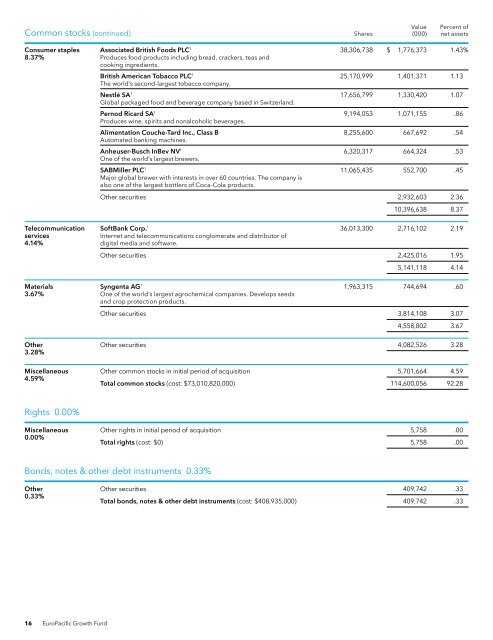
Common stocks (continued)Value Percent ofShares (000) net assetsConsumer staples Associated British Foods PLC 1 38,306,738 $ 1,776,373 1.43%8.37% Produces food products including bread, crackers, teas andcooking ingredients.British <strong>American</strong> Tobacco PLC 1 25,170,999 1,401,371 1.13The world’s second-largest tobacco company.Nestlé SA 1 17,656,799 1,330,420 1.07Global packaged food and beverage company based in Switzerland.Pernod Ricard SA 1 9,194,053 1,071,155 .86Produces wine, spirits and nonalcoholic beverages.Alimentation Couche-Tard Inc., Class B 8,255,600 667,692 .54Automated banking machines.Anheuser-Busch InBev NV 1 6,320,317 664,324 .53One of the world’s largest brewers.SABMiller PLC 1 11,065,435 552,700 .45Major global brewer with interests in over 60 countries. The company isalso one of the largest bottlers of Coca-Cola products.Other securities 2,932,603 2.3610,396,638 8.37Telecommunication SoftBank Corp. 1 36,013,300 2,716,102 2.19servicesInternet and telecommunications conglomerate and distributor of4.14% digital media and software.Other securities 2,425,016 1.955,141,118 4.14Materials Syngenta AG 1 1,963,315 744,694 .603.67% One of the world’s largest agrochemical companies. Develops seedsand crop protection products.Other securities 3,814,108 3.074,558,802 3.67Other Other securities 4,082,526 3.283.28%Miscellaneous Other common stocks in initial period of acquisition 5,701,664 4.594.59%Total common stocks (cost: $73,010,820,000) 114,600,056 92.28Rights 0.00%Miscellaneous Other rights in initial period of acquisition 5,758 .000.00%Total rights (cost: $0) 5,758 .00Bonds, notes & other debt instruments 0.33%Other Other securities 409,742 .330.33%Total bonds, notes & other debt instruments (cost: $408,935,000) 409,742 .3316 <strong>EuroPacific</strong> <strong>Growth</strong> <strong>Fund</strong>
Short-term securities 7.27%Principal amount Value Percent of(000) (000) net assetsFederal Home Loan Bank 0.06%–0.175% due 4/2–10/20/2014 $2,519,585 $ 2,519,155 2.03%Freddie Mac 0.095%–0.17% due 4/1/2014–2/9/2015 2,287,500 2,286,307 1.84Fannie Mae 0.11%–0.15% due 4/1–10/27/2014 914,600 914,409 .73Other securities 3,310,895 2.67Total short-term securities (cost: $9,030,089,000) 9,030,766 7.27Total investment securities (cost: $82,449,844,000) 124,046,322 99.88Other assets less liabilities 142,512 .12Net assets $124,188,834 100.00%This summary investment portfolio is designed to streamline the report and help investors better focus on the fund’s principal holdings. See page 40 fordetails on how to obtain a complete schedule of portfolio holdings.The descriptions of the companies shown in the summary investment portfolio, which were obtained from published reports and other sources believed tobe reliable, are supplemental and are not covered by the <strong>Report</strong> of Independent Registered Public Accounting Firm.As permitted by U.S. Securities and Exchange Commission regulations, “Miscellaneous” securities include holdings in their first year of acquisition that havenot previously been publicly disclosed.“Other securities” includes all issues that are not disclosed separately in the summary investment portfolio. Some of these securities (with an aggregate valueof $2,180,735,000, which represented 1.76% of the net assets of the fund) were acquired in transactions exempt from registration under Rule 144A or section4(2) of the Securities Act of 1933 and may be resold in the U.S. in transactions exempt from registration, normally to qualified institutional buyers. “Othersecurities” also includes a portion of a security which was pledged as collateral. The total value of pledged collateral was $1,758,000, which represented lessthan .01% of the net assets of the fund.Forward currency contractsThe fund has entered into forward currency contracts to sell currencies as shown in the following table. The average notional amountof open forward currency contracts was $2,930,846,000 over the prior 12-month period.Unrealized(depreciation)Contract amountappreciationSettlement Receive Deliver at 3/31/2014date Counterparty (000) (000) (000)Sales:Australian dollars 4/4/2014 UBS AG $35,099 A$39,300 $ (1,338)Euros 4/9/2014 HSBC Bank $145,000 €106,365 (1,530)Euros 4/14/2014 Bank of America, N.A. $221,808 €160,000 1,391Euros 4/14/2014 JPMorgan Chase $317,155 €228,819 1,932Euros 4/15/2014 UBS AG $41,014 €29,560 292Euros 4/24/2014 HSBC Bank $68,926 €50,000 48Euros 4/28/2014 Citibank $77,187 €55,900 181Euros 4/30/2014 Barclays Bank PLC $100,575 €73,183 (239)Euros 4/30/2014 JPMorgan Chase $89,336 €65,000 (205)Japanese yen 4/7/2014 Bank of New York Mellon $68,272 ¥6,975,000 692Japanese yen 4/9/2014 JPMorgan Chase $70,000 ¥7,306,950 (797)Japanese yen 4/14/2014 Barclays Bank PLC $42,323 ¥4,370,000 (19)Japanese yen 4/17/2014 Barclays Bank PLC $321,760 ¥33,042,500 1,597Japanese yen 4/24/2014 Bank of America, N.A. $63,754 ¥6,545,000 334Japanese yen 4/28/2014 Barclays Bank PLC $410,463 ¥41,957,500 3,894Japanese yen 4/28/2014 HSBC Bank $570,085 ¥58,258,446 5,561Japanese yen 4/28/2014 HSBC Bank $42,423 ¥4,300,000 756Japanese yen 5/2/2014 Bank of America, N.A. $159,133 ¥16,300,000 1,183Swiss francs 4/28/2014 Citibank $147,382 CHF130,280 (18)$13,715<strong>EuroPacific</strong> <strong>Growth</strong> <strong>Fund</strong> 17