Reichert Ocular Response Analyzer Measures Corneal ... - innova
Reichert Ocular Response Analyzer Measures Corneal ... - innova
Reichert Ocular Response Analyzer Measures Corneal ... - innova
- No tags were found...

You also want an ePaper? Increase the reach of your titles
YUMPU automatically turns print PDFs into web optimized ePapers that Google loves.
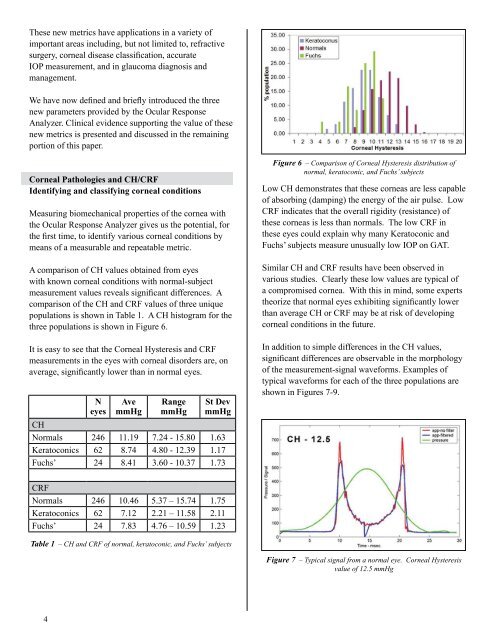
These new metrics have applications in a variety ofimportant areas including, but not limited to, refractivesurgery, corneal disease classification, accurateIOP measurement, and in glaucoma diagnosis andmanagement.We have now defined and briefly introduced the threenew parameters provided by the <strong>Ocular</strong> <strong>Response</strong><strong>Analyzer</strong>. Clinical evidence supporting the value of thesenew metrics is presented and discussed in the remainingportion of this paper.<strong>Corneal</strong> Pathologies and CH/CRFIdentifying and classifying corneal conditionsMeasuring biomechanical properties of the cornea withthe <strong>Ocular</strong> <strong>Response</strong> <strong>Analyzer</strong> gives us the potential, forthe first time, to identify various corneal conditions bymeans of a measurable and repeatable metric.A comparison of CH values obtained from eyeswith known corneal conditions with normal-subjectmeasurement values reveals significant differences. Acomparison of the CH and CRF values of three uniquepopulations is shown in Table 1. A CH histogram for thethree populations is shown in Figure 6.It is easy to see that the <strong>Corneal</strong> Hysteresis and CRFmeasurements in the eyes with corneal disorders are, onaverage, significantly lower than in normal eyes.NeyesAvemmHgRangemmHgSt DevmmHgCHNormals 246 11.19 7.24 - 15.80 1.63Keratoconics 62 8.74 4.80 - 12.39 1.17Fuchs’ 24 8.41 3.60 - 10.37 1.73Figure 6 – Comparison of <strong>Corneal</strong> Hysteresis distribution ofnormal, keratoconic, and Fuchs’ subjectsLow CH demonstrates that these corneas are less capableof absorbing (damping) the energy of the air pulse. LowCRF indicates that the overall rigidity (resistance) ofthese corneas is less than normals. The low CRF inthese eyes could explain why many Keratoconic andFuchs’ subjects measure unusually low IOP on GAT.Similar CH and CRF results have been observed invarious studies. Clearly these low values are typical ofa compromised cornea. With this in mind, some expertstheorize that normal eyes exhibiting significantly lowerthan average CH or CRF may be at risk of developingcorneal conditions in the future.In addition to simple differences in the CH values,significant differences are observable in the morphologyof the measurement-signal waveforms. Examples oftypical waveforms for each of the three populations areshown in Figures 7-9.CRFNormals 246 10.46 5.37 – 15.74 1.75Keratoconics 62 7.12 2.21 – 11.58 2.11Fuchs’ 24 7.83 4.76 – 10.59 1.23Table 1 – CH and CRF of normal, keratoconic, and Fuchs’ subjectsFigure 7 – Typical signal from a normal eye. <strong>Corneal</strong> Hysteresisvalue of 12.5 mmHg

![OCT Setting: CORNEA RADIAL 6( 6.0mm[1024] ) - innova](https://img.yumpu.com/48127738/1/190x146/oct-setting-cornea-radial-6-60mm1024-innova.jpg?quality=85)