Software Development based on LabVIEW for DC
Software Development based on LabVIEW for DC
Software Development based on LabVIEW for DC

You also want an ePaper? Increase the reach of your titles
YUMPU automatically turns print PDFs into web optimized ePapers that Google loves.
Annual Report 2005 - Solid-State Electr<strong>on</strong>ics Department 59<br />
4.3.6 <str<strong>on</strong>g>Software</str<strong>on</strong>g> development of a LABView programme <strong>for</strong> the <strong>DC</strong> and<br />
RF characterisati<strong>on</strong> of Heterojuncti<strong>on</strong> Bipolar Transistors<br />
Student: Ingo Nannen<br />
Scientist: Jörn Driesen, Silja Ehrich<br />
Introducti<strong>on</strong><br />
The rising complexity of Integrated Circuits demands an accurate <strong>DC</strong> and RF characterisati<strong>on</strong>. The<br />
development and advancement of reliable and multifuncti<strong>on</strong>al software is there<strong>for</strong>e of high<br />
importance.<br />
Two different porgramms have been used by the research team of HLT as a standard in the past.<br />
The instant use of BASIC software <strong>for</strong> the <strong>DC</strong> measurements and Agilent Vee <strong>for</strong> RFparametrisati<strong>on</strong><br />
was rather uncom<strong>for</strong>table. One of the disadvantages of this system was the<br />
incompatibility of both software data types.<br />
Based <strong>on</strong> the main features of both characterisati<strong>on</strong> programms, the new LABView <str<strong>on</strong>g>Software</str<strong>on</strong>g> has<br />
been developed in order to determine both <strong>DC</strong> and RF parameters of the DUT simultaneously.<br />
Direct current and <strong>DC</strong>-Voltage supply is provided by SMU HP4142B. RF analysis is established by<br />
Analyzer HP8510C. Both devices interact via the GPIB-buss with the computer. The adjustment<br />
setting and c<strong>on</strong>trol of the parameters is managed by diverse servo loops and subroutines<br />
implemented in the labview software.<br />
The following <strong>DC</strong> characteristic curves can be determined by the implemented measurement<br />
software.<br />
output characteristics<br />
transfer characteristic<br />
input characteristic<br />
diode characteristic<br />
gummel-plots (<strong>for</strong>ward and reverse)<br />
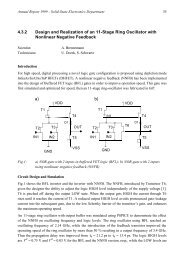
Figure 1 shows the c<strong>on</strong>trol panel <strong>for</strong> the <strong>DC</strong> analysis. The measured data is displayed by indicator<br />
3. Were it is important the programme switches automatically between cartesian and logarithmic<br />
coordinates if necessary. The active values <strong>for</strong> the different voltages and currents during the<br />
measurement are displayed by indicator 5. Indicator 4 shows the progress of the measurement.<br />
The input lead resistance can be determined in order to improve the accuracy of the measurement.<br />
The voltage drop <strong>on</strong> the lead is c<strong>on</strong>sidered by the calibrati<strong>on</strong> of the <strong>DC</strong> power supply by the<br />
software.<br />
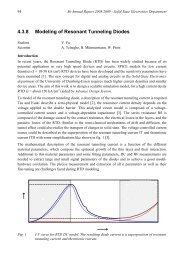
The user should change the Mainpanel <strong>for</strong> RF – measurement to do a RF characterizati<strong>on</strong> of a<br />
transistor. The Mainpanel is shown in figure 2. The programme includes different ways to adjust an<br />
operating point as shown in indicator 12. The possibilities adjustments are:
60 Annual Report 2005 - Solid-State Electr<strong>on</strong>ics Department<br />
base current and collector – emitter voltage<br />
base –emitter voltage and the collector – emitter voltage<br />
collector current and collector – emitter voltage<br />
collector current and base – collector voltage<br />
base current and base – collector voltage<br />
Servo loops were created <strong>for</strong> the four last menti<strong>on</strong>ed adjustments.<br />
The programme is able to present the results of the measurement within a Smith – Chart, amplitude<br />
– frequency – chart and phase – frequency – chart.<br />
Data can be stored in different file <strong>for</strong>mats. Citifile <strong>for</strong>mat and HLT <strong>for</strong>mat used by the BASIC –<br />
programm <strong>for</strong> <strong>DC</strong> measurement are available as well as Touchst<strong>on</strong>e <strong>for</strong>mat <strong>for</strong> data acquired by<br />
RF – measurement.<br />
References:<br />
[1] Handbook HP 8510C Vector Analyzer<br />
[2] Handbook HP 4142B Parameter Analyzer<br />
[3] F.J. Tegude<br />
„Technische Elektr<strong>on</strong>ik 1,2“<br />
Script of the lecture, 2003<br />
[4] F.J. Tegude<br />
„Technische Elektr<strong>on</strong>ik 1,2“<br />
script of the lab, 2003<br />
[5] „<strong>LabVIEW</strong>7 Express“<br />
Nati<strong>on</strong>al Instruments, 2003<br />
[6] HP VEE Advanced Programming Techniques<br />
Hewlett Packard, 1997
Annual Report 2005 - Solid-State Electr<strong>on</strong>ics Department 61<br />
Figure 1. Mainpanel <strong>for</strong> <strong>DC</strong> – measurement
62 Annual Report 2005 - Solid-State Electr<strong>on</strong>ics Department<br />
Figure 2. Mainpanel <strong>for</strong> HF – measurement