Cell Cycle Tutorial Contents
Cell Cycle Tutorial Contents
Cell Cycle Tutorial Contents

You also want an ePaper? Increase the reach of your titles
YUMPU automatically turns print PDFs into web optimized ePapers that Google loves.
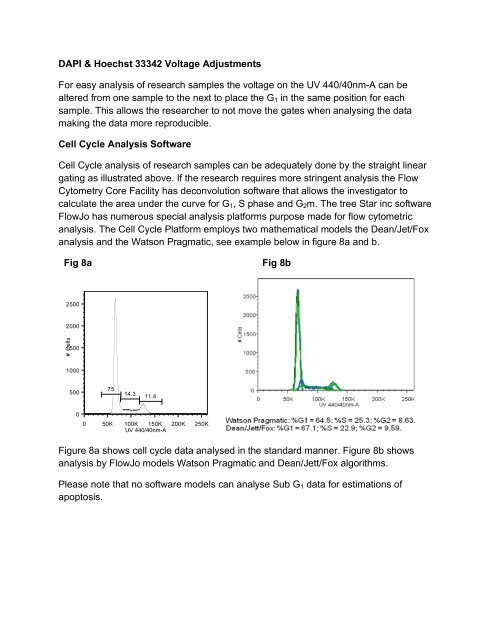
DAPI & Hoechst 33342 Voltage AdjustmentsFor easy analysis of research samples the voltage on the UV 440/40nm-A can bealtered from one sample to the next to place the G 1 in the same position for eachsample. This allows the researcher to not move the gates when analysing the datamaking the data more reproducible.<strong>Cell</strong> <strong>Cycle</strong> Analysis Software<strong>Cell</strong> <strong>Cycle</strong> analysis of research samples can be adequately done by the straight lineargating as illustrated above. If the research requires more stringent analysis the FlowCytometry Core Facility has deconvolution software that allows the investigator tocalculate the area under the curve for G 1 , S phase and G 2 m. The tree Star inc softwareFlowJo has numerous special analysis platforms purpose made for flow cytometricanalysis. The <strong>Cell</strong> <strong>Cycle</strong> Platform employs two mathematical models the Dean/Jet/Foxanalysis and the Watson Pragmatic, see example below in figure 8a and b.Fig 8aFig 8b25002000# <strong>Cell</strong>s150010005007514.311.400 50K 100K 150K 200K 250KUV 440/40nm-AFigure 8a shows cell cycle data analysed in the standard manner. Figure 8b showsanalysis by FlowJo models Watson Pragmatic and Dean/Jett/Fox algorithms.Please note that no software models can analyse Sub G 1 data for estimations ofapoptosis.