Annual Diving Report - Divers Alert Network
Annual Diving Report - Divers Alert Network
Annual Diving Report - Divers Alert Network

Create successful ePaper yourself
Turn your PDF publications into a flip-book with our unique Google optimized e-Paper software.
2. PROJECT DIVE EXPLORATION<br />
The Scapa Flow Group from Scotland (CWWD) represents cold water wreck divers. The<br />
Recreational Dive Professionals (RDP) Group represents dives collected by dive instructors and<br />
dive guides mainly in the Caribbean. Independent divers submitted dive logs directly to DAN via<br />
the internet from the dive log software (DL7 Level 3-compatible) available with Cochran and<br />
DiveRite computers and, recently, Uwatec computers.<br />
2.2 <strong>Divers</strong><br />
This section presents information about PDE divers including age, gender, certification, years<br />
since certification, and chronic and acute medical conditions. While PDE divers were volunteers<br />
from the general recreational diving population, they were not necessarily representative of this<br />
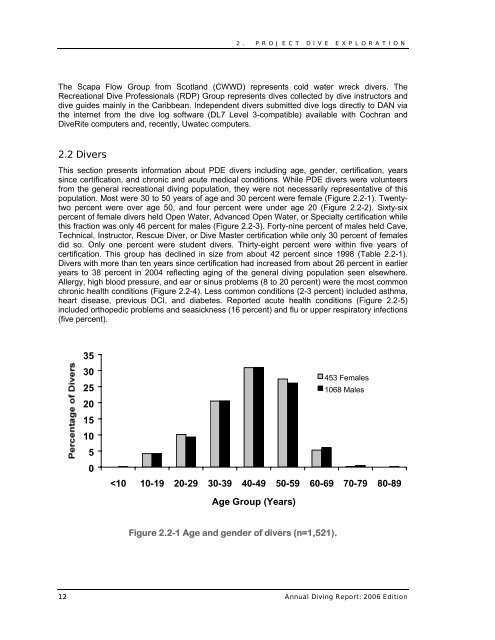
population. Most were 30 to 50 years of age and 30 percent were female (Figure 2.2-1). Twentytwo<br />
percent were over age 50, and four percent were under age 20 (Figure 2.2-2). Sixty-six<br />
percent of female divers held Open Water, Advanced Open Water, or Specialty certification while<br />
this fraction was only 46 percent for males (Figure 2.2-3). Forty-nine percent of males held Cave,<br />
Technical, Instructor, Rescue Diver, or Dive Master certification while only 30 percent of females<br />
did so. Only one percent were student divers. Thirty-eight percent were within five years of<br />
certification. This group has declined in size from about 42 percent since 1998 (Table 2.2-1).<br />
<strong>Divers</strong> with more than ten years since certification had increased from about 26 percent in earlier<br />
years to 38 percent in 2004 reflecting aging of the general diving population seen elsewhere.<br />
Allergy, high blood pressure, and ear or sinus problems (8 to 20 percent) were the most common<br />
chronic health conditions (Figure 2.2-4). Less common conditions (2-3 percent) included asthma,<br />
heart disease, previous DCI, and diabetes. <strong>Report</strong>ed acute health conditions (Figure 2.2-5)<br />
included orthopedic problems and seasickness (16 percent) and flu or upper respiratory infections<br />
(five percent).<br />
35<br />
30<br />
25<br />
20<br />
15<br />
10<br />
5<br />
0<br />