Using X-Tracks - Xplova
Using X-Tracks - Xplova
Using X-Tracks - Xplova
- No tags were found...

You also want an ePaper? Increase the reach of your titles
YUMPU automatically turns print PDFs into web optimized ePapers that Google loves.
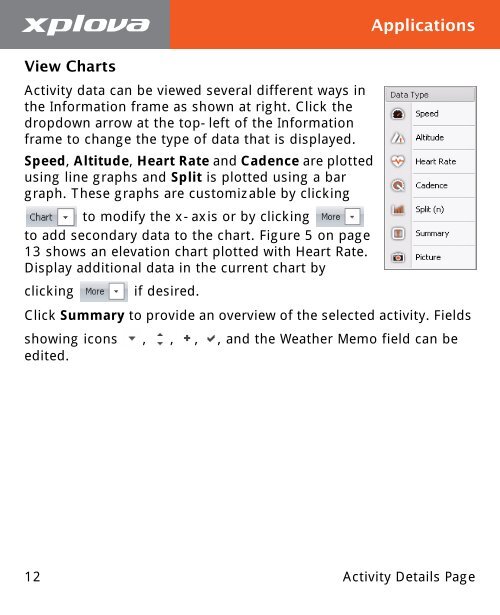
View ChartsApplicationsActivity data can be viewed several different ways inthe Information frame as shown at right. Click thedropdown arrow at the top-left of the Informationframe to change the type of data that is displayed.Speed, Altitude, Heart Rate and Cadence are plottedusing line graphs and Split is plotted using a bargraph. These graphs are customizable by clickingto modify the x-axis or by clickingto add secondary data to the chart. Figure 5 on page13 shows an elevation chart plotted with Heart Rate.Display additional data in the current chart byclicking if desired.Click Summary to provide an overview of the selected activity. Fieldsshowing icons , , , , and the Weather Memo field can beedited.12 Activity Details Page