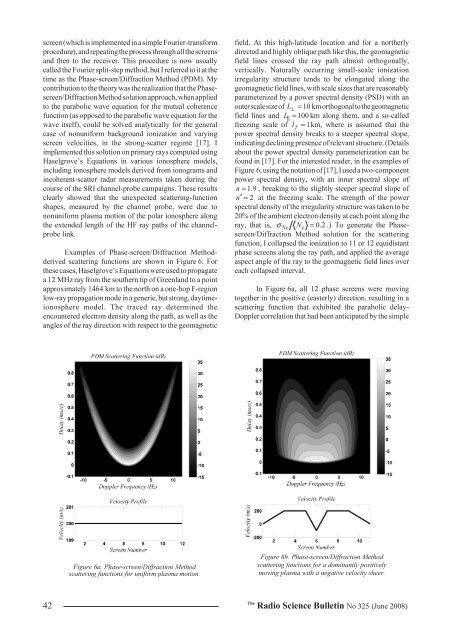
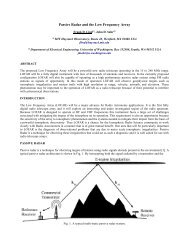
screen (which is implemented in a simple Fourier-transformprocedure), and repeating the process through all the screensand then to the receiver. This procedure is now usuallycalled the Fourier split-step method, but I referred to it at thetime as the Phase-screen/Diffraction Method (PDM). Mycontribution to the theory was the realization that the Phasescreen/DiffractionMethod solution approach, when appliedto the parabolic wave equation for the mutual coherencefunction (as opposed to the parabolic wave equation for thewave itself), could be solved analytically for the generalcase of nonuniform background ionization and varyingscreen velocities, in the strong-scatter regime [17]. Iimplemented this solution on primary rays computed usingHaselgrove’s Equations in various ionosphere models,including ionosphere models derived from ionograms andincoherent-scatter radar measurements taken during thecourse of the SRI channel-probe campaigns. These resultsclearly showed that the unexpected scattering-functionshapes, measured by the channel probe, were due tononuniform plasma motion of the polar ionosphere alongthe extended length of the HF ray paths of the channelprobelink.Examples of Phase-screen/Diffraction Methodderivedscattering functions are shown in Figure 6. Forthese cases, Haselgrove’s Equations were used to propagatea 12 MHz ray from the southern tip of Greenland to a pointapproximately 1464 km to the north on a one-hop F-regionlow-ray propagation mode in a generic, but strong, daytimeionospheremodel. The traced ray determined theencountered electron density along the path, as well as theangles of the ray direction with respect to the geomagneticfield. At this high-latitude location and for a northerlydirected and highly oblique path like this, the geomagneticfield lines crossed the ray path almost orthogonally,vertically. Naturally occurring small-scale ionizationirregularity structure tends to be elongated along thegeomagnetic field lines, with scale sizes that are reasonablyparameterized by a power spectral density (PSD) with anouter scale size of L ⊥ = 10 km orthogonal to the geomagneticfield lines and L || = 100 km along them, and a so-calledfreezing scale of l f = 1km, where is assumed that thepower spectral density breaks to a steeper spectral slope,indicating declining presence of relevant structure. (Detailsabout the power spectral density parameterization can befound in [17]. For the interested reader, in the examples ofFigure 6, using the notation of [17], I used a two-componentpower spectral density, with an inner spectral slope ofn = 1.9 , breaking to the slightly steeper spectral slope ofn′ = 2 at the freezing scale. The strength of the powerspectral density of the irregularity structure was taken to be20% of the ambient electron density at each point along theray, that is, σ Ne Ne= 0.2 .) To generate the Phasescreen/DiffractionMethod solution for the scatteringfunction, I collapsed the ionization to 11 or 12 equidistantphase screens along the ray path, and applied the averageaspect angle of the ray to the geomagnetic field lines overeach collapsed interval.In Figure 6a, all 12 phase screens were movingtogether in the positive (easterly) direction, resulting in ascattering function that exhibited the parabolic delay-Doppler correlation that had been anticipated by the simpleFigure 6a. Phase-screen/Diffraction Methodscattering functions for uniform plasma motion.Figure 6b. Phase-screen/Diffraction Methodscattering functions for a dominantly positivelymoving plasma with a negative velocity sheer.42The<strong>Radio</strong> <strong>Science</strong> <strong>Bulletin</strong> No <strong>325</strong> (<strong>June</strong> <strong>2008</strong>)
4. Spread Doppler ClutterOver-the-horizon radars generally operate as Dopplerradars, that is, they transmit a series of pulses or linear FM“chirps” that can be coherently integrated and Dopplerprocessed to separate moving targets from the inevitablestrong surface return. This surface return is either groundclutter at zero Doppler shift, if the return is from land, orBragg clutter, if the return is from the ocean’s surface.Bragg clutter results from the coherent addition of signalelements backscattering from ocean-wave components thatare separated by half the radar’s operating wavelength, andis usually manifested as two clutter peaks shifted slightlyabove and below zero Doppler frequency by an amountcorresponding to the speed of the ocean’s waves toward andaway from the radar. The Bragg peaks will be more or lessresolved depending on the OTH radar’s coherent integrationtime. In either case (land or sea returns), moving targetswith a significant velocity component toward or away fromthe radar can be separated from the surface clutter byDoppler processing, as long as the surface clutter remainsnarrowly distributed in Doppler frequency.Figure 6c. Phase-screen/Diffraction Methodscattering functions for turbulent plasma motionsingle-phase-screen model of Figure 4, except that scatteroccurring over the extended region represented by themultiple screens caused a slight decorrelation of delay andDoppler that manifested as a slower decay in delay than riseat each Doppler frequency. The single-phase-screen resultwould have had symmetric rise and fall times at eachDoppler frequency. In Figure 6b, the plasma was assumedto be moving in a dominantly positive direction, except fora narrow region near the center of the ray path that had astrong negative (westerly) flow, representing a plasmavelocity shear. The result was a scattering function thatretained some of the wing-like structure of Figure 6a, butwith a substantial loss of delay-Doppler correlation.Figure 6c was an approximation to a turbulent ionospherewith rapidly changing plasma motion along the ray path.Here, all correlation of delay with Doppler was lost.The range of scattering-function shapes and theirdegree of spreading in delay and Doppler (and angle-ofarrival)is of interest to designers of communication modemsand radars that must include algorithms to mitigate thedeleterious effects of this spreading on, for example, intersymbolinterference or radar resolution. Using the approachof modeling disturbed ionospheres, applying Haselgrove’sEquations to trace rays, and computing the implied scatteringfunctions, our team at MRC was able to develop an HFsignal specification for nuclear-disturbed environments toassist such mitigation-algorithm development.As I mentioned in the introduction, I was approachedby Dr. Jason Providakes of MITRE following a talk on thePhase-screen/Diffraction Method that I had given at the1990 Ionospheric Effects Symposium. He apprised me ofwhat has come to be called the spread Doppler clutterproblem of OTH radar. Later, at the Naval ResearchLaboratory, Joe Thomason and Ben Root showed me someexamples of spread Doppler clutter (SDC) measured by theprototype ROTHR system in Virginia, which looked insoutherly directions. Post-sunset on many nights, the surfaceclutter was observed to broaden in Doppler frequency,sometimes to the point that it completely filled the ambiguousDoppler window (Doppler processing of OTH radar returnscauses Doppler frequencies with magnitudes larger than theNyquist frequency to wrap back into the first Nyquistinterval). Radar targets at any Doppler shift could beobscured. It was a significant and unanticipated problem.I knew that often post-sunset low-latitude ionosphericstructure develops in equatorial plasma bubbles. In 1988, Ihad been involved in a campaign to measure scintillationusing the ALTAIR radar, viewing satellites through thisstructure. I asked Joe and Ben about OTH signal processing,and was told about the range ambiguity of chirpedwaveforms, and that returns from ranges beyond the firstambiguity region appear superimposed on the returns in thefirst region. It seemed reasonable to me that the spreadDoppler clutter was being caused by multi-hop rays thatwere making their way to the low-latitude ionosphere, andwere being phase-modulated by the structured ionizationthere.The Australians were seeing the same spread Dopplerclutter with their experimental OTH radar, called the JindaleeFacility – Alice Springs (JFAS), which has a northwesterly-The<strong>Radio</strong> <strong>Science</strong> <strong>Bulletin</strong> No <strong>325</strong> (<strong>June</strong> <strong>2008</strong>) 43
- Page 4 and 5: URSI Forum on Radio Scienceand Tele
- Page 6 and 7: URSI Accounts 2007Income in 2007 wa
- Page 8 and 9: EURO EUROA2) Routine Meetings 5,372
- Page 10 and 11: URSI Awards 2008The URSI Board of O
- Page 12 and 13: • Compatibility refers to the abi
- Page 14 and 15: Introduction to Special Sections Ho
- Page 16 and 17: In the December 2008 issue, Part 2
- Page 18 and 19: mwÆ = eE + ew× B −mνw , (2)whe
- Page 20 and 21: Haselgrove equations [2]. Furthermo
- Page 22 and 23: anddQ 1 r ∂n= + n −Qdθ2 2 2n
- Page 24 and 25: Ray Tracing ofMagnetohydrodynamic W
- Page 26 and 27: Figure 1a. The refractive-index sur
- Page 28 and 29: 2 ⎡ ∂VAj, ∂VS⎤ω ⎢VAj, +
- Page 30 and 31: ( ω kV j j)dx ∂i 0 + ∂ω0,= =
- Page 32 and 33: compared with the wavelength, i.e.,
- Page 34 and 35: decreasing to half their value in a
- Page 36 and 37: Practical Applicationsof Haselgrove
- Page 38 and 39: **.modeled TID ionospheres using Ha
- Page 40 and 41: ∂ϕ∂ϕ1 kϕ∂r=− +, (12)∂
- Page 44 and 45: directed boresight and, similar to
- Page 46 and 47: Typical OTH radar ionospheric sound
- Page 48 and 49: ay-homing calculations for analyzin
- Page 50 and 51: Figure 1. A Cartesian geometry cons
- Page 52 and 53: orc dϕh′ = , (5a)4πdfincreases
- Page 54 and 55: in four runs by five rays, giving a
- Page 56 and 57: GPS : A Powerfull Tool forTime Tran
- Page 58 and 59: altitude of ~26562 km will tick mor
- Page 60 and 61: Each component of the errors is ass
- Page 62 and 63: Figure 3. The effect of GPS timeerr
- Page 64 and 65: Figure 6. The frequencystability of
- Page 66 and 67: Figure 9. The participating laborat
- Page 68 and 69: unlike the possibility of a gap in
- Page 70 and 71: Table 5. The capabilities of GPS ti
- Page 72 and 73: 12. References1. C. Audoin and J. V
- Page 74 and 75: ConferencesCONFERENCE REPORT12TH IN
- Page 76 and 77: URSI CONFERENCE CALENDARURSI cannot
- Page 78 and 79: The Journal of Atmospheric and Sola
- Page 80: APPLICATION FOR AN URSI RADIOSCIENT