A particular Gaussian mixture model for clustering and its ...
A particular Gaussian mixture model for clustering and its ...
A particular Gaussian mixture model for clustering and its ...

Create successful ePaper yourself
Turn your PDF publications into a flip-book with our unique Google optimized e-Paper software.
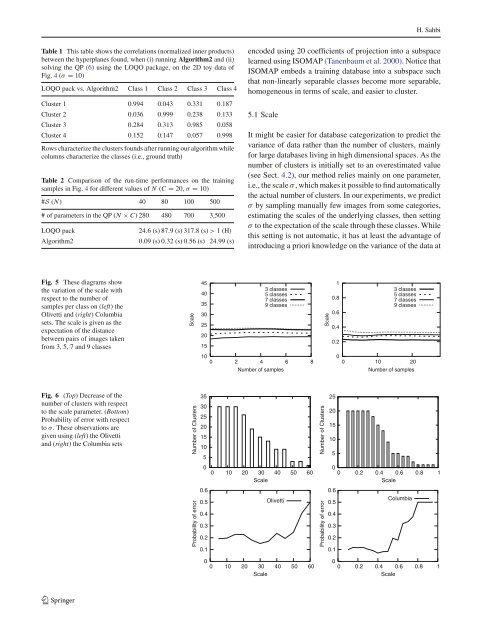
H. SahbiTable 1 This table shows the correlations (normalized inner products)between the hyperplanes found, when (i) running Algorithm2 <strong>and</strong> (ii)solving the QP (6) using the LOQO package, on the 2D toy data ofFig. 4 (σ = 10)LOQO pack vs. Algorithm2 Class 1 Class 2 Class 3 Class 4Cluster 1 0.994 0.043 0.331 0.187Cluster 2 0.036 0.999 0.238 0.133Cluster 3 0.284 0.313 0.985 0.058Cluster 4 0.152 0.147 0.057 0.998Rows characterize the clusters founds after running our algorithm whilecolumns characterize the classes (i.e., ground truth)Table 2 Comparison of the run-time per<strong>for</strong>mances on the trainingsamples in Fig. 4 <strong>for</strong> different values of N (C = 20,σ = 10)#S (N) 40 80 100 500# of parameters in the QP (N × C) 280 480 700 3,500LOQO packAlgorithm224.6 (s)87.9 (s) 317.8 (s)> 1 (H)0.09 (s) 0.32 (s) 0.56 (s) 24.99 (s)encoded using 20 coefficients of projection into a subspacelearned using ISOMAP (Tanenbaum et al. 2000). Notice thatISOMAP embeds a training database into a subspace suchthat non-linearly separable classes become more separable,homogeneous in terms of scale, <strong>and</strong> easier to cluster.5.1 ScaleIt might be easier <strong>for</strong> database categorization to predict thevariance of data rather than the number of clusters, mainly<strong>for</strong> large databases living in high dimensional spaces. As thenumber of clusters is initially set to an overestimated value(see Sect. 4.2), our method relies mainly on one parameter,i.e., the scale σ , which makes it possible to find automaticallythe actual number of clusters. In our experiments, we predictσ by sampling manually few images from some categories,estimating the scales of the underlying classes, then settingσ to the expectation of the scale through these classes. Whilethis setting is not automatic, it has at least the advantage ofintroducing a priori knowledge on the variance of the data atFig. 5 These diagrams showthe variation of the scale withrespect to the number ofsamples per class on (left)theOlivetti <strong>and</strong> (right) Columbiasets. The scale is given as theexpectation of the distancebetween pairs of images takenfrom 3, 5, 7 <strong>and</strong> 9 classesScale454035302520153 classes5 classes7 classes9 classesScale10.80.60.40.23 classes5 classes7 classes9 classes100 2 4 6 8Number of samples00 10 20Number of samplesFig. 6 (Top) Decrease of thenumber of clusters with respectto the scale parameter. (Bottom)Probability of error with respectto σ . These observations aregiven using (left) the Olivetti<strong>and</strong> (right) the Columbia setsProbability of errorNumber of Clusters353025201510500 10 20 30 40 50 60Scale0.60.5Olivetti0.40.30.20.1Probability of errorNumber of Clusters25201510500 0.2 0.4 0.6 0.8 1Scale0.6Columbia0.50.40.30.20.100 10 20 30 40 50 60Scale00 0.2 0.4 0.6 0.8 1Scale123