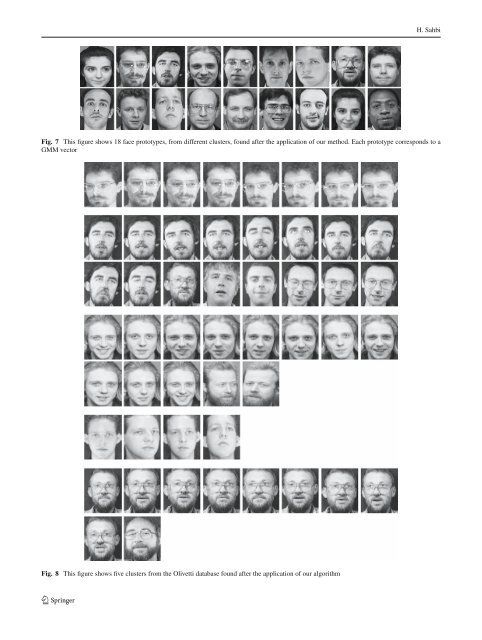
H. SahbiFig. 7 This figure shows 18 face prototypes, from different clusters, found after the application of our method. Each prototype corresponds to aGMM vectorFig. 8 This figure shows five clusters from the Olivetti database found after the application of our algorithm123
A <strong>particular</strong> <strong>Gaussian</strong> <strong>mixture</strong> <strong>model</strong> <strong>for</strong> <strong>clustering</strong> <strong>and</strong> <strong>its</strong> application to image retrieval<strong>and</strong> 15, see Fig. 6, top) is close to the actual numbers, resp.20 <strong>and</strong> 15. Furthermore, the probability of error (17)iscloseto <strong>its</strong> minimum <strong>for</strong> both Olivetti <strong>and</strong> Columbia (see Fig. 6,bottom).5.2 PrecisionA Clustering method can be objectively evaluated when theground truth is available, otherwise the meaning of <strong>clustering</strong>can differ from one intelligent observer to another. Thevalidity criteria are introduced in order to measure the qualityof a <strong>clustering</strong> algorithm, i.e., <strong>its</strong> capacity to assign data totheir actual classes. For a survey on these methods, see <strong>for</strong>example (Halkidi et al. 2002).In the presence of a ground truth, we consider in our worka simple validity criteria based on the probability of misclassification.The latter occurs when either two examplesbelonging to two different classes are assigned to the samecluster, or when two elements belonging to the same class areassigned different clusters. We denote X <strong>and</strong> Y as two r<strong>and</strong>omvariables st<strong>and</strong>ing respectively <strong>for</strong> the training examples<strong>and</strong> their different possible classes {y 1 ,...,y C } <strong>and</strong> X ′ , Y ′respectively similar to X, Y . We denote by f (X) the indexof the cluster of X in {y 1 ,...,y C }. Formally, we define themisclassification error as:P(1 {( f (X) = f (X ′ )} ̸= 1 {Y = Y ′ }) = (∗), (16)here:(∗) = P( f (X) ̸= f (X ′ ) | Y = Y ′ ) P(Y = Y ′ )+ P( f (X) = f (X ′ ) | Y ̸= Y ′ ) P(Y ̸= Y ′ ) (17)Again, Fig. 6 (bottom) shows the misclassification error(17) with respect to the scale parameter σ . Tables 3 <strong>and</strong> 4are the confusion matrices which show the distribution of20 <strong>and</strong> 15 categories from, respectively, the Olivetti <strong>and</strong> theColumbia sets through the clusters after the application ofour <strong>clustering</strong> method. We can see that this distribution isconcentrated in the diagonal <strong>and</strong> this clearly shows that mostof the training data are assigned to their actual categories (seeFigs. 7, 8).5.3 ComparisonFigure 9 shows a comparison of our kernel <strong>clustering</strong> methodswith respect to existing state of the art approaches includingfuzzy <strong>clustering</strong> (Sahbi <strong>and</strong> Boujemaa 2005), K-means(MacQueen 1965) <strong>and</strong> hierarchical <strong>clustering</strong> (Posse 2001).These results are shown <strong>for</strong> the Olivetti database. The error(17) is measured with respect to the number of clusters.Notice that the latter is fixed <strong>for</strong> hierarchical <strong>clustering</strong> <strong>and</strong>K-means while it corresponds to the resulting number of clustersafter setting σ (see Sect. 4.2) <strong>for</strong> fuzzy <strong>clustering</strong> <strong>and</strong> ourProbability of Error0.450.350.25K-MeansHierarchicalParticular GMMsFuzzy0.1515 20 25Number of ClustersFig. 9 This figure shows a comparison of the generalization error onthe Olivetti set of our method <strong>and</strong> other existing state of the art methodsincluding fuzzy, k-means <strong>and</strong> hierarchical <strong>clustering</strong>method. We clearly see that the generalization error takes <strong>its</strong>smallest value when the number of clusters is close to theactual one (i.e., 20).6 Conclusion <strong>and</strong> future workWe introduced in this work an original approach <strong>for</strong> <strong>clustering</strong>based on a <strong>particular</strong> <strong>Gaussian</strong> <strong>mixture</strong> <strong>model</strong> (GMM).The method considers an objective function which acts asa regularizer <strong>and</strong> minimizes the overlap between the clusterGMMs. The GMM parameters are found by solving aquadratic programming problem using a new decompositionalgorithm which considers trivial linear programming subproblems.The actual number of clusters is found by controllingthe scale parameter of these GMMs; in practice, it turnsout that predicting this parameter is easier than predicting theactual number of clusters mainly <strong>for</strong> large databases livingin high dimensional spaces.The concept presented in this paper is different from kernelregression which might be assimilated to density estimationwhile our approach per<strong>for</strong>ms this estimation <strong>for</strong> each cluster.Obviously, the proposed approach per<strong>for</strong>ms <strong>clustering</strong> <strong>and</strong>density estimation at the same time.The validity of the method is demonstrated on toy data aswell as database categorization problems. As a future work,we will investigate the application of the method to h<strong>and</strong>lenoisy data.ReferencesBach FR, Jordan MI (2003) Learning spectral <strong>clustering</strong>. Neural in<strong>for</strong>mationprocessing systemsBen-Hur A, Horn D, Siegelmann HT, Vapnik V (2000) Support vector<strong>clustering</strong>. Neural in<strong>for</strong>mation processing systems, pp 367–373Bezdek JC (1981) Pattern recognition with fuzzy objective functionalgorithms. Plenum Press, New York123