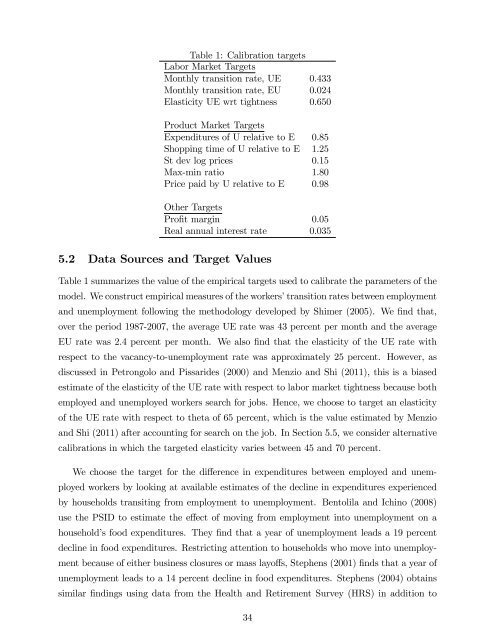
Table 1: Calibration targetsLabor Market TargetsMonthly transition rate, UE 0.433Monthly transition rate, EU 0.024Elasticity UE wrt tightness 0.650Product Market TargetsExpenditures of U relative to E 0.85<strong>Shopping</strong> time of U relative to E 1.25St dev log prices 0.15Max-min ratio 1.80Price paid by U relative to E 0.98Other TargetsPro…t margin 0.05Real annual interest rate 0.0355.2 Data Sources <strong>and</strong> Target ValuesTable 1 summarizes the value of the empirical targets used to calibrate the parameters of themodel. We construct empirical measures of the workers’transition rates between employment<strong>and</strong> unemployment following the methodology developed by Shimer (2005). We …nd that,over the period 1987-2007, the average UE rate was 43 percent per month <strong>and</strong> the averageEU rate was 2.4 percent per month. We also …nd that the elasticity of the UE rate withrespect to the vacancy-to-unemployment rate was approximately 25 percent. However, asdiscussed in Petrongolo <strong>and</strong> Pissarides (2000) <strong>and</strong> Menzio <strong>and</strong> Shi (2011), this is a biasedestimate of the elasticity of the UE rate with respect to labor market tightness because bothemployed <strong>and</strong> unemployed workers search for jobs. Hence, we choose to target an elasticityof the UE rate with respect to theta of 65 percent, which is the value estimated by Menzio<strong>and</strong> Shi (2011) after accounting for search on the job. In Section 5.5, we consider alternativecalibrations in which the targeted elasticity varies between 45 <strong>and</strong> 70 percent.We choose the target for the di¤erence in expenditures between employed <strong>and</strong> unemployedworkers by looking at available estimates of the decline in expenditures experiencedby households transiting from employment to unemployment. Bentolila <strong>and</strong> Ichino (2008)use the PSID to estimate the e¤ect of moving from employment into unemployment on ahousehold’s food expenditures. They …nd that a year of unemployment leads a 19 percentdecline in food expenditures. Restricting attention to households who move into unemploymentbecause of either business closures or mass layo¤s, Stephens (2001) …nds that a year ofunemployment leads to a 14 percent decline in food expenditures. Stephens (2004) obtainssimilar …ndings using data from the Health <strong>and</strong> Retirement Survey (HRS) in addition to34
the PSID. 12 Based on these estimates, we choose a baseline target of 15 percent for thedi¤erence in expenditures between employed <strong>and</strong> unemployed workers. However, in Section5.5, we allow this target to vary between 10 <strong>and</strong> 40 percent.We use cross-sectional data from the American Time Use Survey (ATUS) to choose thetarget for the di¤erence in the amount of time devoted to shopping by employed <strong>and</strong> unemployedworkers. We restrict attention to individuals aged 22-55. We …nd that employedindividuals spend between 24 <strong>and</strong> 33 percent less time shopping than non-employed individuals,<strong>and</strong> between 13 <strong>and</strong> 20 percent less than unemployed individuals. 13 Krueger <strong>and</strong> Mueller(2010) also measure di¤erences in shopping time between workers in di¤erent employmentstates. They …nd a di¤erence in shopping time between employed <strong>and</strong> unemployed individualsof 29 percent in the US, 67 percent in Canada <strong>and</strong> Western Europe <strong>and</strong> 56 percent inEastern Europe. On the basis of these …ndings, we choose a baseline target of 25 percent forthe di¤erence in shopping time between employed <strong>and</strong> unemployed workers. In Section 5.5,we allow this target to vary between 10 <strong>and</strong> 50 percent.We use the Kielts-Nielsen Consumer Panel Data (KNCDP) to measure price dispersion,as well as the di¤erence in price paid by employed <strong>and</strong> non-employed households. 14restrict attention to individuals aged 22-55. We consider di¤erent de…nitions of a product.In our narrowest de…nition, we group together all goods that have di¤erence barcodes, but areidentical along all other dimensions (i.e. br<strong>and</strong>, size, color, shape, packaging, etc. . . ). In ourbaseline de…nition, we group together all goods that are identical, except for their barcode<strong>and</strong> br<strong>and</strong>. In our broadest de…nition, we group together all goods that are identical, exceptfor their barcode, br<strong>and</strong> <strong>and</strong> size. We de…ne a market as Scantrack Market Area, which isthe notion of market used by Nielsen. We de…ne a time period as a quarter. Then, for eachtriple of product, market <strong>and</strong> time period, we measure the distribution of transaction prices<strong>and</strong> we compute the st<strong>and</strong>ard deviation of log prices <strong>and</strong> various percentile ranges. For ourbaseline de…nition of a product, we …nd that the median st<strong>and</strong>ard deviation of log prices isapproximately 25 percent (see Table 2 in Kaplan <strong>and</strong> Menzio 2013), which is similar to the12 The elasticity of food expenditures with respect to income is likely to be low compared to other expenditurescategories, such as luxury goods or semi-durable goods. Therefore, the estimated e¤ect of moving intounemployment on food expenditures is likely to be low compared with the e¤ect on overall expenditures.13 The estimation results vary depending on the de…nition of shopping time. We consider a broad de…nitionof shopping time which includes time spent purchasing all goods <strong>and</strong> services plus related travel time, <strong>and</strong> anarrow de…nition of shopping time which includes time spent purchasing consumer goods <strong>and</strong> groceries plusrelated travel time. All details are available upon request.14 The KNCPD is a panel dataset covering approximately 50,000 households over the period 2004-2009.Respondents use in-home UPC scanning devices to record information (price, quantity, outlet, etc. . . ) abouttheir purchases of grocery <strong>and</strong> non-grocery household items, which account for roughly 30 percent of totalexpenditures. This data is similar, although much broader in scope to that used by Aguiar <strong>and</strong> Hurst (2007)in their analysis of the shopping behavior of retired households. The reader can …nd more details in Kaplan<strong>and</strong> Menzio (2013).35We