Shopping Externalities and Self Fulfilling Unemployment Fluctuations*
Shopping Externalities and Self Fulfilling Unemployment Fluctuations*
Shopping Externalities and Self Fulfilling Unemployment Fluctuations*

Create successful ePaper yourself
Turn your PDF publications into a flip-book with our unique Google optimized e-Paper software.
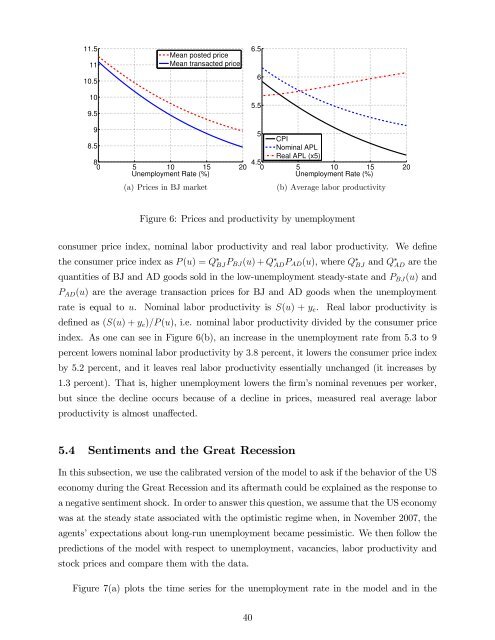
11.51110.5109.5Mean posted priceMean transacted price6.565.595CPI8.5Nominal APLReal APL (x5)84.50 5 10 15 20 0 5 10 15 20<strong>Unemployment</strong> Rate (%)<strong>Unemployment</strong> Rate (%)(a) Prices in BJ market(b) Average labor productivityFigure 6: Prices <strong>and</strong> productivity by unemploymentconsumer price index, nominal labor productivity <strong>and</strong> real labor productivity. We de…nethe consumer price index as P (u) = Q BJ P BJ(u) + Q AD P AD(u), where Q BJ <strong>and</strong> Q AD are thequantities of BJ <strong>and</strong> AD goods sold in the low-unemployment steady-state <strong>and</strong> P BJ (u) <strong>and</strong>P AD (u) are the average transaction prices for BJ <strong>and</strong> AD goods when the unemploymentrate is equal to u. Nominal labor productivity is S(u) + y e . Real labor productivity isde…ned as (S(u) + y e )=P (u), i.e. nominal labor productivity divided by the consumer priceindex. As one can see in Figure 6(b), an increase in the unemployment rate from 5.3 to 9percent lowers nominal labor productivity by 3:8 percent, it lowers the consumer price indexby 5.2 percent, <strong>and</strong> it leaves real labor productivity essentially unchanged (it increases by1.3 percent). That is, higher unemployment lowers the …rm’s nominal revenues per worker,but since the decline occurs because of a decline in prices, measured real average laborproductivity is almost una¤ected.5.4 Sentiments <strong>and</strong> the Great RecessionIn this subsection, we use the calibrated version of the model to ask if the behavior of the USeconomy during the Great Recession <strong>and</strong> its aftermath could be explained as the response toa negative sentiment shock. In order to answer this question, we assume that the US economywas at the steady state associated with the optimistic regime when, in November 2007, theagents’expectations about long-run unemployment became pessimistic. We then follow thepredictions of the model with respect to unemployment, vacancies, labor productivity <strong>and</strong>stock prices <strong>and</strong> compare them with the data.Figure 7(a) plots the time series for the unemployment rate in the model <strong>and</strong> in the40