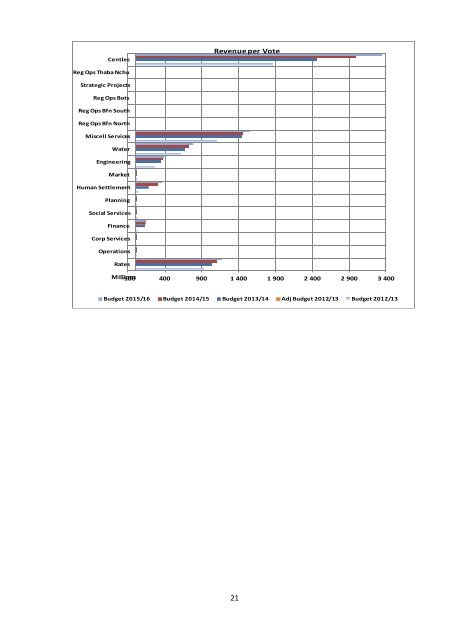
GRANTS & SUBSIDIES2012/13 2013/14 2014/15 2015/16R’000 R’000 R’000 R’000Operating Grants & SubsidiesEquitable Share 608,596 634,704 680,527 733,305Equitable Share - Centlec 13,233 17,467 20,611 22,672Financial Management Grant 1,500 1,500 1,500 1,500Public Transport Infrastructure & System 20,000 20,000 - -Provincial Grant CCTV 7,000 7,000 - -Neighbourhood Dev Partnership Programme - 1,750 2,750 2,750DWAF - ACIP - 7,900 - -Sub-<strong>to</strong>tal 650,329 690,321 705,388 760,227Capital Grants & SubsidiesFS Provincial Grant - CCTV 3,000 - - -Fs Provincial Human Settlement - 43,773 - -Expanded Public Works Programme Incentive Grant - 6,000 10,000 10,000DWAF - ACIP - 4,100 - -Urban Settlements Development Grant 668,777 656,719 693,272 734,568National Electrification Grant 25,000 42,000 40,000 40,255Neighbourhood Dev Partnership Programme - - 3,000 10,000Sub-<strong>to</strong>tal 696,777 752,592 746,272 794,823TOTAL 1,347,106 1,442,913 1,451,660 1,555,050REVENUE PER VOTEAs outlined below is <strong>the</strong> revenue per vote, indicating <strong>the</strong> various direc<strong>to</strong>rates’ resource in<strong>co</strong>me:Revenue per Vote<strong>Budget</strong>2012/13Adj.<strong>Budget</strong>2012/13<strong>Budget</strong>2013/14 Growth 2014/15 2015/16R’000 R’000 R’000 % R’000 R’000Property Rates -933,471 -933,471 -1,029,219 10.26 -1,101,457 -1,177,816City Manager - Operations -2 -2 -3,663 -2,524 -1,136Corporate Services -10,164 -8,964 -11,169 12.60 -12,273 -13,487Finance -28,119 -102,440 -128,709 25.64 -136,618 -145,023Social Services -32,546 -13,855 -15,575 12.41 -17,410 -18,670Planning -5,373 -5,373 -5,910 9.99 -6,501 -7,152Human Settlement -31,793 -31,793 -175,611 452.36 -293,663 -354,561Fresh Produce Market -20,561 -18,642 -17,820 -4.41 -19,602 -21,562Engineering -256,040 -256,040 -337,161 31.68 -361,343 -389,182Water -610,174 -610,174 -668,129 9.50 -721,088 -780,888Miscellaneous Services -1,105,739 -1,450,103 -1,438,953 -0.77 -1,449,225 -1,547,142Strategic Projects & Service Delivery -5 -5 - - - -Centlec -1,854,328 -2,125,162 -2,465,995 16.04 -2,994,207 -3,343,793TOTAL -4,888,315, -5,556,026 -6,297,914 13.35 -7,115,522 -7,800,413The graph below illustrates <strong>the</strong> revenue per vote over <strong>the</strong> <strong>MTREF</strong> period, as outlined above.20
CentlecRevenue per VoteReg Ops Thaba NchuStrategic ProjectsReg Ops BotsReg Ops Bfn SouthReg Ops Bfn NorthMiscell ServicesWaterEngineeringMarketHuman SettlementPlanningSocial ServicesFinanceCorp ServicesOperationsRatesMillions ‐100 400 900 1 400 1 900 2 400 2 900 3 400<strong>Budget</strong> 2015/16 <strong>Budget</strong> 2014/15 <strong>Budget</strong> 2013/14 Adj <strong>Budget</strong> 2012/13 <strong>Budget</strong> 2012/1321