

to download the PDF for MTREF Budget Write-up ... - Mangaung.co.za
to download the PDF for MTREF Budget Write-up ... - Mangaung.co.za
to download the PDF for MTREF Budget Write-up ... - Mangaung.co.za
- No tags were found...

Create successful ePaper yourself
Turn your PDF publications into a flip-book with our unique Google optimized e-Paper software.
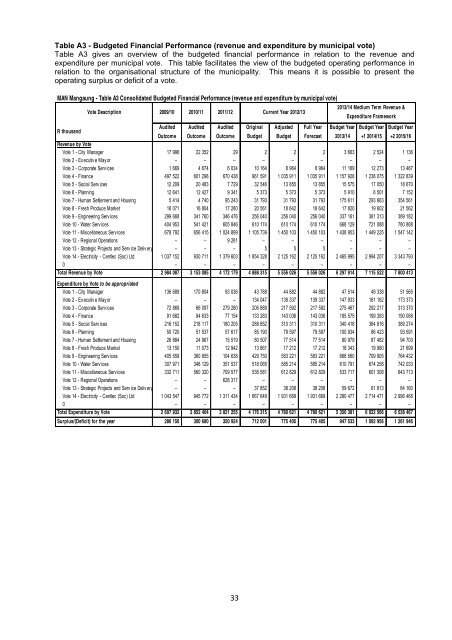
Table A3 - <strong>Budget</strong>ed Financial Per<strong>for</strong>mance (revenue and expenditure by municipal vote)Table A3 gives an overview of <strong>the</strong> budgeted financial per<strong>for</strong>mance in relation <strong>to</strong> <strong>the</strong> revenue andexpenditure per municipal vote. This table facilitates <strong>the</strong> view of <strong>the</strong> budgeted operating per<strong>for</strong>mance inrelation <strong>to</strong> <strong>the</strong> organisational structure of <strong>the</strong> municipality. This means it is possible <strong>to</strong> present <strong>the</strong>operating surplus or deficit of a vote.MAN <strong>Mangaung</strong> - Table A3 Consolidated <strong>Budget</strong>ed Financial Per<strong>for</strong>mance (revenue and expenditure by municipal vote)2013/14 Medium Term Revenue &Vote Description 2009/10 2010/11 2011/12Current Year 2012/13Expenditure FrameworkR thousandAudited Audited Audited Original Adjusted Full Year <strong>Budget</strong> Year <strong>Budget</strong> Year <strong>Budget</strong> YearOut<strong>co</strong>me Out<strong>co</strong>me Out<strong>co</strong>me <strong>Budget</strong> <strong>Budget</strong> Forecast 2013/14 +1 2014/15 +2 2015/16Revenue by VoteVote 1 - City Manager 17 996 22 352 29 2 2 2 3 663 2 524 1 136Vote 2 - Ex ecutiv e May or – – – – – – – – –Vote 3 - Corporate Serv ices 1 669 4 674 6 034 10 164 8 964 8 964 11 169 12 273 13 487Vote 4 - Finance 497 522 601 298 670 438 961 591 1 035 911 1 035 911 1 157 928 1 238 075 1 322 839Vote 5 - Social Serv ices 12 209 20 483 7 729 32 546 13 855 13 855 15 575 17 050 18 670Vote 6 - Planning 12 641 12 427 9 341 5 373 5 373 5 373 5 910 6 501 7 152Vote 7 - Human Settlement and Housing 5 414 4 740 95 243 31 793 31 793 31 793 175 611 293 663 354 561Vote 8 - Fresh Produce Market 16 071 16 804 17 280 20 561 18 642 18 642 17 820 19 602 21 562Vote 9 - Engineering Serv ices 299 668 341 760 346 476 256 040 256 040 256 040 337 161 361 313 389 182Vote 10 - Water Serv ices 404 953 541 421 605 846 610 174 610 174 610 174 668 129 721 088 780 888Vote 11 - Miscellaneous Serv ices 678 792 656 415 1 024 899 1 105 739 1 450 103 1 450 103 1 438 953 1 449 225 1 547 142Vote 12 - Regional Operations – – 9 261 – – – – – –Vote 13 - Strategic Projects and Serv ice Deliv ery – – – 5 5 5 – – –Vote 14 - Electricity - Centlec (Soc) Ltd 1 037 152 930 711 1 379 603 1 854 328 2 125 162 2 125 162 2 465 995 2 994 207 3 343 7930 – – – – – – – – –Total Revenue by Vote 2 984 087 3 153 085 4 172 179 4 888 315 5 556 026 5 556 026 6 297 914 7 115 522 7 800 413Expenditure by Vote <strong>to</strong> be appropriatedVote 1 - City Manager 136 689 170 804 93 036 43 788 44 882 44 882 47 514 49 338 51 565Vote 2 - Ex ecutiv e May or – – – 134 047 139 337 139 337 147 933 161 162 173 373Vote 3 - Corporate Serv ices 72 869 66 097 279 280 206 889 217 592 217 592 275 467 292 217 313 370Vote 4 - Finance 91 682 94 633 77 154 133 283 143 036 143 036 185 575 199 393 190 088Vote 5 - Social Serv ices 216 152 218 117 180 205 288 852 310 311 310 311 340 418 364 816 389 274Vote 6 - Planning 50 720 51 537 57 617 85 190 79 597 79 597 100 934 86 423 93 591Vote 7 - Human Settlement and Housing 26 884 24 967 15 519 80 507 77 514 77 514 80 979 87 482 94 703Vote 8 - Fresh Produce Market 13 150 11 073 12 942 13 861 17 212 17 212 18 343 19 980 21 699Vote 9 - Engineering Serv ices 405 559 360 955 104 638 429 750 583 221 583 221 668 560 709 905 764 432Vote 10 - Water Serv ices 307 971 348 129 351 537 518 065 585 214 585 214 610 791 674 258 742 033Vote 11 - Miscellaneous Serv ices 332 711 560 320 709 577 536 581 612 829 612 829 533 717 601 308 643 713Vote 12 - Regional Operations – – 628 317 – – – – – –Vote 13 - Strategic Projects and Serv ice Deliv ery – – – 37 852 38 208 38 208 59 672 61 813 64 160Vote 14 - Electricity - Centlec (Soc) Ltd 1 043 547 945 772 1 311 434 1 667 649 1 931 669 1 931 669 2 280 477 2 714 471 2 996 4680 – – – – – – – – –Total Expenditure by Vote 2 697 932 2 852 404 3 821 255 4 176 315 4 780 621 4 780 621 5 350 381 6 022 566 6 538 467Surplus/(Deficit) <strong>for</strong> <strong>the</strong> year 286 156 300 680 350 924 712 001 775 405 775 405 947 533 1 092 956 1 261 94633


