

to download the PDF for MTREF Budget Write-up ... - Mangaung.co.za
to download the PDF for MTREF Budget Write-up ... - Mangaung.co.za
to download the PDF for MTREF Budget Write-up ... - Mangaung.co.za
- No tags were found...

Create successful ePaper yourself
Turn your PDF publications into a flip-book with our unique Google optimized e-Paper software.
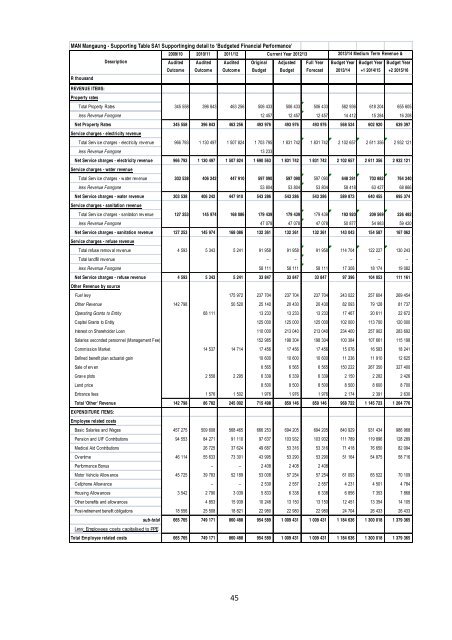
MAN <strong>Mangaung</strong> - S<strong>up</strong>porting Table SA1 S<strong>up</strong>portinging detail <strong>to</strong> '<strong>Budget</strong>ed Financial Per<strong>for</strong>mance'2009/10 2010/11 2011/12Current Year 2012/13DescriptionAuditedOut<strong>co</strong>meAuditedOut<strong>co</strong>meAuditedOut<strong>co</strong>meOriginal<strong>Budget</strong>Adjusted<strong>Budget</strong>Full YearForecastR thousand2013/14 Medium Term Revenue &<strong>Budget</strong> Year <strong>Budget</strong> Year <strong>Budget</strong> Year2013/14 +1 2014/15 +2 2015/16REVENUE ITEMS:Property ratesTotal Property Rates 345 558 396 843 463 256 506 433 506 433 506 433 582 936 618 204 655 605less Revenue Foregone 12 457 12 457 12 457 14 412 15 284 16 208Net Property Rates 345 558 396 843 463 256 493 976 493 976 493 976 568 524 602 920 639 397Service charges - electricity revenueTotal Serv ice charges - electricity rev enue 966 793 1 130 497 1 507 824 1 703 795 1 831 742 1 831 742 2 102 657 2 611 356 2 932 121less Revenue Foregone 13 233Net Service charges - electricity revenue 966 793 1 130 497 1 507 824 1 690 563 1 831 742 1 831 742 2 102 657 2 611 356 2 932 121Service charges - water revenueTotal Serv ice charges - w ater rev enue 303 538 406 242 447 910 597 090 597 090 597 090 648 291 703 882 764 240less Revenue Foregone 53 804 53 804 53 804 58 418 63 427 68 866Net Service charges - water revenue 303 538 406 242 447 910 543 286 543 286 543 286 589 873 640 455 695 374Service charges - sanitation revenueTotal Serv ice charges - sanitation rev enue 127 253 145 974 168 086 179 439 179 439 179 439 193 920 209 569 226 482less Revenue Foregone 47 078 47 078 47 078 50 877 54 983 59 420Net Service charges - sanitation revenue 127 253 145 974 168 086 132 361 132 361 132 361 143 043 154 587 167 062Service charges - refuse revenueTotal refuse remov al rev enue 4 593 5 343 5 241 91 958 91 958 91 958 114 704 122 227 130 243Total landfill rev enue – – – – –less Revenue Foregone 58 111 58 111 58 111 17 308 18 174 19 082Net Service charges - refuse revenue 4 593 5 343 5 241 33 847 33 847 33 847 97 396 104 053 111 161O<strong>the</strong>r Revenue by sourceFuel levy 175 972 237 704 237 704 237 704 243 022 257 604 269 454O<strong>the</strong>r Revenue 142 798 50 520 25 140 20 430 20 430 82 093 79 128 81 737Operating Grants <strong>to</strong> Entity 68 111 13 233 13 233 13 233 17 467 20 611 22 672Capital Grants <strong>to</strong> Entity 125 000 125 000 125 000 102 000 113 700 120 000Interest on Shareholder Loan 110 000 213 040 213 040 234 400 257 902 283 692Salaries se<strong>co</strong>nded personnel (Management Fee) 152 985 198 304 198 304 100 384 107 661 115 198Commission Market 14 537 14 714 17 456 17 456 17 456 15 076 16 583 18 241Defined benefit plan actuarial gain 10 600 10 600 10 600 11 236 11 910 12 625Sale of erv en 6 565 6 565 6 565 150 222 267 350 327 400Grav e plots 2 558 2 295 6 339 6 339 6 339 2 150 2 282 2 426Land price 8 500 8 500 8 500 8 500 8 600 8 700Entrance fees 1 576 1 502 1 976 1 976 1 976 2 174 2 391 2 630Total 'O<strong>the</strong>r' Revenue 142 798 86 782 245 002 715 498 859 146 859 146 968 722 1 145 723 1 264 776EXPENDITURE ITEMS:Employee related <strong>co</strong>stsBasic Salaries and Wages 457 275 509 608 568 465 666 253 694 205 694 205 840 929 931 434 986 968Pension and UIF Contributions 94 553 84 271 91 110 97 637 103 932 103 932 111 789 119 896 128 289Medical Aid Contributions 26 725 37 624 49 687 53 316 53 316 71 418 76 650 82 094Ov ertime 46 114 55 633 73 301 43 995 53 290 53 290 51 164 54 875 58 716Per<strong>for</strong>mance Bonus – – 2 408 2 408 2 408Mo<strong>to</strong>r Vehicle Allow ance 45 725 39 783 52 189 53 008 57 254 57 254 61 093 65 522 70 109Cellphone Allow ance – – 2 539 2 557 2 557 4 231 4 501 4 784Housing Allow ances 3 542 2 790 3 039 5 833 6 338 6 338 6 856 7 353 7 868O<strong>the</strong>r benefits and allow ances 4 853 15 939 10 248 13 150 13 150 12 451 13 354 14 105Post-retirement benefit obligations 18 556 25 508 18 821 22 980 22 980 22 980 24 704 26 433 26 433sub-<strong>to</strong>tal 665 765 749 171 860 488 954 589 1 009 431 1 009 431 1 184 636 1 300 018 1 379 365Less: Employees <strong>co</strong>sts capitalised <strong>to</strong> PPETotal Employee related <strong>co</strong>sts 665 765 749 171 860 488 954 589 1 009 431 1 009 431 1 184 636 1 300 018 1 379 36545


