

to download the PDF for MTREF Budget Write-up ... - Mangaung.co.za
to download the PDF for MTREF Budget Write-up ... - Mangaung.co.za
to download the PDF for MTREF Budget Write-up ... - Mangaung.co.za
- No tags were found...

Create successful ePaper yourself
Turn your PDF publications into a flip-book with our unique Google optimized e-Paper software.
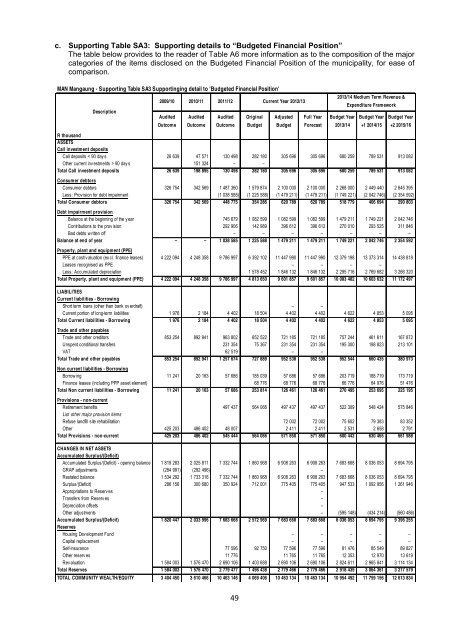
c. S<strong>up</strong>porting Table SA3: S<strong>up</strong>porting details <strong>to</strong> “<strong>Budget</strong>ed Financial Position”The table below provides <strong>to</strong> <strong>the</strong> reader of Table A6 more in<strong>for</strong>mation as <strong>to</strong> <strong>the</strong> <strong>co</strong>mposition of <strong>the</strong> majorcategories of <strong>the</strong> items disclosed on <strong>the</strong> <strong>Budget</strong>ed Financial Position of <strong>the</strong> municipality, <strong>for</strong> ease of<strong>co</strong>mparison.MAN <strong>Mangaung</strong> - S<strong>up</strong>porting Table SA3 S<strong>up</strong>portinging detail <strong>to</strong> '<strong>Budget</strong>ed Financial Position'2009/10 2010/11 2011/12Current Year 2012/13DescriptionAuditedOut<strong>co</strong>meAuditedOut<strong>co</strong>meAuditedOut<strong>co</strong>meOriginal<strong>Budget</strong>Adjusted<strong>Budget</strong>Full YearForecast2013/14 Medium Term Revenue &Expenditure Framework<strong>Budget</strong> Year <strong>Budget</strong> Year <strong>Budget</strong> Year2013/14 +1 2014/15 +2 2015/16R thousandASSETSCall investment depositsCall deposits < 90 day s 26 639 47 571 130 498 282 180 305 696 305 696 680 259 789 531 913 082O<strong>the</strong>r current inv estments > 90 day s 151 324 – –Total Call investment deposits 26 639 198 895 130 498 282 180 305 696 305 696 680 259 789 531 913 082Consumer deb<strong>to</strong>rsConsumer deb<strong>to</strong>rs 326 754 342 569 1 487 360 1 579 874 2 100 000 2 100 000 2 268 000 2 449 440 2 645 395Less: Prov ision <strong>for</strong> debt impairment (1 038 585) (1 225 588) (1 479 211) (1 479 211) (1 749 221) (2 042 746) (2 354 592)Total Consumer deb<strong>to</strong>rs 326 754 342 569 448 775 354 286 620 789 620 789 518 779 406 694 290 803Debt impairment provisionBalance at <strong>the</strong> beginning of <strong>the</strong> y ear 745 679 1 082 599 1 082 599 1 082 599 1 479 211 1 749 221 2 042 746Contributions <strong>to</strong> <strong>the</strong> prov ision 292 906 142 989 396 612 396 612 270 010 293 525 311 846Bad debts w ritten off – – – – – – –Balance at end of year – – 1 038 585 1 225 588 1 479 211 1 479 211 1 749 221 2 042 746 2 354 592Property, plant and equipment (PPE)PPE at <strong>co</strong>st/v aluation (ex cl. finance leases) 4 222 094 4 248 358 9 786 997 6 392 102 11 447 990 11 447 990 12 379 198 13 373 314 14 438 818Leases re<strong>co</strong>gnised as PPE – – – –Less: Accumulated depreciation 1 578 452 1 846 132 1 846 132 2 295 716 2 769 682 3 266 320Total Property, plant and equipment (PPE) 4 222 094 4 248 358 9 786 997 4 813 650 9 601 857 9 601 857 10 083 482 10 603 632 11 172 497LIABILITIESCurrent liabilities - BorrowingShort term loans (o<strong>the</strong>r than bank ov erdraft) – –Current portion of long-term liabilities 1 976 2 184 4 402 18 504 4 402 4 402 4 622 4 853 5 095Total Current liabilities - Borrowing 1 976 2 184 4 402 18 504 4 402 4 402 4 622 4 853 5 095Trade and o<strong>the</strong>r payablesTrade and o<strong>the</strong>r credi<strong>to</strong>rs 853 254 892 941 963 802 652 522 721 185 721 185 757 244 461 611 167 872Unspent <strong>co</strong>nditional transfers 231 354 75 367 231 354 231 354 195 300 198 823 213 101VAT 62 519 – –Total Trade and o<strong>the</strong>r payables 853 254 892 941 1 257 674 727 889 952 538 952 538 952 544 660 435 380 973Non current liabilities - BorrowingBorrow ing 11 241 20 163 57 686 185 039 57 686 57 686 203 719 188 719 173 719Finance leases (including PPP asset element) 68 776 68 776 68 776 66 776 64 976 51 476Total Non current liabilities - Borrowing 11 241 20 163 57 686 253 814 126 461 126 461 270 495 253 695 225 195Provisions - non-currentRetirement benefits 497 437 564 066 497 437 497 437 522 309 548 424 575 846List o<strong>the</strong>r major provision itemsRefuse landfill site rehabilitation 72 002 72 002 75 602 79 383 83 352O<strong>the</strong>r 425 203 486 402 48 007 2 411 2 411 2 531 2 658 2 791Total Provisions - non-current 425 203 486 402 545 444 564 066 571 850 571 850 600 442 630 465 661 988CHANGES IN NET ASSETSAccumulated Surplus/(Deficit)Accumulated Surplus/(Deficit) - opening balance 1 819 283 2 025 811 7 332 744 1 860 968 6 908 263 6 908 263 7 683 668 8 036 053 8 694 795GRAP adjustments (284 991) (292 496) –Restated balance 1 534 292 1 733 316 7 332 744 1 860 968 6 908 263 6 908 263 7 683 668 8 036 053 8 694 795Surplus/(Deficit) 286 156 300 680 350 924 712 001 775 405 775 405 947 533 1 092 956 1 261 946Appropriations <strong>to</strong> Reserv es –Transfers from Reserv es –Depreciation offsets –O<strong>the</strong>r adjustments – (595 148) (434 214) (560 486)Accumulated Surplus/(Deficit) 1 820 447 2 033 996 7 683 668 2 572 969 7 683 668 7 683 668 8 036 053 8 694 795 9 396 255ReservesHousing Dev elopment Fund – – – – –Capital replacement – – – – –Self-insurance 77 596 92 750 77 596 77 596 81 476 85 549 89 827O<strong>the</strong>r reserv es 11 776 11 765 11 765 12 353 12 970 13 619Rev aluation 1 584 003 1 576 470 2 690 106 1 403 688 2 690 106 2 690 106 2 824 611 2 965 841 3 114 134Total Reserves 1 584 003 1 576 470 2 779 477 1 496 438 2 779 466 2 779 466 2 918 439 3 064 361 3 217 579TOTAL COMMUNITY WEALTH/EQUITY 3 404 450 3 610 466 10 463 146 4 069 406 10 463 134 10 463 134 10 954 492 11 759 156 12 613 83449


