

to download the PDF for MTREF Budget Write-up ... - Mangaung.co.za
to download the PDF for MTREF Budget Write-up ... - Mangaung.co.za
to download the PDF for MTREF Budget Write-up ... - Mangaung.co.za
- No tags were found...

Create successful ePaper yourself
Turn your PDF publications into a flip-book with our unique Google optimized e-Paper software.
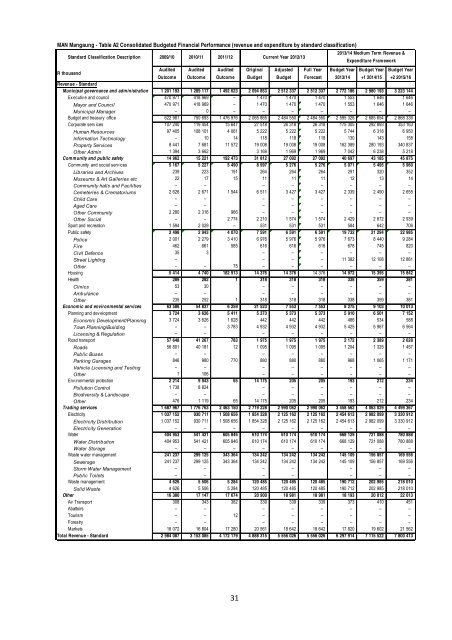
MAN <strong>Mangaung</strong> - Table A2 Consolidated <strong>Budget</strong>ed Financial Per<strong>for</strong>mance (revenue and expenditure by standard classification)Standard Classification Description 2009/10 2010/11 2011/12Current Year 2012/132013/14 Medium Term Revenue &Expenditure FrameworkR thousandAudited Audited Audited Original Adjusted Full Year <strong>Budget</strong> Year <strong>Budget</strong> Year <strong>Budget</strong> YearOut<strong>co</strong>me Out<strong>co</strong>me Out<strong>co</strong>me <strong>Budget</strong> <strong>Budget</strong> Forecast 2013/14 +1 2014/15 +2 2015/16Revenue - StandardMunicipal governance and administration 1 201 193 1 289 117 1 492 623 2 094 853 2 512 337 2 512 337 2 772 186 2 980 193 3 223 144Ex ecutiv e and <strong>co</strong>uncil 470 971 418 969 – 1 470 1 470 1 470 1 553 1 646 1 646Mayor and Council 470 971 418 969 – 1 470 1 470 1 470 1 553 1 646 1 646Municipal Manager – 0 – – – – – – –<strong>Budget</strong> and treasury office 622 981 750 693 1 476 976 2 065 865 2 484 550 2 484 550 2 595 328 2 685 654 2 868 336Corporate serv ices 107 240 119 454 15 647 27 518 26 318 26 318 175 305 292 893 353 163Human Resources 97 405 108 101 4 061 5 222 5 222 5 222 5 744 6 318 6 950In<strong>for</strong>mation Technology – 10 14 118 118 118 130 143 158Property Services 8 441 7 681 11 572 19 008 19 008 19 008 162 389 280 193 340 837O<strong>the</strong>r Admin 1 394 3 662 3 169 1 969 1 969 7 042 6 238 5 218Community and public safety 14 962 15 221 192 473 31 812 27 092 27 092 40 697 43 185 45 875Community and social serv ices 5 167 5 227 5 490 8 997 5 276 5 276 5 071 5 495 5 960Libraries and Archives 239 223 191 264 264 264 291 320 352Museums & Art Galleries etc 22 17 15 11 11 11 12 13 14Community halls and Facilities – – – – – – – –Cemeteries & Crema<strong>to</strong>riums 2 626 2 671 1 544 6 511 3 427 3 427 2 339 2 490 2 655Child Care – – – – – – – –Aged Care – – – – – – – –O<strong>the</strong>r Community 2 280 2 316 966 – – – – – –O<strong>the</strong>r Social – – 2 774 2 210 1 574 1 574 2 429 2 672 2 939Sport and recreation 1 594 2 029 – 531 531 531 584 642 706Public safety 2 498 2 943 4 070 7 591 6 591 6 591 19 732 21 294 22 985Police 2 001 2 279 3 410 6 976 5 976 5 976 7 673 8 440 9 284Fire 462 661 585 616 616 616 678 745 820Civil Defence 35 3 – – – – – –Street Lighting – – – – 11 382 12 108 12 881O<strong>the</strong>r – – 75 – – – – – –Housing 5 414 4 740 182 913 14 376 14 376 14 376 14 972 15 395 15 842Health 289 282 1 318 318 318 338 359 381Clinics 53 30 – – – – – –Ambulance – – – – – – – –O<strong>the</strong>r 235 252 1 318 318 318 338 359 381E<strong>co</strong>nomic and environmental services 63 586 54 837 6 259 21 523 7 553 7 553 8 275 9 103 10 013Planning and dev elopment 3 724 3 626 5 411 5 373 5 373 5 373 5 910 6 501 7 152E<strong>co</strong>nomic Development/Planning 3 724 3 626 1 628 442 442 442 486 534 588Town Planning/Building – – 3 783 4 932 4 932 4 932 5 425 5 967 6 564Licensing & Regulation – – – – – – – –Road transport 57 648 41 267 783 1 975 1 975 1 975 2 172 2 389 2 628Roads 56 801 40 181 12 1 095 1 095 1 095 1 204 1 325 1 457Public Buses – – – – – – – –Parking Garages 846 980 770 880 880 880 968 1 065 1 171Vehicle Licensing and Testing – – – – – – – –O<strong>the</strong>r 1 106 – – – – – –Env ironmental protection 2 214 9 943 65 14 175 205 205 193 212 234Pollution Control 1 738 8 824 – – – – – –Biodiversity & Landscape – – – – – – – –O<strong>the</strong>r 476 1 119 65 14 175 205 205 193 212 234Trading services 1 687 967 1 776 763 2 463 150 2 719 228 2 990 062 2 990 062 3 458 562 4 063 029 4 499 367Electricity 1 037 152 930 711 1 508 656 1 854 328 2 125 162 2 125 162 2 454 613 2 982 099 3 330 912Electricity Distribution 1 037 152 930 711 1 508 656 1 854 328 2 125 162 2 125 162 2 454 613 2 982 099 3 330 912Electricity Generation – – – – – – – – –Water 404 953 541 421 605 846 610 174 610 174 610 174 668 129 721 088 780 888Water Distribution 404 953 541 421 605 846 610 174 610 174 610 174 668 129 721 088 780 888Water S<strong>to</strong>rage – – – – – – – – –Waste w ater management 241 237 299 125 343 364 134 242 134 242 134 242 145 109 156 857 169 556Sewerage 241 237 299 125 343 364 134 242 134 242 134 242 145 109 156 857 169 556S<strong>to</strong>rm Water Management – – – – – – –Public Toilets – – – – – – –Waste management 4 626 5 506 5 284 120 485 120 485 120 485 190 712 202 985 218 010Solid Waste 4 626 5 506 5 284 120 485 120 485 120 485 190 712 202 985 218 010O<strong>the</strong>r 16 380 17 147 17 674 20 900 18 981 18 981 18 193 20 012 22 013Air Transport 308 343 382 339 339 339 373 410 451Abat<strong>to</strong>irs – – – – – – – –Tourism – – 12 – – – – – –Forestry – – – – – – – –Markets 16 072 16 804 17 280 20 561 18 642 18 642 17 820 19 602 21 562Total Revenue - Standard 2 984 087 3 153 085 4 172 179 4 888 315 5 556 026 5 556 026 6 297 914 7 115 522 7 800 41331


