

to download the PDF for MTREF Budget Write-up ... - Mangaung.co.za
to download the PDF for MTREF Budget Write-up ... - Mangaung.co.za
to download the PDF for MTREF Budget Write-up ... - Mangaung.co.za
- No tags were found...

You also want an ePaper? Increase the reach of your titles
YUMPU automatically turns print PDFs into web optimized ePapers that Google loves.
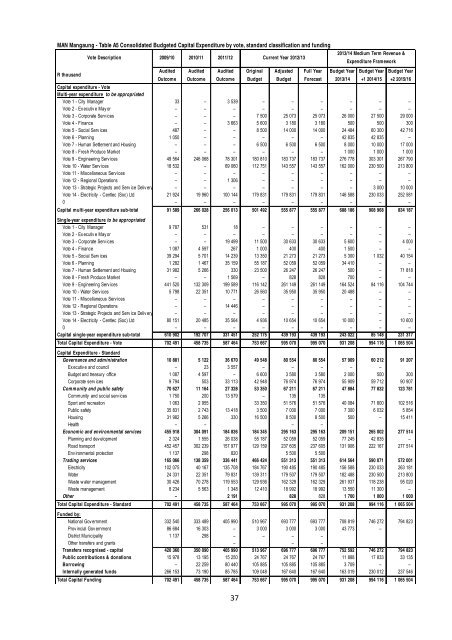
MAN <strong>Mangaung</strong> - Table A5 Consolidated <strong>Budget</strong>ed Capital Expenditure by vote, standard classification and fundingVote Description 2009/10 2010/11 2011/12R thousandAudited Audited Audited Original Adjusted Full Year <strong>Budget</strong> Year <strong>Budget</strong> Year <strong>Budget</strong> YearOut<strong>co</strong>me Out<strong>co</strong>me Out<strong>co</strong>me <strong>Budget</strong> <strong>Budget</strong> Forecast 2013/14 +1 2014/15 +2 2015/16Capital expenditure - VoteMulti-year expenditure <strong>to</strong> be appropriatedVote 1 - City Manager 33 – 3 539 – – – – – –Vote 2 - Ex ecutiv e May or – – – – – – – – –Vote 3 - Corporate Serv ices – – – 7 500 25 073 25 073 26 000 27 500 29 000Vote 4 - Finance – – 3 663 5 600 3 180 3 180 500 500 300Vote 5 - Social Serv ices 487 – – 8 500 14 000 14 000 24 484 60 300 42 716Vote 6 - Planning 1 050 – – – – – 42 835 42 835 –Vote 7 - Human Settlement and Housing – – – 6 500 6 500 6 500 8 000 10 000 17 000Vote 8 - Fresh Produce Market – – – – – – 1 000 1 000 1 000Vote 9 - Engineering Serv ices 49 564 246 068 78 301 180 810 183 737 183 737 276 778 303 301 267 790Vote 10 - Water Serv ices 18 532 – 69 060 112 751 143 557 143 557 162 000 230 500 213 800Vote 11 - Miscellaneous Serv ices – – – – – – – – –Vote 12 - Regional Operations – – 1 306 – – – – – –Vote 13 - Strategic Projects and Serv ice Deliv ery – – – – – – – 3 000 10 000Vote 14 - Electricity - Centlec (Soc) Ltd 21 924 19 960 100 144 179 831 179 831 179 831 146 588 230 033 252 5810 – – – – – – – – –Capital multi-year expenditure sub-<strong>to</strong>tal 91 589 266 028 256 013 501 492 555 877 555 877 688 186 908 968 834 187Single-year expenditure <strong>to</strong> be appropriatedVote 1 - City Manager 9 787 531 18 – – – – – –Vote 2 - Ex ecutiv e May or – – – – – – – – –Vote 3 - Corporate Serv ices – – 19 499 11 500 30 633 30 633 5 600 – 4 000Vote 4 - Finance 1 087 4 597 267 1 000 400 400 1 500 – –Vote 5 - Social Serv ices 39 294 5 701 14 239 13 350 21 273 21 273 5 300 1 032 40 154Vote 6 - Planning 1 282 1 467 35 159 55 187 52 059 52 059 34 410 – –Vote 7 - Human Settlement and Housing 31 982 5 266 330 23 500 26 247 26 247 500 – 71 818Vote 8 - Fresh Produce Market – – 1 569 – 828 828 700 – –Vote 9 - Engineering Serv ices 441 520 132 309 199 589 116 142 261 149 261 149 164 524 84 116 104 744Vote 10 - Water Serv ices 5 798 22 351 10 771 26 560 35 950 35 950 20 488 – –Vote 11 - Miscellaneous Serv ices – – – – – – – – –Vote 12 - Regional Operations – – 14 446 – – – – – –Vote 13 - Strategic Projects and Serv ice Deliv ery – – – – – – – – –Vote 14 - Electricity - Centlec (Soc) Ltd 80 151 20 485 35 564 4 936 10 654 10 654 10 000 – 10 6000 – – – – – – – – –Capital single-year expenditure sub-<strong>to</strong>tal 610 902 192 707 331 451 252 175 439 193 439 193 243 022 85 148 231 317Total Capital Expenditure - Vote 702 491 458 735 587 464 753 667 995 070 995 070 931 208 994 116 1 065 504Capital Expenditure - StandardGovernance and administration 10 881 5 122 36 670 49 548 80 554 80 554 57 909 60 212 91 207Ex ecutiv e and <strong>co</strong>uncil – 23 3 557 – – – – –<strong>Budget</strong> and treasury office 1 087 4 597 – 6 600 3 580 3 580 2 000 500 300Corporate serv ices 9 794 503 33 113 42 948 76 974 76 974 55 909 59 712 90 907Community and public safety 70 627 11 164 27 328 53 350 67 211 67 211 47 884 77 832 123 781Community and social serv ices 1 750 200 13 579 – 135 135Sport and recreation 1 063 2 955 33 350 51 576 51 576 40 084 71 800 102 516Public safety 35 831 2 743 13 418 3 500 7 000 7 000 7 300 6 032 5 854Housing 31 982 5 266 330 16 500 8 500 8 500 500 – 15 411Health – – – –E<strong>co</strong>nomic and environmental services 455 918 304 091 184 836 184 345 295 163 295 163 209 151 265 002 277 514Planning and dev elopment 2 324 1 555 26 038 55 187 52 059 52 059 77 245 42 835 –Road transport 452 457 302 239 157 977 129 159 237 605 237 605 131 906 222 167 277 514Env ironmental protection 1 137 298 820 5 500 5 500Trading services 165 066 138 359 336 441 466 424 551 313 551 313 614 564 590 071 572 001Electricity 102 075 40 167 135 708 184 767 190 485 190 485 156 588 230 033 263 181Water 24 331 22 351 79 831 139 311 179 507 179 507 182 488 230 500 213 800Waste w ater management 30 426 70 278 119 553 129 936 162 329 162 329 261 937 118 238 95 020Waste management 8 234 5 563 1 348 12 410 18 992 18 992 13 550 11 300 –O<strong>the</strong>r – 2 191 828 828 1 700 1 000 1 000Total Capital Expenditure - Standard 702 491 458 735 587 464 753 667 995 070 995 070 931 208 994 116 1 065 504Funded by:National Gov ernment 332 540 333 489 405 990 510 967 693 777 693 777 708 819 746 272 794 823Prov incial Gov ernment 86 684 16 303 – 3 000 3 000 3 000 43 773 –District Municipality 1 137 298 – – – –O<strong>the</strong>r transfers and grants – – –Transfers re<strong>co</strong>gnised - capital 420 360 350 090 405 990 513 967 696 777 696 777 752 592 746 272 794 823Public <strong>co</strong>ntributions & donations 15 978 13 195 15 250 24 767 24 767 24 767 11 888 17 833 33 135Borrowing – 22 259 80 440 105 885 105 885 105 885 3 709 – –Internally generated funds 266 153 73 190 85 785 109 048 167 640 167 640 163 019 230 012 237 546Total Capital Funding 702 491 458 735 587 464 753 667 995 070 995 070 931 208 994 116 1 065 50437Current Year 2012/132013/14 Medium Term Revenue &Expenditure Framework


