- Page 1: Rental HousingAn essential option f
- Page 7 and 8: ContentsPreface ...................
- Page 10 and 11: Table 7. Housing characteristics in
- Page 12: ChonseiCOHREColoniaContingentvaluat
- Page 16 and 17: SlumSocial housingSpontaneoushousin
- Page 18 and 19: xviiiRental housing
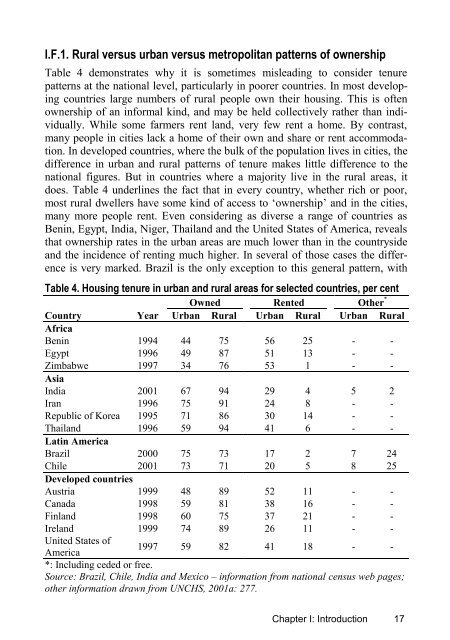
- Page 20 and 21: The time of the large, exploitative
- Page 22 and 23: of developing countries, it may eve
- Page 24 and 25: ecognition and focus on rental hous
- Page 26 and 27: to the land on which it is built. A
- Page 29: In short, the report builds on the
- Page 32: Table 2. Housing tenure for selecte
- Page 41 and 42: Despite this proximate relationship
- Page 43 and 44: One reason is that the cost of land
- Page 45 and 46: 46. Mwangi, 1997: 141.47. Korboe, 1
- Page 47 and 48: II. The nature of the rental housin
- Page 49 and 50: In most developed countries, the va
- Page 51 and 52: Photograph 1: Council housing in Ca
- Page 53 and 54: Photograph 2: Public rental housing
- Page 55 and 56: In the early 1990s, USAID denounced
- Page 57 and 58: Box 1. (continued).obligation to us
- Page 59 and 60: It is most unlikely that these coop
- Page 61 and 62: Photograph 3: Renovated hostel acco
- Page 63 and 64: Photograph 4: Rental housing in one
- Page 65 and 66: But the real exception is Kenya whe
- Page 67 and 68: Photograph 6: Backyard accommodatio
- Page 69 and 70: ments, hotels and pensions”. Simi
- Page 71 and 72: A similar pattern is found in other
- Page 73 and 74: 44. Almarza, 1997; Chiappe de Villa
- Page 75 and 76: III. Landlords, tenants and sharers
- Page 77 and 78: ever, in Soweto, Johannesburg, land
- Page 79 and 80: Contemporary landlords in most poor
- Page 81 and 82: Table 11 provides some support for
- Page 83 and 84:
In the United Kingdom:“private re
- Page 85 and 86:
In Bamako, Mali, 25 per cent of nat
- Page 87 and 88:
“longer-term sharing can also hav
- Page 89 and 90:
Differences in the incidence of sha
- Page 91 and 92:
are unschooled in accounting practi
- Page 93 and 94:
Often renting is only a temporary a
- Page 95 and 96:
43. De Decker, 2001: 27.44. Varady
- Page 97 and 98:
133. Chant and Ward, 1987.134. Gilb
- Page 99 and 100:
IV. Problematic issues in rental ho
- Page 101 and 102:
IV.B. Rent levelsLandlords, and par
- Page 103 and 104:
per cent of their income on rent, w
- Page 105 and 106:
doubt the poor Mexican landlord was
- Page 107 and 108:
In Latin American cities, many poor
- Page 109 and 110:
Figure 2. Service levels and rental
- Page 111 and 112:
egarded by many of the people in th
- Page 113 and 114:
IV.F. Mobility and evictionTenant f
- Page 115 and 116:
comes, owning and renting are not s
- Page 117 and 118:
moved due to strained relations wit
- Page 119 and 120:
Table 12. Landlord-tenant relations
- Page 121 and 122:
Notes1. De Decker, 2001: 35.2. Davi
- Page 123 and 124:
92. Gilbert, 2003; Huchzermeyer, 20
- Page 125 and 126:
V. Public policy: Debunking the myt
- Page 127 and 128:
Other developed countries have actu
- Page 129 and 130:
deserved affluence”. 27 Ownership
- Page 131 and 132:
ility for future tenure options. Th
- Page 133 and 134:
their accommodation” 52 and, in S
- Page 135 and 136:
Kingdom, governments strongly encou
- Page 137 and 138:
families gain from owning a home, t
- Page 139 and 140:
Gradually, however, in most countri
- Page 141:
the police and judiciary to evict t
- Page 144 and 145:
“choice at different stages of th
- Page 146 and 147:
The lesson must be that rules do no
- Page 148 and 149:
course, Netherlands, Germany and Sw
- Page 150 and 151:
45. Rodríguez and Icaza, 1993: 44.
- Page 152 and 153:
136. Saunders, 1990.137. Flood, 200
- Page 154 and 155:
consensus is limited to those eleme
- Page 156 and 157:
of satisfying that promise. Of cour
- Page 158 and 159:
Such a view has been espoused by ma
- Page 160 and 161:
attempts were made to stimulate pri
- Page 162 and 163:
In theory, cooperatives have a majo
- Page 164 and 165:
Box 3. (continued).Buildings will t
- Page 166 and 167:
The recently approved Colombian ren
- Page 168 and 169:
Interest in this kind of approach i
- Page 170 and 171:
epaying a loan to be a burden that
- Page 172 and 173:
Photograph 8: At risk in an earthqu
- Page 174 and 175:
Venezuelan landlords are frightened
- Page 176 and 177:
electrical connections to backyard
- Page 178 and 179:
Where the authorities are prepared
- Page 180 and 181:
medium and long-term, through mutua
- Page 182 and 183:
is sometimes exaggerated and contra
- Page 184 and 185:
“Economists are very critical of
- Page 186 and 187:
more than one-quarter of all househ
- Page 188 and 189:
Colombia, a society that has more t
- Page 190 and 191:
42. Kumar, 2001: 7.43. Kumar, 2001:
- Page 192 and 193:
133. Ramaswamy and Charavarti, 1997
- Page 194 and 195:
“the first priority in redressing
- Page 196 and 197:
national) law. Thus, renewed commit
- Page 198 and 199:
parties - to every landlord-tenant
- Page 200 and 201:
security of tenure would presumably
- Page 202 and 203:
even in the United States of Americ
- Page 204 and 205:
convince some policy makers that al
- Page 206 and 207:
cannot afford adequate housing to i
- Page 208 and 209:
186 Rental housing
- Page 210 and 211:
——, Archer, R.W., Tanphiphat, S
- Page 212 and 213:
Castro, S. Rabello de, (2002), “F
- Page 214 and 215:
Deprés, C., (1993), “A hybrid st
- Page 216 and 217:
Secure land tenure for the urban po
- Page 218 and 219:
Green, G., (1988), “The quest for
- Page 220 and 221:
IYSH (International Year of Shelter
- Page 222 and 223:
——, (1990), “The state and ho
- Page 224 and 225:
Mugo, P.N., (2000), “An analysis
- Page 226 and 227:
Pugh, C., (1987), “Housing in Sin
- Page 228 and 229:
Skinner, R.J., Taylor, J.L. and Weg
- Page 230 and 231:
——, (1997), The Istanbul Declar
- Page 232 and 233:
Varley, A., (1987), “The relation
- Page 234 and 235:
212 Rental housing
- Page 236 and 237:
to be spent on maintenance; overcro
- Page 238 and 239:
The neglect of rental housingSome a
- Page 240 and 241:
1999 was intended to provide a nati
- Page 242 and 243:
1,700 units. Two more projects in B
- Page 244 and 245:
demonstrated that one-quarter of So
- Page 246 and 247:
224 Rental housing
- Page 248 and 249:
work. Housing production would incr
- Page 250 and 251:
most cases to go to court. In those
- Page 252 and 253:
230 Rental housing
- Page 254 and 255:
Apart from the doubts of bankers an
- Page 256 and 257:
234 Rental housing
- Page 258 and 259:
Most landlords seek possession beca
- Page 260 and 261:
fuel, education, health care, adequ
- Page 262 and 263:
240 Rental housing
- Page 264 and 265:
Box 6. Family housing in Bamako, Ma
- Page 266 and 267:
investing in certain kinds of prope
- Page 268 and 269:
246 Rental housing
- Page 270 and 271:
concerned citizen of his community.
- Page 272 and 273:
estate markets for African American