A computationally efficient multipitch analysis model ... - IEEE Xplore
A computationally efficient multipitch analysis model ... - IEEE Xplore
A computationally efficient multipitch analysis model ... - IEEE Xplore

Create successful ePaper yourself
Turn your PDF publications into a flip-book with our unique Google optimized e-Paper software.
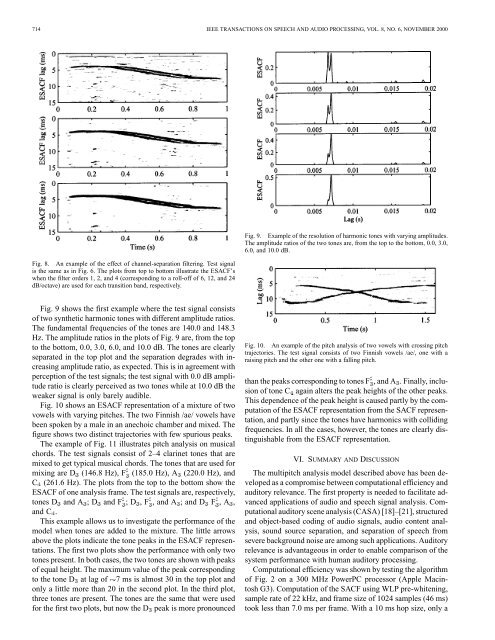
714 <strong>IEEE</strong> TRANSACTIONS ON SPEECH AND AUDIO PROCESSING, VOL. 8, NO. 6, NOVEMBER 2000Fig. 8. An example of the effect of channel-separation filtering. Test signalis the same as in Fig. 6. The plots from top to bottom illustrate the ESACF’swhen the filter orders 1, 2, and 4 (corresponding to a roll-off of 6, 12, and 24dB/octave) are used for each transition band, respectively.Fig. 9. Example of the resolution of harmonic tones with varying amplitudes.The amplitude ratios of the two tones are, from the top to the bottom, 0.0, 3.0,6.0, and 10.0 dB.Fig. 9 shows the first example where the test signal consistsof two synthetic harmonic tones with different amplitude ratios.The fundamental frequencies of the tones are 140.0 and 148.3Hz. The amplitude ratios in the plots of Fig. 9 are, from the topto the bottom, 0.0, 3.0, 6.0, and 10.0 dB. The tones are clearlyseparated in the top plot and the separation degrades with increasingamplitude ratio, as expected. This is in agreement withperception of the test signals; the test signal with 0.0 dB amplituderatio is clearly perceived as two tones while at 10.0 dB theweaker signal is only barely audible.Fig. 10 shows an ESACF representation of a mixture of twovowels with varying pitches. The two Finnish /ae/ vowels havebeen spoken by a male in an anechoic chamber and mixed. Thefigure shows two distinct trajectories with few spurious peaks.The example of Fig. 11 illustrates pitch <strong>analysis</strong> on musicalchords. The test signals consist of 2–4 clarinet tones that aremixed to get typical musical chords. The tones that are used formixing are D (146.8 Hz), F (185.0 Hz), A (220.0 Hz), andC (261.6 Hz). The plots from the top to the bottom show theESACF of one <strong>analysis</strong> frame. The test signals are, respectively,tones D and A ;D and F ;D ,F , and A ; and D F ,A ,and C .This example allows us to investigate the performance of the<strong>model</strong> when tones are added to the mixture. The little arrowsabove the plots indicate the tone peaks in the ESACF representations.The first two plots show the performance with only twotones present. In both cases, the two tones are shown with peaksof equal height. The maximum value of the peak correspondingto the tone D at lag of 7 ms is almost 30 in the top plot andonly a little more than 20 in the second plot. In the third plot,three tones are present. The tones are the same that were usedfor the first two plots, but now the D peak is more pronouncedFig. 10. An example of the pitch <strong>analysis</strong> of two vowels with crossing pitchtrajectories. The test signal consists of two Finnish vowels /ae/, one with araising pitch and the other one with a falling pitch.than the peaks corresponding to tones F , and A . Finally, inclusionof tone C again alters the peak heights of the other peaks.This dependence of the peak height is caused partly by the computationof the ESACF representation from the SACF representation,and partly since the tones have harmonics with collidingfrequencies. In all the cases, however, the tones are clearly distinguishablefrom the ESACF representation.VI. SUMMARY AND DISCUSSIONThe <strong>multipitch</strong> <strong>analysis</strong> <strong>model</strong> described above has been developedas a compromise between computational efficiency andauditory relevance. The first property is needed to facilitate advancedapplications of audio and speech signal <strong>analysis</strong>. Computationalauditory scene <strong>analysis</strong> (CASA) [18]–[21], structuredand object-based coding of audio signals, audio content <strong>analysis</strong>,sound source separation, and separation of speech fromsevere background noise are among such applications. Auditoryrelevance is advantageous in order to enable comparison of thesystem performance with human auditory processing.Computational efficiency was shown by testing the algorithmof Fig. 2 on a 300 MHz PowerPC processor (Apple MacintoshG3). Computation of the SACF using WLP pre-whitening,sample rate of 22 kHz, and frame size of 1024 samples (46 ms)took less than 7.0 ms per frame. With a 10 ms hop size, only a