A computationally efficient multipitch analysis model ... - IEEE Xplore
A computationally efficient multipitch analysis model ... - IEEE Xplore
A computationally efficient multipitch analysis model ... - IEEE Xplore

You also want an ePaper? Increase the reach of your titles
YUMPU automatically turns print PDFs into web optimized ePapers that Google loves.
708 <strong>IEEE</strong> TRANSACTIONS ON SPEECH AND AUDIO PROCESSING, VOL. 8, NO. 6, NOVEMBER 2000A Computationally Efficient MultipitchAnalysis ModelTero Tolonen, Student Member, <strong>IEEE</strong>, and Matti Karjalainen, Member, <strong>IEEE</strong>Abstract—A <strong>computationally</strong> <strong>efficient</strong> <strong>model</strong> for <strong>multipitch</strong>and periodicity <strong>analysis</strong> of complex audio signals is presented.The <strong>model</strong> essentially divides the signal into two channels, belowand above 1000 Hz, computes a “generalized” autocorrelation ofthe low-channel signal and of the envelope of the high-channelsignal, and sums the autocorrelation functions. The summaryautocorrelation function (SACF) is further processed to obtain anenhanced SACF (ESACF). The SACF and ESACF representationsare used in observing the periodicities of the signal.The <strong>model</strong> performance is demonstrated to be comparable tothose of recent time-domain <strong>model</strong>s that apply a multichannel<strong>analysis</strong>. In contrast to the multichannel <strong>model</strong>s, the proposedpitch <strong>analysis</strong> <strong>model</strong> can be run in real time using typical personalcomputers. The parameters of the <strong>model</strong> are experimentallytuned for best <strong>multipitch</strong> discrimination with typical mixtures ofcomplex tones.The proposed pitch <strong>analysis</strong> <strong>model</strong> may be used in complexaudio signal processing applications, such as sound sourceseparation, computational auditory scene <strong>analysis</strong>, and structuralrepresentation of audio signals. The performance of the<strong>model</strong> is demonstrated by pitch <strong>analysis</strong> examples using soundmixtures which are available for download at http://www.acoustics.hut.fi/~ttolonen/pitchAnalysis/.Index Terms—Auditory <strong>model</strong>ing, <strong>multipitch</strong> <strong>analysis</strong>, periodicity<strong>analysis</strong>, pitch perception.I. INTRODUCTIONMANY principles have been proposed for the <strong>model</strong>ingof human pitch perception and for practical pitch determinationof simple audio or speech signals [1]–[3]. For regularsignals with harmonic structure, such as clean speech ofa single speaker, the problem is solved quite reliably. When thecomplexity increases further, e.g., when harmonic complexes ofsounds or voices are mixed in a single signal channel, the determinationof pitches is generally a difficult problem that has notbeen solved satisfactorily.Computational algorithms for <strong>multipitch</strong> identification, forinstance, in automatic transcription of polyphonic music, havebeen around for over 20 years. The first systems had typicallysubstantial limitations on the content, and they were only ableto detect up to two simultaneous harmonic tones [4]–[9]. Themore recent systems have advanced in performance [10]–[14]Manuscript received January 18, 1999; revised December 27, 1999. Thiswork was supported by the GETA Graduate School, Helsinki Universityof Technology, the Foundation of Jenny and Antti Wihuri (Jenny ja AnttiWihurin rahasto), Tekniikan edistämissäätiö, and Nokia Research Center. Theassociate editor coordinating the review of this manuscript and approving it forpublication was Dr. Dennis R. Morgan.The authors are with Laboratory of Acoustics and Audio Signal Processing,Helsinki University of Technology, FIN-02015 Espoo, Finland.Publisher Item Identifier S 1063-6676(00)09259-2.allowing more simultaneous tones to be detected with greateraccuracy.The concept of pitch [15] refers to auditory perception andhas a complex relationship to physical properties of a signal.Thus, it is natural to distinguish it from the estimation offundamental frequency and to apply methods that simulatehuman perception. Many such approaches have been proposedand they generally follow one of two paradigms: place (orfrequency) theory and timing (or periodicity) theory. Neitherof these in pure form has been proven to show full compatibilitywith human pitch perception and it is probable that acombination of the two approaches is needed. Recently it hasbeen demonstrated that a peripheral auditory <strong>model</strong> that usestime-domain processing of periodicity properties shows abilityto simulate many known features of pitch perception which areoften considered to be more central [16], [17]. Such <strong>model</strong>sare attractive since auditory processes may be simulated withrelatively straightforward digital signal processing (DSP)algorithms. Additional features may be readily included using,e.g., frequency domain algorithms if desired.The unitary pitch <strong>analysis</strong> <strong>model</strong> of Meddis and O’Mard[16] and its predecessors by Meddis and Hewitt [17] are amongthe best known recent <strong>model</strong>s of time-domain pitch <strong>analysis</strong>.The unitary <strong>model</strong> is shown to exhibit qualitatively good correspondenceto human perception in many listening tasks such asmissing fundamental, musical chords, etc. A practical problemwith the <strong>model</strong> is that, despite of its quite straightforwardprinciple, the overall algorithm is <strong>computationally</strong> expensivesince the <strong>analysis</strong> is carried out using a multichannel auditoryfilterbank.In this paper we present a <strong>multipitch</strong> <strong>analysis</strong> <strong>model</strong> that is<strong>computationally</strong> <strong>efficient</strong>. While it does not attempt to simulatethe human auditory system in detail, it is still intuitive fromthe auditory <strong>model</strong>ing viewpoint. Our pitch 1 <strong>analysis</strong> <strong>model</strong>finds applications in complex audio signal processing tasks,such as sound source separation, computational auditory scene<strong>analysis</strong> [18]–[21], structural representation of audio signals,and content <strong>analysis</strong> techniques. The proposed <strong>model</strong> is, to acertain extent, a <strong>computationally</strong> superior simplification of theMeddis and O’Mard <strong>model</strong> which has very similar behavior,as will be demonstrated below. Additional features will beproposed in order to allow for further <strong>analysis</strong> of <strong>multipitch</strong>signals, such as musical chords and speech mixtures. The performanceof the <strong>model</strong> is demonstrated by periodicity <strong>analysis</strong>examples using sound mixtures available at http://www.acoustics.hut.fi/~ttolonen/pitchAnalysis/.1 Following a common practice, we use term pitch even when fundamentalperiod or pitch period could be more precise concepts.1063–6676/00$10.00 © 2000 <strong>IEEE</strong>
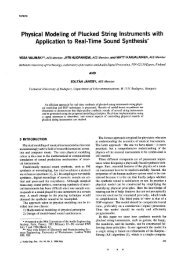
TOLONEN AND KARJALAINEN: COMPUTATIONALLY EFFICIENT MULTIPITCH ANALYSIS MODEL 709Fig. 1. Block diagram of the Meddis–O’Mard <strong>model</strong> [17].The paper is organized as follows. In Section II, the proposedpitch <strong>analysis</strong> <strong>model</strong> is introduced and compared to pitch perception<strong>model</strong>s reported in the literature. Section III describeshow the periodicity representation can be enhanced so that periodicitiesmay be more easily investigated. Section IV discussesthe <strong>model</strong> parameters and shows with examples how they affectthe behavior of the <strong>model</strong>, and Section V demonstrates the<strong>model</strong> performance in <strong>multipitch</strong> determination. Finally, SectionVI concludes the paper with a summary and discussion.II. PITCH ANALYSIS MODELA. Multichannel Pitch AnalysisIn many recent <strong>model</strong>s of human perception, the key componentis a filterbank that simulates the behavior of the cochlea.The filterbank separates a sound signal into subband channelsthat have bandwidths corresponding to the frequency resolutionof the cochlea. A common choice is to use a gammatone filterbank[22] with channels corresponding to the equivalent rectangularbandwidth (ERB) channels of human audition [23].Fig. 1 depicts the pitch perception <strong>model</strong> of Meddis andO’Mard [17] that uses the filterbank approach. The inputsignal is first divided into 40–128 channels depending on theimplementation [16], [17], [21]. The signal in each channel ishalf-wave rectified and lowpass filtered. Essentially, this stepcorresponds to the detection of the envelope of the signal ineach channel. From the envelope signals, a periodicity measure,such as the autocorrelation function (ACF), is computedwithin each channel. Finally, the ACFs are summed across thechannels to yield a summary autocorrelation function (SAFC)that is used in pitch <strong>analysis</strong>.In studies that have applied the pitch <strong>analysis</strong> paradigm ofFig. 1, several implementations are reported. In some systems,pre-processing of the signal is performed before the signalenters the filterbank. For instance, in [17] a bandpass filter isused for simulating the middle ear transfer function. In [17] thehalf-wave rectification and lowpass filtering block is replacedwith a block that estimates the probability of neural activationin each channel. In [24], an automatic gain control block isadded after the half-wave rectification and the lowpass filteringis removed.There are several approaches for computation of the autocorrelationor a similar periodicity measure within each of the channels.The time domain approach is a common choice [16], [17],[21]. In these systems, an exponential window is applied witha window time constant that varies from 2.5 ms [17] to 25 ms[21]. Our experiments have determined that the effective lengthof the window should be approximately 10–30 ms so that thewindow spans more than one period of the pitched tone with allfundamental periods that are in the range of interest. Ellis [21]applies a logarithmic scale of the autocorrelation lag with approximately48 samples for each octave. He motivates the useof such a scale by better resemblance with the pitch detectionresolution of the human auditory system. This requires interpolationof the signals in the channels. Ellis notes that half-waverectification is preferred over full-wave rectification in order tosuppress octave errors.Some of the pitch <strong>analysis</strong> systems prefer to use a discreteFourier transform (DFT) based autocorrelation computation forcomputational efficiency [24]. This approach also allows forprocessing of the signal in the frequency-domain. As discussedbelow, nonlinear compression of the DFT magnitude may beused to enhance the performance of the pitch <strong>analysis</strong>. Sucha compression is not readily implementable in a time-domainsystem.Although the unitary pitch perception <strong>model</strong> of Meddis andO’Mard has been widely adopted, some studies question thegeneral validity of the unitary pitch perception paradigm. Particularly,it has been suggested that two mechanisms for pitchperception are required: one for resolved harmonics and one forunresolved harmonics [25], [26]. The term resolved harmonicsrefers to the case when only one or no components fall within the10-dB-down bandwidth of an auditory filter [27]. In the othercase, the components are said to be unresolved. The presentstudy does not attempt to answer the question on the pitch detectionmechanism of the human auditory system. In fact, theproposed <strong>model</strong> has only two channels and does not attempt directlyto follow human resolvability. Interestingly enough, asshown in the following subsection, the <strong>model</strong> still qualitativelyproduces similar and comparable results to those of the moreelaborate multichannel pitch <strong>analysis</strong> systems.The computational demands of multichannel pitch <strong>analysis</strong>systems have prohibited their use in practical applications wheretypically real-time performance is required. The computationalrequirements are mostly determined by the number of channelsused in the filterbank. This motivates the development of a simplified<strong>model</strong> of pitch perception presented below that is moresuitable in practical applications and still qualitatively retainsthe performance of multichannel systems.B. Two-Channel Pitch AnalysisA block diagram of the proposed two-channel pitch <strong>analysis</strong><strong>model</strong> is illustrated in Fig. 2. The first block is a pre-whiteningfilter that is used to remove short-time correlation of thesignal. The whitening filter is implemented using warped linearprediction (WLP) as described in [28]. The WLP techniqueworks as ordinary linear prediction except that it implementscritical-band auditory resolution of spectral <strong>model</strong>ing insteadof uniform frequency resolution, and can be used to reduce the
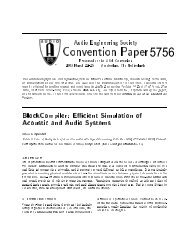
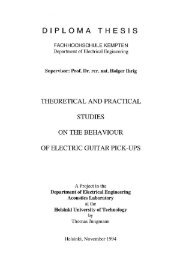
710 <strong>IEEE</strong> TRANSACTIONS ON SPEECH AND AUDIO PROCESSING, VOL. 8, NO. 6, NOVEMBER 2000Fig. 2.Block diagram of the proposed pitch <strong>analysis</strong> <strong>model</strong>.Fig. 3. Comparison of the SACF functions of the two <strong>model</strong>s using the“musical chord” test signal. The two-channel SACF is plotted on the top andthe Meddis–Hewitt SACF on the bottom.filter order considerably. A WLP filter of 12th order is used herewith sampling rate of 22 kHz, Hamming windowing, framesize of 23.2 ms, and hop size of 10.0 ms. Inverse filtering withthe WLP <strong>model</strong> yields the pre-whitened signal. To a certainextent, the whitening filter may be interpreted as functionallysimilar to the normalization of the hair cell activity level towardspectral flattening due to the adaptation and saturation effects[29], [30].The functionality of the middle part of Fig. 2 corresponds tothat of the unitary multichannel pitch <strong>analysis</strong> <strong>model</strong> of Fig. 1.The signal is separated into two channels, below and above 1kHz. The channel separation is done with filters that have 12dB/octave attenuation in the stop-band. The lowpass block alsoincludes a highpass rolloff with 12 dB/octave below 70 Hz. Thehigh-channel signal is half-wave rectified and lowpass filteredwith a similar filter (including the highpass characteristic at 70Hz) to that used for separating the low channel.The periodicity detection is based on “generalized autocorrelation,”i.e., the computation consists of a discrete Fourier transform(DFT), magnitude compression of the spectral representation,and an inverse transform (IDFT). The signal in Fig. 2corresponds to the SAFC of Fig. 1 and is obtained aswhere and are the low and high channel signals beforethe periodicity detection blocks in Fig. 2. The parameterdetermines the frequency domain compression [31]. For normalautocorrelation but, as detailed in Section IV, it is advantageousto use a value smaller than 2. Note that periodicitycomputation using the DFT allows the control of the parameteror the use of some other nonlinear processing of the frequencytransform, e.g, application of natural logarithm resulting in thecepstrum. This is not directly possible with time-domain periodicitydetection algorithms. The fast Fourier transform (FFT) andits inverse (IFFT) are typically used to speed the computation ofthe transforms. The last block of Fig. 2 presents the processingof the SACF (denoted ). This part of the algorithm is detailedin Section III.Before comparing the performance of the <strong>model</strong>s of Figs. 1and 2, it is instructive to study the sensitivity to the phase propertiesof the signal in pitch <strong>analysis</strong> when using a multichannel<strong>model</strong> or a two-channel <strong>model</strong>. In the two-channel case, the lowchannel is phase-insensitive (except for the windowing effects)(1)due to the autocorrelation [notice the modulus in (1)]. However,the high channel is phase-sensitive since it follows the amplitudeenvelope of a signal in the frequency band above 1000 Hz. Thus,all phase-sensitivity in our <strong>model</strong> is inherently caused by thehigh channel. This is different from the Meddis–Hewitt <strong>model</strong>where all channels are phase-sensitive since they follow the envelopeof the signal in the corresponding frequency band. However,when lower channels resolve the harmonics, the differenceis relatively small since in that case the autocorrelation computationremoves the phase-sensitivity.C. Comparison of Multichannel and Two-Channel ModelsThe performance and validity of the proposed two-channelSACF <strong>model</strong> (without pre-filtering and pre-whitening, usingrunning autocorrelation similar to [17]) in pitch periodicity <strong>analysis</strong>is evaluated here by a comparison with the multichannelSACF <strong>model</strong> of Meddis and Hewitt. The AIM software [32]was used to compute the Meddis–Hewitt SACFs. The test signalswere chosen according to [17].The results of the “musical chord” experiment [17] with thetwo-channel and the multichannel <strong>model</strong>s are illustrated on thetop and the bottom plots of Fig. 3, respectively. In this case, thetest signal consisted of three harmonic signals with fundamentalfrequencies 392.0, 523.2, and 659.2 Hz corresponding to tonesG ,C , and E , respectively. The G tone consisted of first fourharmonics, and the C and E tones contained the first threeharmonics each. All the harmonic components were of equalamplitude. Both <strong>model</strong>s exhibit an SACF peak at a lag of 7.7 ms.This corresponds to a frequency of 130 Hz (tone C ), which isthe root tone of the chord. The waveforms of the two summaryautocorrelation functions are similar although the scales differ.While it is only possible to report this experiment here,the <strong>model</strong>s behave similarly with a broader range of testsignals. More examples of SACF <strong>analysis</strong> are available athttp://www.acoustics.hut.fi/~ttolonen/pitchAnalysis/.III. ENHANCING THE SUMMARY AUTOCORRELATIONFUNCTIONThe peaks in the SACF curve produced as output of the<strong>model</strong> in Fig. 2 are relatively good indicators of potential pitchperiods in the signal being analyzed as shown in Fig. 3. However,such a summary periodicity function contains much redundantand spurious information that makes it difficult to estimate
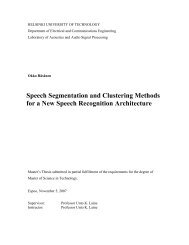
TOLONEN AND KARJALAINEN: COMPUTATIONALLY EFFICIENT MULTIPITCH ANALYSIS MODEL 711TABLE ISUGGESTED PARAMETER VALUES FOR THE PROPOSED TWO-CHANNEL MODELFig. 4. An example of <strong>multipitch</strong> <strong>analysis</strong>. A test signal with three clarinettones with fundamental frequencies 147, 185, and 220 Hz, and relative rmsvalues of 0.4236, 0.7844, and 1, respectively, was analyzed. Top: two-channelSACF, bottom: two-channel ESACF.which peaks are true pitch peaks. For instance, the autocorrelationfunction generates peaks at all integer multiples of the fundamentalperiod. Furthermore, in case of musical chords the roottone often appears very strong though in most cases it should notbe considered as the fundamental period of any source sound.To be more selective, a peak pruning technique similar to [21],but <strong>computationally</strong> more straightforward, is used in our <strong>model</strong>.The technique is the following. The original SACF curve, asdemonstrated above, is first clipped to positive values and thentime-scaled (expanded in time) by a factor of two and subtractedfrom the original clipped SACF function, and again the result isclippedtohavepositivevaluesonly.Thisremovesrepetitivepeakswith double the time lag where the basic peak is higher than theduplicate. It also removes the near-zero time lag part of the SACFcurve. This operation can be repeated for time lag scaling withfactorsofthree,four,five, etc.,asfarasdesired,inordertoremovehighermultiplesofeachpeak.Theresultingfunctioniscalledherethe enhanced summary autocorrelation (ESACF).An illustrative example of the enhanced SACF <strong>analysis</strong> isshown in Fig. 4 for a signal consisting of three clarinet tones.The fundamental frequencies of the tones are 147, 185, and 220Hz. The SACF is depicted on the top and the enhanced SACFcurve on the bottom, showing clear indication of the three fundamentalperiodicities and no other peaks. We have experimentedwith different musical chords and source instrument sounds. Inmost cases, sound combinations of two to three sources are resolvedquite easily if the amplitude levels of the sources are nottoo different. For chords with four or more sources, the subsignalseasily mask each other so that some of the sources are notresolved reliably. One further idea to improve the pitch resolutionwith complex mixtures, especially with relatively differentamplitudes, is to use an iterative algorithm, whereby the mostprominent sounds are first detected and filtered out (see SectionVI) or attenuated properly, and then the pitch <strong>analysis</strong> isrepeated for the residual.IV. MODEL PARAMETERSThe <strong>model</strong> of Fig. 2 has several parameters that affect thebehavior of pitch <strong>analysis</strong>. In the following, we show with examplesthe effect of each parameter on the SACF and ESACFrepresentations. In most cases, it is difficult to obtain the correctvalue for a parameter from the theory of human perception.Rather, we attempt to obtain <strong>model</strong> performance that is similarto that of the human perception or approximately optimal basedon visual inspection of <strong>analysis</strong> results. The suggested parametervalues are collected in Table I.In the following section, there are two types of illustrations.In Figs. 5 and 7, the SACFs of one frame of the signal are plottedon the top, and one or two ESACF’s that correspond to the parametervalues that we found best suited are depicted on thebottom. In Figs. 6 and 8, consecutive ESACFs are illustrated asa function of time. This representation is somewhat similar tothe spectrogram: time is shown on the horizontal axis, ESACFlag on the vertical axis, and the gray level of a point correspondsto the value of the ESACF. Test signals are mixtures of syntheticharmonic tones, noise, and speech signals. Each synthetic tonehas the amplitude of the first harmonic equal to 1.0, and theamplitude of the th harmonic equal to . The initial phasesof the harmonics are 0. The noise that is added in some examplesis white Gaussian noise. In this work, we have used speechsamples that have been recorded in an anechoic chamber and innormal office conditions. The sampling rate of all the examplesis 22 050 Hz.A. Compression of Magnitude in Transform DomainIn Section II we motivated the use of transform-domain computationof the “generalized autocorrelation” by two considerations:1) it allows nonlinear compression of the spectral representationand 2) it is <strong>computationally</strong> more <strong>efficient</strong>. The followingexamples concentrate on magnitude compression andsuggest that the normal autocorrelation function ( ) is suboptimalfor our periodicity detection <strong>model</strong>. Exponential compressionis easily available by adjusting parameter in (1).While we only consider exponential compression in thiscontext, other nonlinear functions may be applied as well. Acommon choice in the speech processing community is to usethe natural logarithm, which results in the cepstrum. Nonlinearcompression in the transform domain has been studied in thecontext of pitch <strong>analysis</strong> of speech signals [31]. In that study,the periodicity measure was computed using the widebandsignal directly without dividing into channels. It was reportedthat the compression parameter gave the best results.It was also shown that pre-whitening of the signal spectrumshowed a tendency of improving the pitch <strong>analysis</strong> accuracy.Fig. 5 illustrates the effect of magnitude compression to theSACF. The upper four plots depict the SACF’s that are obtainedusing , , , and , whereas thebottom plot shows the ESACF that is obtained from the SACFwith . A Hamming window of 1024 samples (46.4 mswith a sampling frequency of 22 050 Hz) is used.The test signal consists of two synthetic harmonic toneswith fundamental frequencies 140.0 and 148.3 Hz and whiteGaussian noise with signal-to-noise ratio (SNR) of 2.2 dB. Thefundamental frequencies of the harmonic tones are separated
712 <strong>IEEE</strong> TRANSACTIONS ON SPEECH AND AUDIO PROCESSING, VOL. 8, NO. 6, NOVEMBER 2000Fig. 5.An example of magnitude compression. Test signal consists of twoharmonic tones with added Gaussian white noise (SNR is 2.2 dB). The firstfour plots from the top illustrate the SACF computed with k = 0:2, k =0:67,k =1:0, and k =2:0, respectively. The bottom plot depicts the ESACFcorresponding to the second plot with k =0:67.by one semitone. The two tones are identifiable by listening tothe signal, although the task is much more involved than withthe signal without the additive noise (see the examples at theWWW). The example shows that the SACF peaks get broaderas the value of increases. However, the performance withlow values of is compromised by sensitivity to noise, as seenby the number and level of the spurious peaks in the top plot.According to this example, is a good compromisebetween lag-domain resolution and sensitivity to noise.While we prefer the use of , in some <strong>computationally</strong>critical applications it may be useful to use if optimizedroutines are available for the square-root operation but not forthe cubic-root operation. It is interesting to compare exponentialcompression to the cepstrum where logarithmic compressionis used. Cepstral <strong>analysis</strong> typically results in higher lag-domainresolution than exponential compression with ,butit may be problematic with signals with low amplitude levels,since the natural logarithm approaches as the signal amplitudeapproaches 0 [31].B. Time-Domain WindowingThe choice of the time-domain window in correlation computationaffects the temporal resolution of the method and alsosets a lower bound to the lag range. The shape of the windowfunction determines the leakage of energy in the spectral domain.It also determines the effective length of the window thatcorresponds to the width of the main lobe of the window inthe spectral domain. We have applied a Hamming window inour pitch <strong>analysis</strong> <strong>model</strong>, although other tapered windows mayFig. 6. An example of the effect of the window length. Test signal consistsof the Finnish vowel /a/ spoken by a male. The pitch of the vowel is falling.The signal is added onto itself after a delay of 91 ms. Plots from top to bottomillustrate the ESACF computed with window length 23.2, 46.4, 92.9, and 185.8ms, respectively.be used as well. For stationary signals, increasing the windowlength reduces the variance of the spectral representation. However,the sound signals typically encountered in pitch <strong>analysis</strong>are far from stationary and a long window is bound to degradethe performance when the pitch is changing. Fig. 6 illustratesthis trade-off.Consecutive frames of ESACF’s computed on the test signalare plotted in a spectrogram-like fashion in Fig. 6. The darkera point is in the figure, the higher is the value of the ESACF.The test signal consists of Finnish vowel /a/ spoken by a male.The pitch of the vowel is falling. The vowel signal is addedonto itself after a delay of 91 ms. Listening to the signal revealsthat the human auditory system is easily able to distinguish twovowels with falling pitches. The value of the hop size parameteris 10 ms, i.e., consecutive frames are separated in time by 10ms. The Hamming window lengths of the <strong>analysis</strong> are, from thetop to the bottom, 23.2, 46.4, 92.9, and 185.8 ms. The two plotson the top of Fig. 6 exhibit two distinct pitch trajectories, asdesired. However, as the window length is increased, the twotrajectories are merged into one broader trajectory, as shownin the two bottom plots. Clearly, the two cases on the top arepreferred over the two on the bottom.When the two top plots of Fig. 6 are compared, it is noticedthat the one using a shorter window exhibits more undesiredpeaks in the ESACF. As expected, the use of a longerwindow reduces the artifacts that correspond to noise and other
714 <strong>IEEE</strong> TRANSACTIONS ON SPEECH AND AUDIO PROCESSING, VOL. 8, NO. 6, NOVEMBER 2000Fig. 8. An example of the effect of channel-separation filtering. Test signalis the same as in Fig. 6. The plots from top to bottom illustrate the ESACF’swhen the filter orders 1, 2, and 4 (corresponding to a roll-off of 6, 12, and 24dB/octave) are used for each transition band, respectively.Fig. 9. Example of the resolution of harmonic tones with varying amplitudes.The amplitude ratios of the two tones are, from the top to the bottom, 0.0, 3.0,6.0, and 10.0 dB.Fig. 9 shows the first example where the test signal consistsof two synthetic harmonic tones with different amplitude ratios.The fundamental frequencies of the tones are 140.0 and 148.3Hz. The amplitude ratios in the plots of Fig. 9 are, from the topto the bottom, 0.0, 3.0, 6.0, and 10.0 dB. The tones are clearlyseparated in the top plot and the separation degrades with increasingamplitude ratio, as expected. This is in agreement withperception of the test signals; the test signal with 0.0 dB amplituderatio is clearly perceived as two tones while at 10.0 dB theweaker signal is only barely audible.Fig. 10 shows an ESACF representation of a mixture of twovowels with varying pitches. The two Finnish /ae/ vowels havebeen spoken by a male in an anechoic chamber and mixed. Thefigure shows two distinct trajectories with few spurious peaks.The example of Fig. 11 illustrates pitch <strong>analysis</strong> on musicalchords. The test signals consist of 2–4 clarinet tones that aremixed to get typical musical chords. The tones that are used formixing are D (146.8 Hz), F (185.0 Hz), A (220.0 Hz), andC (261.6 Hz). The plots from the top to the bottom show theESACF of one <strong>analysis</strong> frame. The test signals are, respectively,tones D and A ;D and F ;D ,F , and A ; and D F ,A ,and C .This example allows us to investigate the performance of the<strong>model</strong> when tones are added to the mixture. The little arrowsabove the plots indicate the tone peaks in the ESACF representations.The first two plots show the performance with only twotones present. In both cases, the two tones are shown with peaksof equal height. The maximum value of the peak correspondingto the tone D at lag of 7 ms is almost 30 in the top plot andonly a little more than 20 in the second plot. In the third plot,three tones are present. The tones are the same that were usedfor the first two plots, but now the D peak is more pronouncedFig. 10. An example of the pitch <strong>analysis</strong> of two vowels with crossing pitchtrajectories. The test signal consists of two Finnish vowels /ae/, one with araising pitch and the other one with a falling pitch.than the peaks corresponding to tones F , and A . Finally, inclusionof tone C again alters the peak heights of the other peaks.This dependence of the peak height is caused partly by the computationof the ESACF representation from the SACF representation,and partly since the tones have harmonics with collidingfrequencies. In all the cases, however, the tones are clearly distinguishablefrom the ESACF representation.VI. SUMMARY AND DISCUSSIONThe <strong>multipitch</strong> <strong>analysis</strong> <strong>model</strong> described above has been developedas a compromise between computational efficiency andauditory relevance. The first property is needed to facilitate advancedapplications of audio and speech signal <strong>analysis</strong>. Computationalauditory scene <strong>analysis</strong> (CASA) [18]–[21], structuredand object-based coding of audio signals, audio content <strong>analysis</strong>,sound source separation, and separation of speech fromsevere background noise are among such applications. Auditoryrelevance is advantageous in order to enable comparison of thesystem performance with human auditory processing.Computational efficiency was shown by testing the algorithmof Fig. 2 on a 300 MHz PowerPC processor (Apple MacintoshG3). Computation of the SACF using WLP pre-whitening,sample rate of 22 kHz, and frame size of 1024 samples (46 ms)took less than 7.0 ms per frame. With a 10 ms hop size, only a
TOLONEN AND KARJALAINEN: COMPUTATIONALLY EFFICIENT MULTIPITCH ANALYSIS MODEL 715Fig. 11. Example of pitch <strong>analysis</strong> of musical chords with clarinet tones. Theplots show ESACF’s of signals consisting of tones D and A (top plot); D andF (second plot); D ,F , and A (third plot); and D F ,A , and C (bottomplot).part of processor’s capacity is used in real-time pitch <strong>analysis</strong>.A multichannel <strong>model</strong> with correlation in each channel couldnot be implemented as real-time <strong>analysis</strong> using current generalpurpose processors.Although the auditory analogy of the <strong>model</strong> is not very strong,it shows some features that make it easier to interpret <strong>analysis</strong>results from the point of view of human pitch perception. Thepre-whitening of the input signal, often considered useful inpitch <strong>analysis</strong>, may be seen to have minor resemblance to spectralcompression in the auditory nerve.The division of the audio frequency range into two subranges,below and above about 1 kHz, is a kind of minimum division torealize direct time synchrony of neural firings at low frequenciesand envelope-based synchrony at high frequencies. Notethat the <strong>model</strong> is a periodicity analyzer that does not implementspectral pitch <strong>analysis</strong>, which is needed especially if the fundamentalfrequency of the input signal exceeds the synchrony limitfrequency of about 1 kHz. In this study we focused on the pitch<strong>analysis</strong> of low-to-mid fundamental frequencies and did not tryto include spectral pitch <strong>analysis</strong>.The computation of time-lag correlation (generalized autocorrelation)is difficult to interpret from an auditory point ofview since it is carried out in the frequency domain. The only interestingauditory analogy is that the exponent for spectral compressionis close to the one used in computation of the loudnessdensity function [34]. It would be interesting to compare the resultwith neural interspike interval histograms which, however,are less <strong>efficient</strong> to compute.The enhanced summary autocorrelation (ESACF) is aninteresting and <strong>computationally</strong> simple means to prune theperiodicity of autocorrelation function. In a typical case thisrepresentation helps in finding the fundamental periodicitiesof harmonic complex tones in a mixture of such tones. Itremoves the common periodicities such as the root tone ofmusical chords. This is useful in sound source separation ofharmonic tones. In music signal <strong>analysis</strong>, the complement ofsuch pruning, i.e., detection of chord periodicities and rejectionof single tone pitches, might as well be a useful feature forchord <strong>analysis</strong>.An interesting question of pitch <strong>analysis</strong> is the temporal integrationthat the human auditory system shows. As with a largeset of other psychoacoustic features, the formation of pitch percepttakes 100–200 ms to reach its full accuracy. Using a singleframe length of 46 ms, corresponding to an effective Hammingwindow length of about 25 ms, is a compromise of pitch trackingand sensitivity to noise. Averaging of consecutive frames can beused to improve the stability of SACF with steady-pitch signals.Better temporal integration strategies may be needed when thereis faster pitch variation.This paper has dealt with <strong>multipitch</strong> <strong>analysis</strong> of an audiosignal using the SACF and ESACF representations. The nextstep in a typical application would be to detect and describepitch objects and their trajectories in time. Related to such pitchobject detection is the resolution of the <strong>analysis</strong> when harmonictones of different amplitudes are found in a mixture signal. Asshown in Fig. 9, separation of pitch objects is easy only whenthe levels of tones are relatively similar. An effective and naturalchoice to improve the pitch <strong>analysis</strong> with varying amplitudesis to use an iterative technique, whereby the most prominentpitches are first detected and the corresponding harmoniccomplexes are filtered out by FIR comb filtering tuned to rejecta given pitch. Tones with low amplitude level can then be analyzedfrom the residual signal.The same approach is useful in more general sound (source)separation of harmonic tones [35]. The pitch lags can be usedto generate sparse FIR’s for rejecting (or enhancing) specificharmonic complexes in a given mixture signal. An exampleof vowel separation and spectral estimation of the constituentvowels is given in [35]. This can be considered as kind of <strong>multipitch</strong>prediction of harmonic complex mixtures.REFERENCES[1] W. M. Hartmann, “Pitch, periodicity, and auditory organization,” J.Acoust. Soc. Amer., vol. 100, pp. 3491–3502, Dec. 1996.[2] W. Hess, Pitch Determination of Speech Signals. Berlin, Germany:Springer-Verlag, 1983.[3] W. J. Hess, “Pitch and voicing determination,” in Advances in SpeechSignal Processing, S. Furui and M. M. Sondhi, Eds. New York: MarcelDekker, 1992, ch. 6, pp. 3–48.[4] J. A. Moorer, “On the segmentation and <strong>analysis</strong> of continuous musicalsound by digital computer,” Ph.D. dissertation, Dept. Music, StanfordUniv., Stanford, CA, May 1975.[5] R. C. Maher, “Evaluation of a method for separating digitized duet signals,”J. Audio Eng. Soc., vol. 38, pp. 956–979, June 1990.[6] R. C. Maher and J. W. Beauchamp, “Fundamental frequency estimationof musical signals using a two-way mismatch procedure,” J. Acoust. Soc.Amer., vol. 95, pp. 2254–2263, Apr. 1994.[7] C. Chafe, D. Jaffe, K. Kashima, B. Mont-Reynard, and J. Smith, “Techniquesfor note identification in polyphonic music,” Dept. Music, StanfordUniv., Stanford, CA, Tech. Rep. STAN-M-29, CCRMA, Oct. 1985.[8] C. Chafe and D. Jaffe, “Source separation and note identification in polyphonicmusic,” Dept. Music, Stanford University, Stanford, CA, Tech.Rep. STAN-M-36, CCRMA, Apr. 1986.[9] M. Weintraub, “A computational <strong>model</strong> for separating two simultanioustalkers,” Proc. <strong>IEEE</strong> Int. Conf. Acoustics, Speech, Signal Processing,vol. 1, pp. 81–84, 1986.
716 <strong>IEEE</strong> TRANSACTIONS ON SPEECH AND AUDIO PROCESSING, VOL. 8, NO. 6, NOVEMBER 2000[10] K. Kashino and H. Tanaka, “A sound source separation system withthe ability of automatic tone <strong>model</strong>ing,” Int. Computer Music Conf., pp.248–255, 1993.[11] A. Klapuri, “Number theoretical means of resolving a mixture of severalharmonic sounds,” in Proc. Signal Processing IX: Theories Applications,vol. 4, 1998, p. 2365.[12] K. D. Martin, “Automatic transcription of simple polyphonic music: Robustfront end processing,” Mass. Inst. Technol., Media Lab PerceptualComputing, Cambridge, Tech. Rep. 399, 1996.[13] , “A blackboard system for automatic transcription of simple polyphonicmusic,” Mass. Inst. Technol. Media Lab. Perceptual Computing,Cambridge, Tech. Rep. 385, 1996.[14] D. P. W. Ellis and B. L. Vercoe, “A wavelet-based sinusoid <strong>model</strong> ofsound for auditory signal separation,” in Int. Computer Music Conf.,1991, pp. 86–89.[15] USA Standard Acoustical Terminology, Amer. Nat. Stand. Inst., S1.1-1960, 1960.[16] R. Meddis and L. O’Mard, “A unitary <strong>model</strong> for pitch perception,” J.Acoust. Soc. Amer., vol. 102, pp. 1811–1820, Sept. 1997.[17] R. Meddis and M. Hewitt, “Virtual pitch and phase sensitivity of acomputer <strong>model</strong> of the auditory periphery—I: Pitch identification,” J.Acoust. Soc. Am., vol. 89, pp. 2866–2882, June 1991.[18] A. S. Bregman, Auditory Scene Analysis. Cambridge, MA: MIT Press,1990.[19] M. P. Cooke, “Modeling auditory processing and organization,” Ph.D.dissertation, Univ. Sheffield, Sheffield, U.K., 1991.[20] G. J. Brown, “Computational auditory scene <strong>analysis</strong>: A representationalapproach,” Ph.D. dissertation, Univ. Sheffield, Sheffield, U.K., 1992.[21] D. P. W. Ellis, “Prediction-driven computational auditory scene <strong>analysis</strong>,”Ph.D. dissertation, Mass. Inst. Technol., Cambridge, June 1996.[22] R. D. Patterson, “The sound of the sinusoid: Spectral <strong>model</strong>s,” J. Acoust.Soc. Amer., vol. 96, pp. 1409–1418, Sept. 1994.[23] B. C. J. Moore, R. W. Peters, and B. R. Glasberg, “Auditory filter shapesat low center frequencies,” J. Acoust. Soc. Amer., vol. 88, pp. 132–140,July 1990.[24] M. Slaney and R. F. Lyon, “A perceptual pitch detector,” Proc. <strong>IEEE</strong> Int.Conf. Acoustics, Speech, Signal Processing, vol. 1, pp. 357–360, 1990.[25] R. Carlyon and T. M. Shackleton, “Comparing the fundamental frequenciesof resolved and unresolved harmonics: Evidence for two pitchmechanisms?,” J. Acoust. Soc. Amer., vol. 95, pp. 3541–3554, June 1994.[26] R. P. Carlyon, “Comments on ‘a unitary <strong>model</strong> of pitch perception’,” J.Acoust. Soc. Amer., vol. 102, pp. 1118–1121, Aug. 1997.[27] B. R. Glasberg and B. C. J. Moore, “Derivation of auditory filter shapesfrom notched-noise data,” Hear. Res., vol. 47, pp. 103–138, 1990.[28] U. K. Laine, M. Karjalainen, and T. Altosaar, “Warped linear prediction(WLP) in speech and audio processing,” Proc. <strong>IEEE</strong> Int. Conf. Acoustics,Speech, and Signal Processing, pp. III.349–III.352, 1994.[29] E. D. Young and M. B. Sachs, “Representation of steady-state vowels inthe temporal aspects of the discharge patterns of populations of auditorynervefibers,” J. Acoust. Soc. Amer., vol. 66, pp. 1381–1403, Nov. 1979.[30] S. Seneff, “A joint synchrony/mean-rate <strong>model</strong> of auditory speech processing,”J. Phonetics, vol. 16, pp. 55–76, 1988.[31] H. Indefrey, W. Hess, and G. Seeser, “Design and evaluation of doubletransformpitch determination algorithms with nonlinear distortion inthe frequency domain—Preliminary results,” in Proc. <strong>IEEE</strong> Int. Conf.Acoustics, Speech, Signal Processing, 1985, pp. 11.11.1–11.11.4.[32] R. D. Patterson, M. H. Allerhand, and C. Giguère, “Time-domain <strong>model</strong>ingof peripheral auditory processing: A modular architecture and asoftware platform,” J. Acoust. Soc. Amer., vol. 98, pp. 1890–1894, Oct.1995.[33] T. Dau, B. Kollmeier, and A. Kohlrausch, “Modeling auditory processingof amplitude modulation—I. Detection and masking withnarrow-band carriers,” J. Acoust. Soc. Amer., vol. 102, pp. 2898–2905,Nov. 1997.[34] E. Zwicker and H. Fastl, Psychoacoustics: Facts and Models. Berlin,Germany: Springer-Verlag, 1990.[35] M. Karjalainen and T. Tolonen, “Multi-pitch and periodicity <strong>analysis</strong><strong>model</strong> for sound separation and auditory scene <strong>analysis</strong>,” in Proc. <strong>IEEE</strong>Int. Conf. Acoustics, Speech, and Signal Processing, vol. 2, 1999, pp.929–932.Tero Tolonen (S’98) was born in Oulu, Finland, in 1972. He majored inacoustics and audio signal processing and received the M.Sc.(Tech.) andLic.Sc.(Tech.) degrees in electrical engineering from the Helsinki Universityof Technology (HUT), Espoo, Finland, in January 1998 and December 1999,respectively. He is currently pursuing a postgraduate degree.He has been with the HUT Laboratory of Acoustics and Audio Signal Processingsince 1996. His research interests include <strong>model</strong>-based audio representationand coding, physical <strong>model</strong>ing of musical instruments, and digital audiosignal processing.Mr. Tolonen is a student member of the <strong>IEEE</strong> Signal Processing Society andthe Audio Engineering Society.Matti Karjalainen (M’84) was born in Hankasalmi, Finland, in 1946. He receivedthe M.Sc. and Dr.Tech. degrees in electrical engineering from the TampereUniversity of Technology, Tampere, Finland, in 1970 and 1978, respectively.His doctoral dissertation dealt with speech synthesis by rule in Finnish.From 1980 to 1986, he was Associate Professor and, since 1986, FullProfessor of acoustics with the Faculty of Electrical Engineering, HelsinkiUniversity of Technology, Espoo, Finland. His research activities cover speechsynthesis, <strong>analysis</strong>, and recognition, auditory <strong>model</strong>ing and spatial hearing,DSP hardware, software, and programming environments, as well as variousbranches of acoustics, including musical acoustics and <strong>model</strong>ing of musicalinstruments.Dr. Karjalainen is a fellow of the AES and a member of ASA, EAA, ICMA,ESCA, and several Finnish scientific and engineering societies. He was the GeneralChair of the 1999 <strong>IEEE</strong> Workshop on Applications of Audio and Acoustics,New Paltz, NY.