how Digiquartz
how Digiquartz
how Digiquartz

Create successful ePaper yourself
Turn your PDF publications into a flip-book with our unique Google optimized e-Paper software.
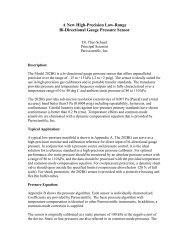
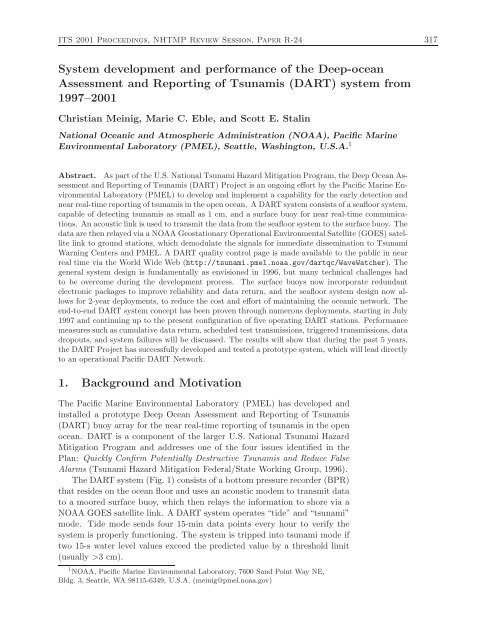
320 C. Meinig et al.Figure 3: DART buoy development from Ronald H. Brown.costs. All systems deployed in April 2000 and beyond are designed for 2-year longevity. Deploying and recovering the BPR package every other yearreduces production and shiptime costs.Result: Decreased cost.2.4 World Wide Web—data quality control pageThe most significant data display addition was the development of a nearreal-time DART data web page in July 1998 to facilitate quality control byPMEL personnel (http://tsunami.pmel.noaa.gov/dartqc/WaveWatcher).This web site is accessible to all interested parties including State officialsand NOAA’s Tsunami Warning Centers.Result: Worldwide distribution that is cost-effective and available in nearreal time.A timeline of DART system milestones is s<strong>how</strong>n in Fig. 4. The designand development efforts at PMEL are ongoing and have resulted in an arrayof six DART systems that will be in place by August 2001. The systems are
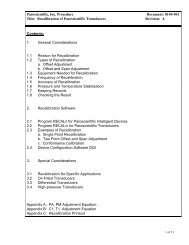
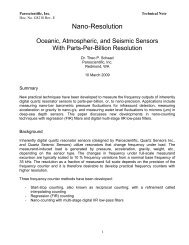
ITS 2001 Proceedings, NHTMP Review Session, Paper R-24 321Oct 96Received FundingJul 98Realtime webpageon lineMay 99Operational PrototypeDeployedAug 004 BuoyArray On lineJun 015 BuoyArray On lineSept 016 Buoy Array On line19971998 1999 2000 2001Oct 96 Oct 01Jan 01Jul 97Oct 99Initialized TechnologyFirst OceanTestFirst Earthquake triggeredTransfer Discussion withreportNDBCFigure 4: DART development milestones.reporting near real-time data to NOAA Tsunami Warning Centers and overthe World Wide Web.3. Performance3.1 Data returnThe end-to-end DART system concept has been proven through numerousdeployments with overall high percentage data return. A histogram of thestation sites, deployment durations, and percentage of data return for theyear 1997–2001 is s<strong>how</strong>n in Fig. 5. The percentage of data return, s<strong>how</strong>n asnumbers inside each bar, is defined as the number of hourly and triggeredtransmissions received divided by the total possible transmissions during thestation deployment. DART array averages for each year are s<strong>how</strong>n belowthe bars on the deployment-year axis.During the 1997 and 1998 R&D years many hardware and softwarechanges were incorporated with improving data return rates of 48% and96%, respectively. Data return rates for the prototype DART systems in1999, 2000, and 2001 were 97%, 89%, and 100%, respectively. The lowerrate of return in year 2000 array, as compared with that of the previousyear, is somewhat misleading. Three of the four DART sites deployed inyear 2000 returned data at a rate exceeding 99%. The 4th site, D157, returneddata at this same rate until a high current drain caused the batteriesto be depleted and the buoy ceased to transmit in March 2001. This isfurther discussed in Section 4, “Data DropOut.”3.2 Event reportingA tsunami with energy directed into the path of a DART buoy has not beengenerated since the prototype array has been deployed. However, the systemhas performed well during scheduled test tsunami transmissions (implementedin 2000) and tsunami mode transmissions initiated by earthquakes.Table 1 s<strong>how</strong>s the performance of the DART array responding to scheduledtransmissions and random events.
322 C. Meinig et al.Figure 5: Histogram of station sites, deployment durations, and percentage of data return for the year1997–2001.
ITS 2001 Proceedings, NHTMP Review Session, Paper R-24 323Table 1: Performance of the DART array responding to scheduledtransmission and random events.Events 1997 1998 1999 2000 2001Scheduled TransmissionsScheduled/received 0/0 0/0 0/0 4/4 *tsunami test transmissionsRandom TransmissionsTsunami 0 0 0 0 0Earthquake 0 0 2a,b 2c,d 1eFalse Trigger 0 0 0 0 0* Scheduled for July and October 2001a = D123 station 10/19/99b = D157 station 12/9/99c = D130 station 6/2/00d = D130 station 8/10/00e = D157 station 1/10/01In summary, the DART array has gone through two phases of development,“R&D” and “Prototype” array. Many engineering improvement weremade during the “R&D” phase to boost reliability and decrease costs. Theprototype DART array has performed very well with: 1) high data returns;2) excellent response to scheduled and random events; and 3) no false alarmsduring the 5-year development period.4. Data DropoutThe most significant cause of data dropouts from the 1997 and 1998 R&Ddeployments was poor acoustic communications with the seafloor BPR. Toa large measure, this has been corrected through hardware, software, andpackaging changes of the acoustic modems.The D157 station correctly triggered on a January 2001 earthquake, butfailed to return to the low-power “tide” mode after the expected periodof time. The buoy remained in the high power “trigger” mode for over 2months until all battery power was consumed. The buoy has recently beenrecovered and the cause of this failure is now under investigation. Someadditional isolated causes for data losses are listed below: GOES satellite: Dropouts have occurred during times of high solarflare activity. GOES transmitter: Commercial product failures; changed vendors. Isolated cable and connector problems. Tower failures: During the harsh winter of 1998, two surface buoytowers were destroyed, severing the satellite link. Aluminum towerconstruction and weld inspection was improved and the problem hasnot reoccurred.
324 C. Meinig et al.5. Future WorkIt has been proposed (Bernard et al., 2001) to expand the DART array fromsix to ten stations over the next 5 years. In order to develop an operationalDART Pacific Network, we recommend continuing the development processto improve reliability, expand data products, and decrease costs. Listedbelow are some possible enhancements: Development of next generation of electronics suitable for other buoyplatforms and mooring configurations. Increasing service life of seafloor BPR from 2 to 4 years. Two-way communications from desktop to seafloor BPR.Acknowledgments. The authors would like to acknowledge funding supportfrom NOAA, NTHMP, and the five states that have made this project successful.6. ReferencesBernard, E.N., F.I. González, and C. Meinig (2001): Early detection and real-timereporting of deep-ocean tsunamis. International Tsunami Symposium 2001, 7–10 August 2001, Seattle, WA.Tsunami Hazard Mitigation Federal/State Working Group (1996): Tsunami HazardMitigation Implementation Plan—A Report to the Senate AppropriationsCommittee, 22 pp., Appendices.