Nano-Resolution Sensors for Environmental ... - Paroscientific, Inc.
Nano-Resolution Sensors for Environmental ... - Paroscientific, Inc.
Nano-Resolution Sensors for Environmental ... - Paroscientific, Inc.
- No tags were found...
You also want an ePaper? Increase the reach of your titles
YUMPU automatically turns print PDFs into web optimized ePapers that Google loves.
<strong>Nano</strong>-<strong>Resolution</strong> <strong>Sensors</strong> <strong>for</strong><strong>Environmental</strong> MonitoringPrepared by:<strong>Paroscientific</strong>, <strong>Inc</strong>.Quartz Seismic <strong>Sensors</strong>, <strong>Inc</strong>.<strong>Paroscientific</strong>, <strong>Inc</strong>.
Earth-Air-Fire & Water <strong>Paroscientific</strong>, <strong>Inc</strong>.Digiquartz ® Pressure Instrumentation
NSF Instrumentation GoalsThe NSF "<strong>Sensors</strong> <strong>for</strong> <strong>Environmental</strong> Observatories" Report highlights:A national commitment is needed to sensor development, and to research anddesign coordination of sensor networks.New partnerships need to be developed among scientists and engineersinvolved in environmental research.New modeling and visualization tools are critical <strong>for</strong> the development of sensornetworks.<strong>Sensors</strong> should be developed in the context of a linked sensor network.<strong>Paroscientific</strong>, <strong>Inc</strong>.
New Technologies <strong>for</strong><strong>Environmental</strong> MonitoringNew <strong>Nano</strong>-<strong>Resolution</strong> Technologies offer unprecedented, cuttingedge,scientific and educational opportunities in the oceanic,atmospheric and seismic fieldsLow-cost, multi-use, cross-disciplinary research of air-sea-landinteractions can be accomplished by adding <strong>Nano</strong>-<strong>Resolution</strong> <strong>Sensors</strong>to existing networksNew environmental monitoring capabilities include measuringabsolute barometric pressure fluctuations to nano-bars <strong>for</strong> infrasounddetection, measuring water level fluctuations to microns withabsolute, deep-sea depth sensors, and measuring acceleration andEarth's gravity to nano-g’s<strong>Paroscientific</strong>, <strong>Inc</strong>.
Application Areas <strong>for</strong> Quartz <strong>Sensors</strong> with <strong>Nano</strong>-<strong>Resolution</strong> <strong>Paroscientific</strong>, <strong>Inc</strong>.
<strong>Nano</strong>-<strong>Resolution</strong> TechnologyInherently digital sensors based on quartz crystal technology are usedextensively <strong>for</strong> environmental monitoring because of their highabsolute accuracy and long-term stabilityMany oceanic, atmospheric and seismic applications requirebroadband, high-resolution measurements of dynamic phenomenaAdvances in counting circuitry and digital signal processing haveimproved the resolution of Quartz Crystal Resonator <strong>Sensors</strong> to asensitivity of parts-per-billion over an extended spectrum<strong>Paroscientific</strong>, <strong>Inc</strong>.
Advantages of Quartz Resonant <strong>Sensors</strong>• High <strong>Resolution</strong>More precise measurements can be made in the time domain thanthe analog domain.• Excellent AccuracyThe quartz crystal sensors have superior elastic properties resultingin excellent repeatability and low hysteresis.• Long Term StabilityQuartz crystals are very stable and are commonly used as frequencystandards in counter-timers, clocks , and communication systems.• Low Power Consumption• Low Temperature Sensitivity• Low Susceptibility to Interference• Easy to Transmit Over Long Distances• Easy to Interface With Counter-Timers, Telemetry, and DigitalComputer Systems<strong>Paroscientific</strong>, <strong>Inc</strong>.
Double-Ended Tuning Fork Force <strong>Sensors</strong>Surface ElectrodesElectrical Excitation PadsMounting PadApplied LoadDual Tine Resonators<strong>Paroscientific</strong>, <strong>Inc</strong>.
<strong>Paroscientific</strong>, <strong>Inc</strong>.Double-Ended Tuning Fork Force <strong>Sensors</strong>
Torsional Resonator Temperature SensorElectrical Excitation PadsDual TorsionallyOscillating TinesMounting PadNominal Period of Oscillation=5.8 microsecondsNominal Temperature Sensitivity=45 ppm/ 0 C<strong>Paroscientific</strong>, <strong>Inc</strong>.
<strong>Paroscientific</strong>, <strong>Inc</strong>.Wafer of Temperature <strong>Sensors</strong>
Quartz Crystal Resonator Pressure TransducersInternal VacuumBalance WeightBourdon TubeQuartz CrystalResonator Force SensorCaseBalance WeightQuartz CrystalResonator Force SensorPressure InputQuartz ResonatorTemperature SensorBellowsInput PressureQuartz ResonatorTemperature Sensor<strong>Paroscientific</strong>, <strong>Inc</strong>.
<strong>Paroscientific</strong>, <strong>Inc</strong>.Digiquartz ® Barometer
Output Period vs. ForceResonant Period (microseconds)28262422Full Scale Tension0 Full Scale Compression10% Change in Period with Full Scale Load<strong>Paroscientific</strong>, <strong>Inc</strong>.
Reciprocal Start-Stop CountingPressureSignalTimeN PeriodsTimebaseClock(f c)Timeτ=Sensor Output Period= 1/Resonant FrequencyN=Number of PeriodsTransducer period output, τ, gates a high frequency clock, f c ,<strong>for</strong> N periods and the clock pulses are counted.<strong>Paroscientific</strong>, <strong>Inc</strong>.
PressureSignalTimeN PeriodsTimebaseClockTimeSampling Time=NτPeriod <strong>Resolution</strong>=+/- 1 Count/(Total Counts)=+/- 1 / (Nτ)(f c )= +/- 1 / (Sampling Time) (f c )Force <strong>Resolution</strong>= +/- 10 / (Nτ)(f c ) (Only 10% of the counts arerelated to Force)Example: If clock=20 MHz and sampling time=1 secondThen the Force <strong>Resolution</strong>=5x10 -7 Full Scale<strong>Paroscientific</strong>, <strong>Inc</strong>.
Linearization and TemperatureCompensationForce = C[1- τ 02 / τ 2 ] [1-D(1- τ 02 / τ 2 )]τ =Force Resonator Period OutputC=Scale Factor in Desired Engineering UnitsD=Linearization Coefficientτ 0 =Period Output at No Load (Force=0)U=(Temperature Sensor Period)-(Temperature Period at zero 0 C)τ 0 = τ 1 + τ 2 U+ τ 3 U 2 + τ 4 U 3 + τ 5 U 4C=C 1 +C 2 U+C 3 U 2D=D 1 +D 2 UTemperature=Y 1 U+Y 2 U 2 +Y 3 U 3 ( 0 C)<strong>Paroscientific</strong>, <strong>Inc</strong>.
Intelligent InstrumentationTransducerPressure SignalTemperature SignalMultiplexerCounter15 Mhz ClockEPROMEEPROMMicroprocessorShift StorePass OnRS-232 &RS-485 InRS-232 &485 InterfaceRS-232 &RS-485 Out<strong>Paroscientific</strong>, <strong>Inc</strong>.
<strong>Nano</strong>-<strong>Resolution</strong> Counting TechniquesStart-Stop Reciprocal Counting: Measure time with a high-speed clock <strong>for</strong> Nsignal periods.Regression Counting: Measure signal periods many times (over-sample) andapply a regression algorithm. This is a Finite-Impulse-Response (FIR) filter with up to100 times higher sensitivity at 1 Hz sampling and <strong>Nano</strong>-<strong>Resolution</strong> is possible.IIR <strong>Nano</strong>-Counting: Uses a multi-stage Infinite-Impulse-Response (IIR) digital lowpassfilter with each stage of the <strong>for</strong>m:w n= α z n+ (1 – α) w n-1z nIs the unfiltered period and w nis the filtered period output after one filter stage.Alpha, α, is small and determines the frequency cutoff value of the low-pass filter.A 5-stage low-pass filter attenuates all values above the cutoff at -100 dB/decade.High-frequency signals are filtered (anti-aliasing filter) and <strong>Nano</strong>-<strong>Resolution</strong> is possible.<strong>Paroscientific</strong>, <strong>Inc</strong>.
<strong>Nano</strong>-<strong>Resolution</strong> withRegression (FIR) Counting(FIR: Finite-Impulse-Response in Digital Signal Processing)Start-Stop MethodRegression Methodn Clock Counts8007006005004003002001000-100-1 0 1 2 3 4 5 6 7 8 9 10 11N Periodsn Clock Counts8007006005004003002001000-100-1 0 1 2 3 4 5 6 7 8 9 10 11N PeriodsStart-stop method: Slope between endpoints determines sensor period.Regression counting: Many sub-samples, slope is least-squares regression fit.Statistical improvement is √(N/6). <strong>Nano</strong>-resolution (parts-per-billion) is possible.<strong>Paroscientific</strong>, <strong>Inc</strong>.
<strong>Resolution</strong> Improvement with <strong>Nano</strong>-Counting1.0000Standard Deviation (Pa)0.10000.01000.0010Reciprocal Start-Stop Counting Technique0.0001<strong>Nano</strong>-<strong>Resolution</strong> With Advanced Counting Algorithms1.E+0 1.E+1 1.E+2 1.E+3 1.E+4 1.E+5 1.E+6 1.E+7 1.E+8 1.E+9Record Length (seconds)<strong>Paroscientific</strong>, <strong>Inc</strong>.Digiquartz ® Pressure Instrumentation
Experimental IIR <strong>Nano</strong>-Counting <strong>Resolution</strong>100101Pascal0.10.010.0010.00010.000010.0001 0.001 0.01 0.1 1 10 100Time Interval (seconds)<strong>Paroscientific</strong>, <strong>Inc</strong>.Digiquartz ® Pressure Instrumentation
Ambient Barometric Infrasound SpectrumAnd Digiquartz <strong>Nano</strong>-Barometer Noise FloorPsi^2/HzHzDay-long barometric data in Seattle (7/23/08)Green curve: Infrasound ambient background (no micro-baroms)Red curve: Instrument self-noise 7.2 E-7 Pa^2/Hz (-61 dB re: Pa^2/Hz)<strong>Paroscientific</strong>, <strong>Inc</strong>.Digiquartz ® Pressure InstrumentationPlot courtesy of Spahr Webb
Pacific Ocean Microbaroms Using IIR Filter<strong>Paroscientific</strong>, <strong>Inc</strong>.
Digiquartz <strong>Nano</strong>-Barometer Spectral <strong>Resolution</strong>Superimposed on Infrasound Ambient Spectrum- Bowman et al, SAIC, Infrasound Technology Workshop -Tokyo, Japan November 13-16, 2007Micro-barom Peak- Digiquartz <strong>Nano</strong>-Barometer Spectral <strong>Resolution</strong> -<strong>Paroscientific</strong>, <strong>Inc</strong>.Digiquartz ® Pressure Instrumentation
1006.751006.71006.651006.6hPa1006.551006.51006.451006.41006.351006.31200 1400 1600 1800 2000 2200 2400seconds after 10/3/09 8:00 UTC<strong>Paroscientific</strong>, <strong>Inc</strong>.Digiquartz ® Pressure Instrumentation
642Pa0-2-4-61950 2000 2050 2100 2150 2200seconds after 10/3/09 8:00 UTC<strong>Paroscientific</strong>, <strong>Inc</strong>.Digiquartz ® Pressure Instrumentation
<strong>Paroscientific</strong>, <strong>Inc</strong>.Digiquartz ® Pressure Instrumentation
Digiquartz Depth Sensor Noise FloorVertical axis: Spectral density plot in psi 2 /Hz Horizontal axis: Frequency in HzGreen curve: Infrasound ambient background (measured with 7000 m depth sensor)Blue curve: Instrument self-noise (less than 0.14 Pa /Hz)Noise floor of a 2000 m depth sensor is 0.01 Pa 2 /Hz<strong>Paroscientific</strong>, <strong>Inc</strong>.Digiquartz ® Pressure InstrumentationPlot courtesy of Spahr Webb
Tsunami Warning SystemPhotos and Diagrams courtesy of N.O.A.A.<strong>Paroscientific</strong>, <strong>Inc</strong>.Digiquartz ® Pressure Instrumentation
Tsunami Detection (Earthquake Generated Tidal Waves)Improved Sensitivity of
<strong>Paroscientific</strong>, <strong>Inc</strong>.Digiquartz ® Pressure Instrumentation
Ocean Observatory Program <strong>Paroscientific</strong>, <strong>Inc</strong>.Digiquartz ® Pressure Instrumentation
<strong>Paroscientific</strong>, <strong>Inc</strong>.Digiquartz ® Pressure Instrumentation
<strong>Paroscientific</strong>, <strong>Inc</strong>.Digiquartz ® Pressure Instrumentation
<strong>Paroscientific</strong>, <strong>Inc</strong>.Digiquartz ® Pressure InstrumentationSlide Courtesy of John Delaney
GPS MeteorologyGPS Determination of Precipitable Water Vapor• Measure Total Delay=Ionospheric + Neutral Delays• Ionospheric Delay (frequency dependent) determined bycomparing L1 & L2 GPS signals• Neutral Delay=Wet Delay + Hydrostatic Delay(Barometric Pressure, Temperature, Humidity dependent)• Calculate Precipitable Water Vapor from Wet Delay<strong>Paroscientific</strong>, <strong>Inc</strong>.Digiquartz ® Pressure Instrumentation
AtmoScopeInterdisciplinary Research Using Broadband BarometersCo-located with EarthScope SeismometersAndreas MuschinskiParos Professor of Measurement Sciences—University of MassachusettsAtmospheric pressure and infrasound signals often carry seismic in<strong>for</strong>mation, andatmospheric in<strong>for</strong>mation is often contained in seismometer measurements.Interestingly, however, much of this interface between seismology andatmospheric science is still virgin territory. Here we propose the AtmoScopeprogram, the observational centerpiece of which will be an array of severalhundred state-of-the-art, broadband barometers collocated with the seismometersof the 70-km grid, Transportable Array of the NSF-funded EarthScope program.The AtmoScope observations will be of mutual benefit <strong>for</strong> scientists and engineersin geophysics, atmospheric physics, operational meteorology, and related areas.The AtmoScope program will foster disciplinary and interdisciplinary research onthe following topics:<strong>Paroscientific</strong>, <strong>Inc</strong>.
Atmospheric Noise MitigationLocal atmospheric pressure fluctuations are significant sources ofnoise in seismic data. Pressure changes associated with commonatmospheric phenomena such as frontal passages, jet-streampassages, boundary-layer convection, and gravity waves can de<strong>for</strong>mthe ground that surrounds a seismometer to cause significanthorizontal tilt noise. Other atmospheric influences include thegravitational effects of a variable weight of the column of air above theseismometer, vertical ground de<strong>for</strong>mations, and possible buoyancyeffects. The reconstruction and elimination, in real time or post facto,of these atmospheric effects requires the monitoring of local pressurechanges with collocated high-resolution, broadband barometers. Thepressure-induced noise can be deterministically removed from theseismometer, strainmeter, and tiltmeter data to substantially increasethe overall per<strong>for</strong>mance of the EarthScope sensor network.<strong>Paroscientific</strong>, <strong>Inc</strong>.
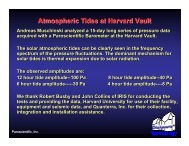
Atmospheric Tides at Harvard VaultAndreas Muschinski analyzed a 15-day long series of pressure dataacquired with a <strong>Paroscientific</strong> Barometer at the Harvard Vault.The solar atmospheric tides can be clearly seen in the frequencyspectrum of the pressure fluctuations. The dominant mechanism <strong>for</strong>solar tides is thermal expansion due to solar radiation.The observed amplitudes are:12 hour tide amplitude--100 Pa 8 hour tide amplitude--40 Pa6 hour tide amplitude-----30 Pa 4 hour tide amplitude----8 PaWe thank Robert Busby and John Collins of IRIS <strong>for</strong> conducting thetests and providing the data, Harvard University <strong>for</strong> use of their facility,equipment and seismic data, and Quanterra, <strong>Inc</strong>. <strong>for</strong> their collection,integration and installation assistance.<strong>Paroscientific</strong>, <strong>Inc</strong>.
<strong>Paroscientific</strong>, <strong>Inc</strong>.Atmospheric Tides at Harvard Vault
<strong>Paroscientific</strong>, <strong>Inc</strong>.Atmospheric Tides at Harvard Vault
Year-long Atmospheric Tides at AlbuquerqueAndreas Muschinski made a preliminary analysis of the GSN AMN0 (Albuquerque) pressure timeseries compiled by Tim Ahern and Rick Benson. The dataset, collected with a <strong>Paroscientific</strong>broadband barometer, contains about 200 million one-second samples of surface barometricpressure covering the 6-year period from January 2002 through April 2007. This first preliminaryanalysis considered the first 365 days from the second file with 31.5 million one-second samples(data points). A sequence of 52,560 (365 x 86,400/600) ten-minute averages (averages over 600subsequent samples) and resulting periodogram were computed.The solar tides reflect the Fourier components of the daily pressure signals associated with thedaily temperature signals. The (solar) diurnal tide, the semidiurnal tide, the 8-h (1/3 day) tide, the6-h (1/4 day) tide, and all the higher harmonics up to the 206-min tide (1/7 day) are resolved withan unprecedented signal-to-noise ratio. Also the 160-min tide (1/9 day) is visible. An estimate of 5Pa (!) <strong>for</strong> the amplitude of the 6-h (1/4 day) tide was obtained. The amplitudes of the higherharmonics are even smaller.Installation of state-of-the-art, broadband barometers on the EarthScope grid would dramaticallyimprove our ability to monitor atmospheric tides and their seasonal variability, annual cycle, andpossible long-term trends on regional and global scales. The resulting database would open newavenues <strong>for</strong> basic and applied research and would be useful <strong>for</strong> the improvement of numericalweather prediction (NWP) models, global circulation models (GCMs), andclimate system models (CSMs).<strong>Paroscientific</strong>, <strong>Inc</strong>.
<strong>Paroscientific</strong>, <strong>Inc</strong>.We thank David Simpson, Tim Ahern, Rick Benson, RickAster, and their colleagues at IRIS, GSN, PASSCAL, andDMC <strong>for</strong> providing the data and <strong>for</strong>mat analysis techniques
<strong>Paroscientific</strong>, <strong>Inc</strong>.
Quartz Seismic InstrumentationDigital <strong>for</strong>ce sensors have been applied to measure avariety of physical parameters including pressure,temperature, load, angular rate, weight, and acceleration.Resonant quartz crystals, that change their frequency ofoscillation with applied load, have many sensingadvantages over analog devices. These advantagesinclude the ease of measurements in the time domain,remarkable resolution, high accuracy, low powerconsumption, excellent long-term stability andinsensitivity to environmental errors. Thus quartz sensortechnology may also meet some needs of the seismiccommunity.<strong>Paroscientific</strong>, <strong>Inc</strong>.
Resonant Quartz Crystal AccelerometersAn intrinsically digital, triaxial accelerometer with a fullscale of ±3 g’s was developed with a dynamic range of176 dB (to 5 nano-g’s) using nano-counting techniques.The dynamic range is at least an order of magnitudehigher than existing products.Advantages include small size, low power, shockprotection, and a suitable temperature range <strong>for</strong>oceanographic and seismic vault installations.Applications include Earthquake Monitoring, DirectionalDrilling, Gravity Surveys, and Monitoring of CarbonSequestration.<strong>Paroscientific</strong>, <strong>Inc</strong>.
Quartz Triaxial Accelerometer (Circa 2008)US Patent 6,826,960, Schaad and Paros, “Triaxial Acceleration Sensor”<strong>Paroscientific</strong>, <strong>Inc</strong>.Digiquartz ® Pressure Instrumentation
Acceleration Sensing ResonatorsQuartz Triaxial AccelerometerCounter & DigitalProcessing ElectronicsQuad Oscillator3 Acceleration +1 TemperatureTemperature Sensing ResonatorsInertial Mass<strong>Paroscientific</strong>, <strong>Inc</strong>.Digiquartz ® Pressure InstrumentationTriaxialMechanism
Lunar-Solar Gravitational TidesMeasured with Quartz Seismic Sensor<strong>Paroscientific</strong>, <strong>Inc</strong>.
Earthquake <strong>Nano</strong>-<strong>Resolution</strong> with3-g Full-scale Quartz Seismic SensorTriax IIR Alpha=0.0005 Honshu M=7.2 (6/13/08 23:43:46 UTC) 16:40-17:40 PDT1000 ng/div0 1 2 3 4 5 6 7 8 9 10MinutesHonshu (Japan) Earthquake (13 June 2008)Measured in Seattle WA (USA) with IIR nano-counting<strong>Paroscientific</strong>, <strong>Inc</strong>.Digiquartz ® Pressure Instrumentation
<strong>Paroscientific</strong>, <strong>Inc</strong>.Quartz <strong>Sensors</strong>, <strong>Inc</strong>.4500 148th Ave. N.E.Redmond, WA 98052www.paroscientific.com<strong>Paroscientific</strong>, <strong>Inc</strong>.Digiquartz ® Pressure Instrumentation


