Crescent City Profile - California Sea Grant
Crescent City Profile - California Sea Grant
Crescent City Profile - California Sea Grant
- No tags were found...

Create successful ePaper yourself
Turn your PDF publications into a flip-book with our unique Google optimized e-Paper software.
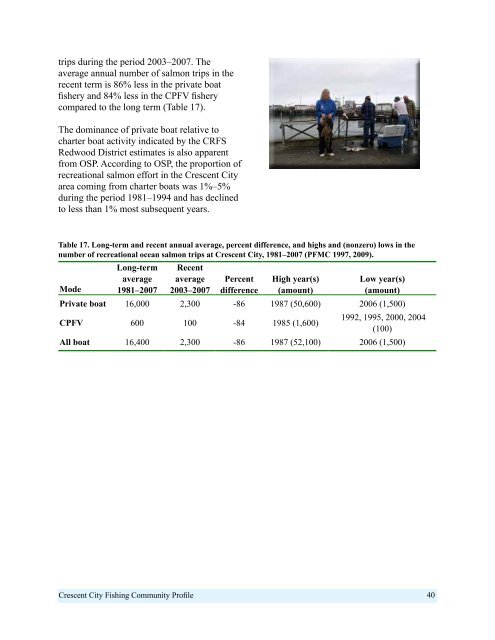
trips during the period 2003–2007. Theaverage annual number of salmon trips in therecent term is 86% less in the private boatfishery and 84% less in the CPFV fisherycompared to the long term (Table 17).The dominance of private boat relative tocharter boat activity indicated by the CRFSRedwood District estimates is also apparentfrom OSP. According to OSP, the proportion ofrecreational salmon effort in the <strong>Crescent</strong> <strong>City</strong>area coming from charter boats was 1%–5%during the period 1981–1994 and has declinedto less than 1% most subsequent years.Table 17. Long-term and recent annual average, percent difference, and highs and (nonzero) lows in thenumber of recreational ocean salmon trips at <strong>Crescent</strong> <strong>City</strong>, 1981–2007 (PFMC 1997, 2009).ModeLong-termaverage1981–2007Recentaverage2003–2007PercentdifferenceHigh year(s)(amount)Low year(s)(amount)Private boat 16,000 2,300 -86 1987 (50,600) 2006 (1,500)CPFV 600 100 -84 1985 (1,600)1992, 1995, 2000, 2004(100)All boat 16,400 2,300 -86 1987 (52,100) 2006 (1,500)<strong>Crescent</strong> <strong>City</strong> Fishing Community <strong>Profile</strong> 40