View - Ecole Centrale Paris
View - Ecole Centrale Paris
View - Ecole Centrale Paris

You also want an ePaper? Increase the reach of your titles
YUMPU automatically turns print PDFs into web optimized ePapers that Google loves.
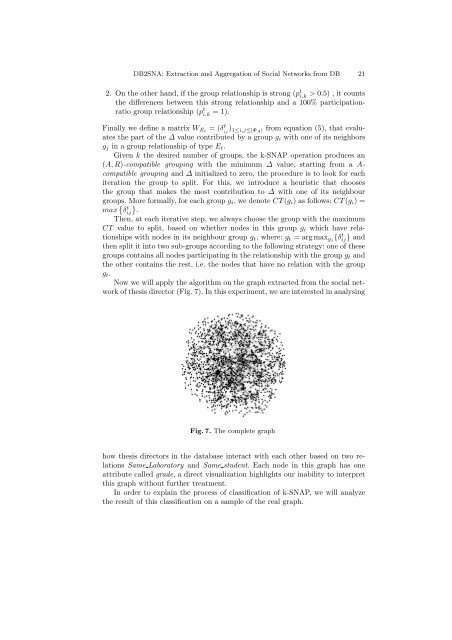
DB2SNA: Extraction and Aggregation of Social Networks from DB 212. On the other hand, if the group relationship is strong (p t i,k> 0.5) , it countsthe differences between this strong relationship and a 100% participationratiogroup relationship (p t i,k = 1).Finally we define a matrix W Et = (δ t ij ) 1≤i,j≤|Φ A| from equation (5), that evaluatesthe part of the ∆ value contributed by a group g i with one of its neighborsg j in a group relationship of type E t .Given k the desired number of groups, the k-SNAP operation produces an(A,R)-compatible grouping with the minimum ∆ value, starting from a A-compatible grouping and ∆ initialized to zero, the procedure is to look for eachiteration the group to split. For this, we introduce a heuristic that choosesthe group that makes the most contribution to ∆ with one of its neighbourgroups. More formally, for each group g i , we denote CT(g i ) as follows: CT(g i ) =max { δ t ij}.Then, at each iterative step, we always choose the group with the maximumCT value to split, based on whether nodes in this group g i which have relationshipswith nodes in its neighbour group g t , where: g t = argmax gj {δ t ij } andthen split it into two sub-groups according to the following strategy: one of thesegroups contains all nodes participating in the relationship with the group g t andthe other contains the rest, i.e. the nodes that have no relation with the groupg t .Now we will apply the algorithm on the graph extracted from the social networkof thesis director (Fig. 7). In this experiment, we are interested in analysingFig.7. The complete graphhow thesis directors in the database interact with each other based on two relationsSame Laboratory and Same student. Each node in this graph has oneattribute called grade, a direct visualization highlights our inability to interpretthis graph without further treatment.In order to explain the process of classification of k-SNAP, we will analyzethe result of this classification on a sample of the real graph.