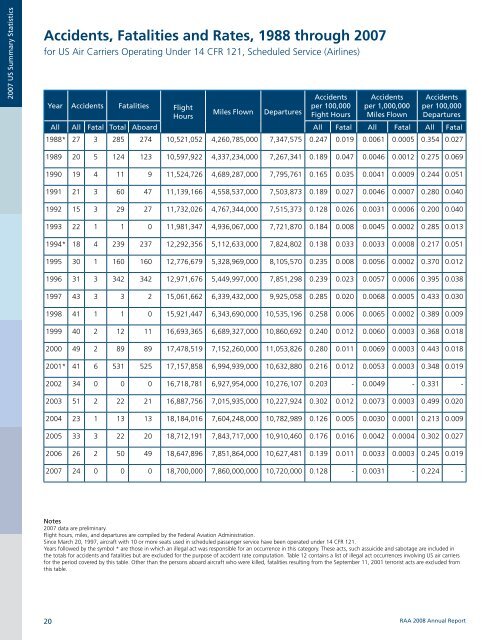
2007 US Summary StatisticsAccidents, Fatalities and Rates, 1988 through 2007for US Air Carriers Operating Under 14 CFR 121, Scheduled Service (Airlines)Year Accidents Fatalities FlightHoursMiles FlownDeparturesAccidentsper 100,000Fight HoursAccidentsper 1,000,000Miles FlownAccidentsper 100,000DeparturesAll All Fatal Total Aboard All Fatal All Fatal All Fatal1988* 27 3 285 274 10,521,052 4,260,785,000 7,347,575 0.247 0.019 0.0061 0.0005 0.354 0.0271989 20 5 124 123 10,597,922 4,337,234,000 7,267,341 0.189 0.047 0.0046 0.0012 0.275 0.0691990 19 4 11 9 11,524,726 4,689,287,000 7,795,761 0.165 0.035 0.0041 0.0009 0.244 0.0511991 21 3 60 47 11,139,166 4,558,537,000 7,503,873 0.189 0.027 0.0046 0.0007 0.280 0.0401992 15 3 29 27 11,732,026 4,767,344,000 7,515,373 0.128 0.026 0.0031 0.0006 0.200 0.0401993 22 1 1 0 11,981,347 4,936,067,000 7,721,870 0.184 0.008 0.0045 0.0002 0.285 0.0131994* 18 4 239 237 12,292,356 5,112,633,000 7,824,802 0.138 0.033 0.0033 0.0008 0.217 0.0511995 30 1 160 160 12,776,679 5,328,969,000 8,105,570 0.235 0.008 0.0056 0.0002 0.370 0.0121996 31 3 342 342 12,971,676 5,449,997,000 7,851,298 0.239 0.023 0.0057 0.0006 0.395 0.0381997 43 3 3 2 15,061,662 6,339,432,000 9,925,058 0.285 0.020 0.0068 0.0005 0.433 0.0301998 41 1 1 0 15,921,447 6,343,690,000 10,535,196 0.258 0.006 0.0065 0.0002 0.389 0.0091999 40 2 12 11 16,693,365 6,689,327,000 10,860,692 0.240 0.012 0.0060 0.0003 0.368 0.0182000 49 2 89 89 17,478,519 7,152,260,000 11,053,826 0.280 0.011 0.0069 0.0003 0.443 0.0182001* 41 6 531 525 17,157,858 6,994,939,000 10,632,880 0.216 0.012 0.0053 0.0003 0.348 0.0192002 34 0 0 0 16,718,781 6,927,954,000 10,276,107 0.203 - 0.0049 - 0.331 -2003 51 2 22 21 16,887,756 7,015,935,000 10,227,924 0.302 0.012 0.0073 0.0003 0.499 0.0202004 23 1 13 13 18,184,016 7,604,248,000 10,782,989 0.126 0.005 0.0030 0.0001 0.213 0.0092005 33 3 22 20 18,712,191 7,843,717,000 10,910,460 0.176 0.016 0.0042 0.0004 0.302 0.0272006 26 2 50 49 18,647,896 7,851,864,000 10,627,481 0.139 0.011 0.0033 0.0003 0.245 0.0192007 24 0 0 0 18,700,000 7,860,000,000 10,720,000 0.128 - 0.0031 - 0.224 -Notes2007 data are preliminary.Flight hours, miles, and departures are compiled by the Federal Aviation Administration.Since March 20, 1997, aircraft with 10 or more seats used in scheduled passenger service have been operated under 14 CFR 121.Years followed by the symbol * are those in which an illegal act was responsible for an occurrence in this category. These acts, such assuicide and sabotage are included inthe totals for accidents and fatalities but are excluded for the purpose of accident rate computation. Table 12 contains a list of illegal act occurrences involving US air carriersfor the period covered by this table. Other than the persons aboard aircraft who were killed, fatalities resulting from the September 11, 2001 terrorist acts are excluded fromthis table.20<strong>RAA</strong> 2008 <strong>Annual</strong> <strong>Report</strong>
Accidents, Fatalities and Rates, 1988 through 2007for US Air Carriers Operating Under 14 CFR 135, Scheduled Service (Airlines)YearAccidents Fatalities FlightHoursMiles FlownDeparturesAccidentsper 100,000Flight HoursAccidentsper 1,000,000Miles FlownAccidentsper 100,000DeparturesAll Fatal Total Aboard All Fatal All Fatal All Fatal2007 US Summary Statistics1988 18 2 21 21 2,092,689 380,237,000 2,909,005 0.860 0.096 0.0473 0.0053 0.619 0.0691989 19 5 31 31 2,240,555 393,619,000 2,818,520 0.848 0.223 0.0483 0.0127 0.674 0.1771990 15 3 6 4 2,341,760 450,133,000 3,160,089 0.641 0.128 0.0333 0.0067 0.475 0.0951991 23 8 99 77 2,291,581 433,900,000 2,820,440 1.004 0.349 0.0530 0.0184 0.815 0.2841992* 23 7 21 21 2,335,349 507,985,000 3,114,932 0.942 0.300 0.0433 0.0138 0.706 0.2251993 16 4 24 23 2,638,347 554,549,000 3,601,902 0.606 0.152 0.0289 0.0072 0.444 0.1111994 10 3 25 25 2,784,129 594,134,000 3,581,189 0.359 0.108 0.0168 0.0050 0.279 0.0841995 12 2 9 9 2,627,866 550,377,000 3,220,262 0.457 0.076 0.0218 0.0036 0.373 0.0621996 11 1 14 12 2,756,755 590,727,000 3,515,040 0.399 0.036 0.0186 0.0017 0.313 0.0281997 16 5 46 46 982,764 246,029,000 1,394,096 1.628 0.509 0.0650 0.0203 1.148 0.3591998 8 0 0 0 353,670 50,773,000 707,071 2.262 - 0.1576 - 1.131 -1999 13 5 12 12 342,731 52,403,000 672,278 3.793 1.459 0.2481 0.0954 1.934 0.7442000 12 1 5 5 369,535 44,943,000 603,659 3.247 0.271 0.2670 0.0223 1.988 0.1662001 7 2 13 13 300,432 43,099,000 558,052 2.330 0.666 0.1624 0.0464 1.254 0.3582002 7 0 0 0 273,559 41,633,000 513,452 2.559 - 0.1681 - 1.363 -2003 2 1 2 2 319,206 47,404,000 572,260 0.627 0.313 0.0422 0.0211 0.349 0.1752004 4 0 0 0 302,218 46,809,000 538,077 1.324 - 0.0855 - 0.743 -2005 6 0 0 0 299,775 45,721,000 527,267 2.002 - 0.1312 - 1.138 -2006 3 1 2 2 301,495 46,503,000 568,464 0.995 0.332 0.0645 0.0215 0.528 0.1762007 3 0 0 0 302,000 46,600,000 570,000 0.993 - 0.0644 - 0.526 -Notes2007 data are preliminary.Flight hours, miles, and departures are compiled by the Federal Aviation Administration.Since March 20, 1997, aircraft with 10 or more seats used in scheduled passenger service have been operated under 14 CFR 121.Years followed by the symbol * are those in which an illegal act was responsible for an occurrence in this category. These acts, such as suicide, sabotage and terrorism are includedin the totals for accidents and fatalities but are excluded for the purpose of accident rate computation. Table 12 contains a list of illegal act occurrences involving US air carriers forthe period covered by this table.Based on a February 2002 FAA legal interpretation provided to the NTSB, any 14 CFR 135 operation conducted with no revenue passengers aboard will be considered an ondemandflight operation.This interpretation will be applied to accidents beginning with the year 2002.It has not been retroactively applied to 36 accidents, nine of them fatal thatoccurred during the period 1983 - 2001.U.S. air carriers operating under 14 CFR Part 135 were previously referred to as Scheduled and Nonscheduled Services. Current tables now refer to these same air carries as CommuterOperations and On-Demand Operations, respectively, in order to be consistent with definitions in14 CFR 119.3 and terminology used in 14 CFR 135.1. On-Demand Part 135operations encompass charters, air taxis, air tours, or medical services (when a patient is on board).<strong>RAA</strong> 2008 <strong>Annual</strong> <strong>Report</strong> 21
- Page 1: 2008Annual Report
- Page 4 and 5: We offer the longest running Compon
- Page 6 and 7: educe turn timeGreater worldwide su
- Page 8 and 9: Great service forsmall enginesOutst
- Page 10 and 11: Thank you!to all of our 2008 Conven
- Page 13 and 14: 2007 US Summary StatisticsRAA 2008
- Page 15 and 16: Industry Traffic Statistics2003 200
- Page 17 and 18: Passengers EnplanedPassengers Enpla
- Page 19 and 20: Corporate Groupings of Top 50 Regio
- Page 21: Regional Airline FleetScheduled Pas
- Page 25 and 26: Regional Aircraft Statistics
- Page 27 and 28: Regional Aircraft Distribution by C
- Page 29: US Airports and Regional Service(St
- Page 32 and 33: US Airports Served Exclusively by R
- Page 34 and 35: Passenger Service in United States(
- Page 36 and 37: ConnecticutRegional only (95% and a
- Page 38 and 39: IndianaRegional only (95% and above
- Page 40 and 41: MarylandRegional only (95% and abov
- Page 42 and 43: MontanaRegional only (95% and above
- Page 44 and 45: Regional only (95% and above)Region
- Page 46 and 47: PennsylvaniaRegional only (95% and
- Page 48 and 49: UtahRegional only (95% and above)Re
- Page 50 and 51: Regional only (95% and above)Region
- Page 52 and 53: HawaiiRegional only (95% and above)
- Page 54 and 55: LOWcost of ownership is built into
- Page 56 and 57: Essential Air ServiceIn recent year
- Page 58 and 59: GeorgiaEAS Community Airline Servic
- Page 60 and 61: MontanaEAS Community Airline Servic
- Page 62 and 63: PennsylvaniaEAS Community Airline S
- Page 64: AlaskaEssential Air ServiceEAS Comm
- Page 69 and 70: RAA Member AirlinesAerolineas Meso
- Page 71 and 72: Era Aviation, Inc.6160 Carl Brady D
- Page 73 and 74:
Republic Airlines, Inc.dba US Airwa
- Page 75 and 76:
OxygenBottleContainersTireToteBagCa
- Page 77 and 78:
Associate Member Directory
- Page 79 and 80:
AssociateMemberCouncil2007-2008AMC
- Page 81 and 82:
Associate Member Index A-ZEpic Avia
- Page 83 and 84:
Associate Member Index by CategoryA
- Page 85 and 86:
Associate Member Index by CategoryF
- Page 87 and 88:
Perrone Aerospace182 Riverside Driv
- Page 89 and 90:
Heads Up Technologies2033 Chennault
- Page 91 and 92:
Accel Aviation Accessories, LLC1190
- Page 93 and 94:
Aerospace Welding890 Michele-BohecB
- Page 95 and 96:
Aviation Representatives (Av-Reps)
- Page 97 and 98:
Emery Air, IncOne Airport CircleRoc
- Page 99 and 100:
Hawker Pacific Aerospace /CONT’Da
- Page 101 and 102:
Messier Services Americas1400 Woodl
- Page 103 and 104:
Perkins Aircraft Services, Inc2300
- Page 105 and 106:
Southern Aeroparts Ametek10837 E. M
- Page 107 and 108:
Unicorp Systems, Inc /CONT’D.Avia
- Page 109 and 110:
Engage Aviation, LLC5580 Ships Chan
- Page 111 and 112:
Aero Quality Sales47 Harbor View Av
- Page 113 and 114:
Interturbine Logistik GmbH /CONT’
- Page 115 and 116:
TBM, Inc6662 Olive BlvdSt. Louis, M
- Page 117 and 118:
BAE SYSTEMS Regional Aircraft13850
- Page 119 and 120:
Flight Training Services Internatio
- Page 121 and 122:
InsuranceAIG Aviation, Inc100 Colon
- Page 123 and 124:
Professional Aviation Board of Cert
- Page 125 and 126:
PublicationsSpecialized ServicesAir
- Page 127 and 128:
FFC Services / Floats & Fuel Cells4
- Page 129 and 130:
Sabre, Inc3150 Sabre DriveSouthlake
- Page 131 and 132:
Reference
- Page 133 and 134:
North American Scheduled Carrier Le
- Page 135 and 136:
Airport CodesELD.........El Dorado
- Page 137 and 138:
Airport CodesRBY.........Ruby AKRCP
- Page 140:
TheCRJ NextGen Familywith the all-n