indicators of seawater intrusion - Seasidebasinwatermaster.org
indicators of seawater intrusion - Seasidebasinwatermaster.org
indicators of seawater intrusion - Seasidebasinwatermaster.org
- No tags were found...

You also want an ePaper? Increase the reach of your titles
YUMPU automatically turns print PDFs into web optimized ePapers that Google loves.
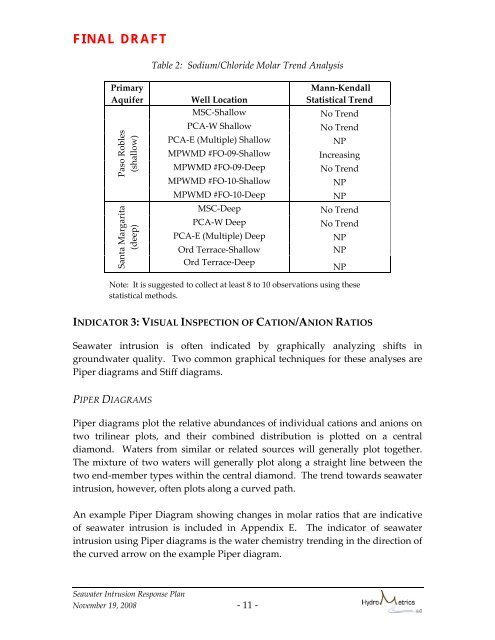
FINAL DRAFTTable 2: Sodium/Chloride Molar Trend AnalysisPrimaryAquiferPaso Robles(shallow)Santa Margarita(deep)Well LocationMSC‐ShallowPCA‐W ShallowPCA‐E (Multiple) ShallowMPWMD #FO‐09‐ShallowMPWMD #FO‐09‐DeepMPWMD #FO‐10‐ShallowMPWMD #FO‐10‐DeepMSC‐DeepPCA‐W DeepPCA‐E (Multiple) DeepOrd Terrace‐ShallowOrd Terrace‐DeepMann‐KendallStatistical TrendNo TrendNo TrendNPIncreasingNo TrendNPNPNo TrendNo TrendNPNPNPNote: It is suggested to collect at least 8 to 10 observations using thesestatistical methods.INDICATOR 3: VISUAL INSPECTION OF CATION/ANION RATIOSSeawater <strong>intrusion</strong> is <strong>of</strong>ten indicated by graphically analyzing shifts ingroundwater quality. Two common graphical techniques for these analyses arePiper diagrams and Stiff diagrams.PIPER DIAGRAMSPiper diagrams plot the relative abundances <strong>of</strong> individual cations and anions ontwo trilinear plots, and their combined distribution is plotted on a centraldiamond. Waters from similar or related sources will generally plot together.The mixture <strong>of</strong> two waters will generally plot along a straight line between thetwo end‐member types within the central diamond. The trend towards <strong>seawater</strong><strong>intrusion</strong>, however, <strong>of</strong>ten plots along a curved path.An example Piper Diagram showing changes in molar ratios that are indicative<strong>of</strong> <strong>seawater</strong> <strong>intrusion</strong> is included in Appendix E. The indicator <strong>of</strong> <strong>seawater</strong><strong>intrusion</strong> using Piper diagrams is the water chemistry trending in the direction <strong>of</strong>the curved arrow on the example Piper diagram.Seawater Intrusion Response PlanNovember 19, 2008 - 11 -