indicators of seawater intrusion - Seasidebasinwatermaster.org
indicators of seawater intrusion - Seasidebasinwatermaster.org
indicators of seawater intrusion - Seasidebasinwatermaster.org
- No tags were found...

You also want an ePaper? Increase the reach of your titles
YUMPU automatically turns print PDFs into web optimized ePapers that Google loves.
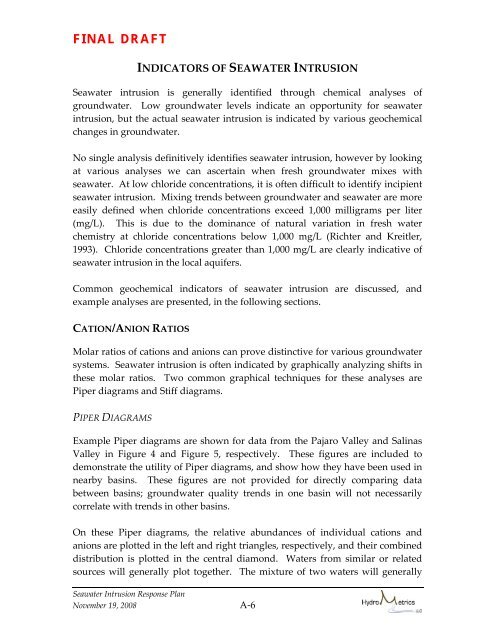
FINAL DRAFTINDICATORS OF SEAWATER INTRUSIONSeawater <strong>intrusion</strong> is generally identified through chemical analyses <strong>of</strong>groundwater. Low groundwater levels indicate an opportunity for <strong>seawater</strong><strong>intrusion</strong>, but the actual <strong>seawater</strong> <strong>intrusion</strong> is indicated by various geochemicalchanges in groundwater.No single analysis definitively identifies <strong>seawater</strong> <strong>intrusion</strong>, however by lookingat various analyses we can ascertain when fresh groundwater mixes with<strong>seawater</strong>. At low chloride concentrations, it is <strong>of</strong>ten difficult to identify incipient<strong>seawater</strong> <strong>intrusion</strong>. Mixing trends between groundwater and <strong>seawater</strong> are moreeasily defined when chloride concentrations exceed 1,000 milligrams per liter(mg/L). This is due to the dominance <strong>of</strong> natural variation in fresh waterchemistry at chloride concentrations below 1,000 mg/L (Richter and Kreitler,1993). Chloride concentrations greater than 1,000 mg/L are clearly indicative <strong>of</strong><strong>seawater</strong> <strong>intrusion</strong> in the local aquifers.Common geochemical <strong>indicators</strong> <strong>of</strong> <strong>seawater</strong> <strong>intrusion</strong> are discussed, andexample analyses are presented, in the following sections.CATION/ANION RATIOSMolar ratios <strong>of</strong> cations and anions can prove distinctive for various groundwatersystems. Seawater <strong>intrusion</strong> is <strong>of</strong>ten indicated by graphically analyzing shifts inthese molar ratios. Two common graphical techniques for these analyses arePiper diagrams and Stiff diagrams.PIPER DIAGRAMSExample Piper diagrams are shown for data from the Pajaro Valley and SalinasValley in Figure 4 and Figure 5, respectively. These figures are included todemonstrate the utility <strong>of</strong> Piper diagrams, and show how they have been used innearby basins. These figures are not provided for directly comparing databetween basins; groundwater quality trends in one basin will not necessarilycorrelate with trends in other basins.On these Piper diagrams, the relative abundances <strong>of</strong> individual cations andanions are plotted in the left and right triangles, respectively, and their combineddistribution is plotted in the central diamond. Waters from similar or relatedsources will generally plot together. The mixture <strong>of</strong> two waters will generallySeawater Intrusion Response PlanNovember 19, 2008 A-6