indicators of seawater intrusion - Seasidebasinwatermaster.org
indicators of seawater intrusion - Seasidebasinwatermaster.org
indicators of seawater intrusion - Seasidebasinwatermaster.org
- No tags were found...
You also want an ePaper? Increase the reach of your titles
YUMPU automatically turns print PDFs into web optimized ePapers that Google loves.
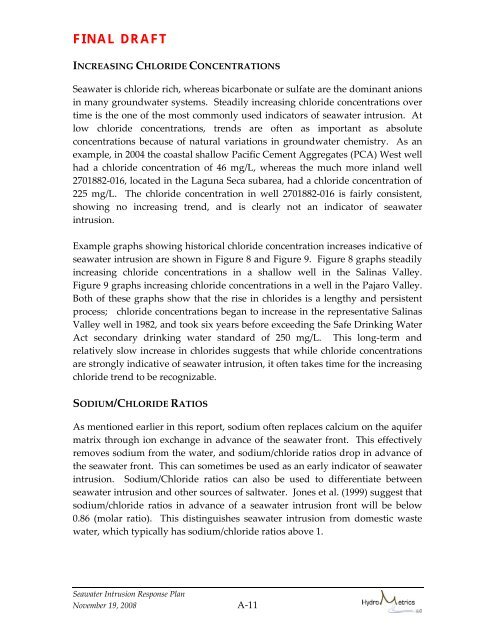
FINAL DRAFTINCREASING CHLORIDE CONCENTRATIONSSeawater is chloride rich, whereas bicarbonate or sulfate are the dominant anionsin many groundwater systems. Steadily increasing chloride concentrations overtime is the one <strong>of</strong> the most commonly used <strong>indicators</strong> <strong>of</strong> <strong>seawater</strong> <strong>intrusion</strong>. Atlow chloride concentrations, trends are <strong>of</strong>ten as important as absoluteconcentrations because <strong>of</strong> natural variations in groundwater chemistry. As anexample, in 2004 the coastal shallow Pacific Cement Aggregates (PCA) West wellhad a chloride concentration <strong>of</strong> 46 mg/L, whereas the much more inland well2701882‐016, located in the Laguna Seca subarea, had a chloride concentration <strong>of</strong>225 mg/L. The chloride concentration in well 2701882‐016 is fairly consistent,showing no increasing trend, and is clearly not an indicator <strong>of</strong> <strong>seawater</strong><strong>intrusion</strong>.Example graphs showing historical chloride concentration increases indicative <strong>of</strong><strong>seawater</strong> <strong>intrusion</strong> are shown in Figure 8 and Figure 9. Figure 8 graphs steadilyincreasing chloride concentrations in a shallow well in the Salinas Valley.Figure 9 graphs increasing chloride concentrations in a well in the Pajaro Valley.Both <strong>of</strong> these graphs show that the rise in chlorides is a lengthy and persistentprocess; chloride concentrations began to increase in the representative SalinasValley well in 1982, and took six years before exceeding the Safe Drinking WaterAct secondary drinking water standard <strong>of</strong> 250 mg/L. This long‐term andrelatively slow increase in chlorides suggests that while chloride concentrationsare strongly indicative <strong>of</strong> <strong>seawater</strong> <strong>intrusion</strong>, it <strong>of</strong>ten takes time for the increasingchloride trend to be recognizable.SODIUM/CHLORIDE RATIOSAs mentioned earlier in this report, sodium <strong>of</strong>ten replaces calcium on the aquifermatrix through ion exchange in advance <strong>of</strong> the <strong>seawater</strong> front. This effectivelyremoves sodium from the water, and sodium/chloride ratios drop in advance <strong>of</strong>the <strong>seawater</strong> front. This can sometimes be used as an early indicator <strong>of</strong> <strong>seawater</strong><strong>intrusion</strong>. Sodium/Chloride ratios can also be used to differentiate between<strong>seawater</strong> <strong>intrusion</strong> and other sources <strong>of</strong> saltwater. Jones et al. (1999) suggest thatsodium/chloride ratios in advance <strong>of</strong> a <strong>seawater</strong> <strong>intrusion</strong> front will be below0.86 (molar ratio). This distinguishes <strong>seawater</strong> <strong>intrusion</strong> from domestic wastewater, which typically has sodium/chloride ratios above 1.Seawater Intrusion Response PlanNovember 19, 2008 A-11


