indicators of seawater intrusion - Seasidebasinwatermaster.org
indicators of seawater intrusion - Seasidebasinwatermaster.org
indicators of seawater intrusion - Seasidebasinwatermaster.org
- No tags were found...

Create successful ePaper yourself
Turn your PDF publications into a flip-book with our unique Google optimized e-Paper software.
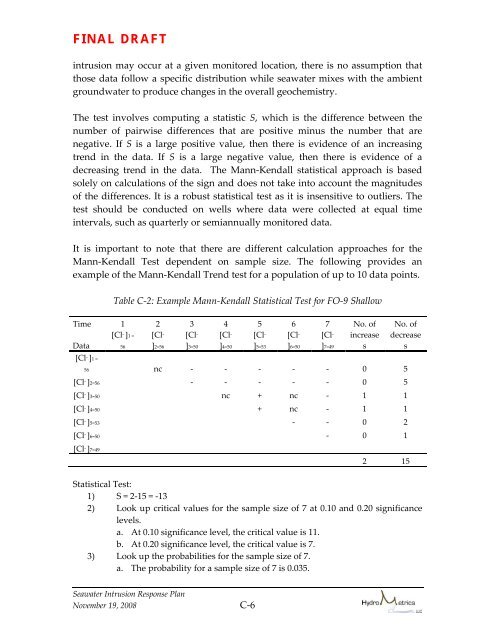
FINAL DRAFT<strong>intrusion</strong> may occur at a given monitored location, there is no assumption thatthose data follow a specific distribution while <strong>seawater</strong> mixes with the ambientgroundwater to produce changes in the overall geochemistry.The test involves computing a statistic S, which is the difference between thenumber <strong>of</strong> pairwise differences that are positive minus the number that arenegative. If S is a large positive value, then there is evidence <strong>of</strong> an increasingtrend in the data. If S is a large negative value, then there is evidence <strong>of</strong> adecreasing trend in the data. The Mann‐Kendall statistical approach is basedsolely on calculations <strong>of</strong> the sign and does not take into account the magnitudes<strong>of</strong> the differences. It is a robust statistical test as it is insensitive to outliers. Thetest should be conducted on wells where data were collected at equal timeintervals, such as quarterly or semiannually monitored data.It is important to note that there are different calculation approaches for theMann‐Kendall Test dependent on sample size. The following provides anexample <strong>of</strong> the Mann‐Kendall Trend test for a population <strong>of</strong> up to 10 data points.Table C‐2: Example Mann‐Kendall Statistical Test for FO‐9 ShallowTime 1 2 3 4 5 6 7 No. <strong>of</strong> No. <strong>of</strong>[Cl ‐ ]1 = [Cl ‐ [Cl ‐ [Cl ‐ [Cl ‐ [Cl ‐ [Cl ‐ increase decreaseData56 ]2=56 ]3=50 ]4=50 ]5=53 ]6=50 ]7=49 s s[Cl ‐ ]1 =56 nc ‐ ‐ ‐ ‐ ‐ 0 5[Cl ‐ ]2=56 ‐ ‐ ‐ ‐ ‐ 0 5[Cl ‐ ]3=50 nc + nc ‐ 1 1[Cl ‐ ]4=50 + nc ‐ 1 1[Cl ‐ ]5=53 ‐ ‐ 0 2[Cl ‐ ]6=50 ‐ 0 1[Cl ‐ ]7=492 15Statistical Test:1) S = 2‐15 = ‐132) Look up critical values for the sample size <strong>of</strong> 7 at 0.10 and 0.20 significancelevels.a. At 0.10 significance level, the critical value is 11.b. At 0.20 significance level, the critical value is 7.3) Look up the probabilities for the sample size <strong>of</strong> 7.a. The probability for a sample size <strong>of</strong> 7 is 0.035.Seawater Intrusion Response PlanNovember 19, 2008 C-6