indicators of seawater intrusion - Seasidebasinwatermaster.org
indicators of seawater intrusion - Seasidebasinwatermaster.org
indicators of seawater intrusion - Seasidebasinwatermaster.org
- No tags were found...

You also want an ePaper? Increase the reach of your titles
YUMPU automatically turns print PDFs into web optimized ePapers that Google loves.
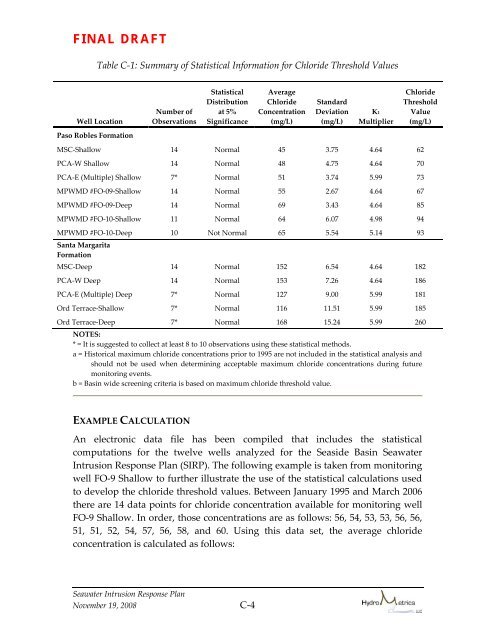
FINAL DRAFTTable C‐1: Summary <strong>of</strong> Statistical Information for Chloride Threshold ValuesWell LocationPaso Robles FormationNumber <strong>of</strong>ObservationsStatisticalDistributionat 5%SignificanceAverageChlorideConcentration(mg/L)StandardDeviation(mg/L)K1MultiplierChlorideThresholdValue(mg/L)MSC‐Shallow 14 Normal 45 3.75 4.64 62PCA‐W Shallow 14 Normal 48 4.75 4.64 70PCA‐E (Multiple) Shallow 7* Normal 51 3.74 5.99 73MPWMD #FO‐09‐Shallow 14 Normal 55 2.67 4.64 67MPWMD #FO‐09‐Deep 14 Normal 69 3.43 4.64 85MPWMD #FO‐10‐Shallow 11 Normal 64 6.07 4.98 94MPWMD #FO‐10‐Deep 10 Not Normal 65 5.54 5.14 93Santa MargaritaFormationMSC‐Deep 14 Normal 152 6.54 4.64 182PCA‐W Deep 14 Normal 153 7.26 4.64 186PCA‐E (Multiple) Deep 7* Normal 127 9.00 5.99 181Ord Terrace‐Shallow 7* Normal 116 11.51 5.99 185Ord Terrace‐Deep 7* Normal 168 15.24 5.99 260NOTES:* = It is suggested to collect at least 8 to 10 observations using these statistical methods.a = Historical maximum chloride concentrations prior to 1995 are not included in the statistical analysis andshould not be used when determining acceptable maximum chloride concentrations during futuremonitoring events.b = Basin wide screening criteria is based on maximum chloride threshold value.EXAMPLE CALCULATIONAn electronic data file has been compiled that includes the statisticalcomputations for the twelve wells analyzed for the Seaside Basin SeawaterIntrusion Response Plan (SIRP). The following example is taken from monitoringwell FO‐9 Shallow to further illustrate the use <strong>of</strong> the statistical calculations usedto develop the chloride threshold values. Between January 1995 and March 2006there are 14 data points for chloride concentration available for monitoring wellFO‐9 Shallow. In order, those concentrations are as follows: 56, 54, 53, 53, 56, 56,51, 51, 52, 54, 57, 56, 58, and 60. Using this data set, the average chlorideconcentration is calculated as follows:Seawater Intrusion Response PlanNovember 19, 2008 C-4