indicators of seawater intrusion - Seasidebasinwatermaster.org
indicators of seawater intrusion - Seasidebasinwatermaster.org
indicators of seawater intrusion - Seasidebasinwatermaster.org
- No tags were found...

You also want an ePaper? Increase the reach of your titles
YUMPU automatically turns print PDFs into web optimized ePapers that Google loves.
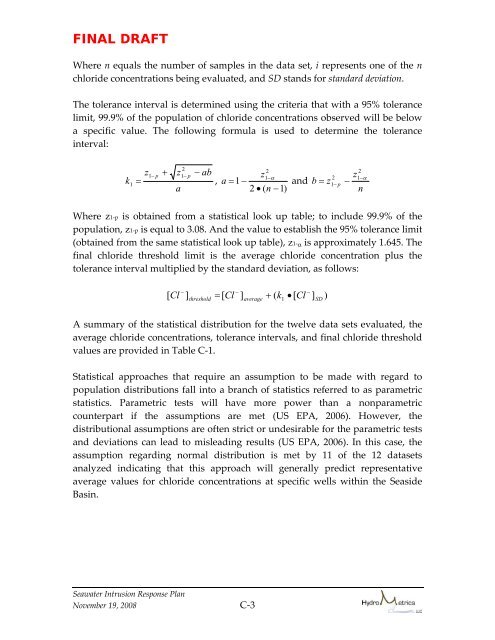
FINAL DRAFTWhere n equals the number <strong>of</strong> samples in the data set, i represents one <strong>of</strong> the nchloride concentrations being evaluated, and SD stands for standard deviation.The tolerance interval is determined using the criteria that with a 95% tolerancelimit, 99.9% <strong>of</strong> the population <strong>of</strong> chloride concentrations observed will be belowa specific value. The following formula is used to determine the toleranceinterval:kz=+za− ab21−p 1−p1,2z1−αa = 1 −2 • ( n −1)andb = z21−p−z21−αnWhere z1‐p is obtained from a statistical look up table; to include 99.9% <strong>of</strong> thepopulation, z1‐p is equal to 3.08. And the value to establish the 95% tolerance limit(obtained from the same statistical look up table), z1‐α is approximately 1.645. Thefinal chloride threshold limit is the average chloride concentration plus thetolerance interval multiplied by the standard deviation, as follows:−−−[ Cl ]threshold= [ Cl ]average+ ( k1 • [ Cl ]SD)A summary <strong>of</strong> the statistical distribution for the twelve data sets evaluated, theaverage chloride concentrations, tolerance intervals, and final chloride thresholdvalues are provided in Table C‐1.Statistical approaches that require an assumption to be made with regard topopulation distributions fall into a branch <strong>of</strong> statistics referred to as parametricstatistics. Parametric tests will have more power than a nonparametriccounterpart if the assumptions are met (US EPA, 2006). However, thedistributional assumptions are <strong>of</strong>ten strict or undesirable for the parametric testsand deviations can lead to misleading results (US EPA, 2006). In this case, theassumption regarding normal distribution is met by 11 <strong>of</strong> the 12 datasetsanalyzed indicating that this approach will generally predict representativeaverage values for chloride concentrations at specific wells within the SeasideBasin.Seawater Intrusion Response PlanNovember 19, 2008 C-3