An Exercise in Freezing Point Depression
An Exercise in Freezing Point Depression
An Exercise in Freezing Point Depression
- No tags were found...

Create successful ePaper yourself
Turn your PDF publications into a flip-book with our unique Google optimized e-Paper software.
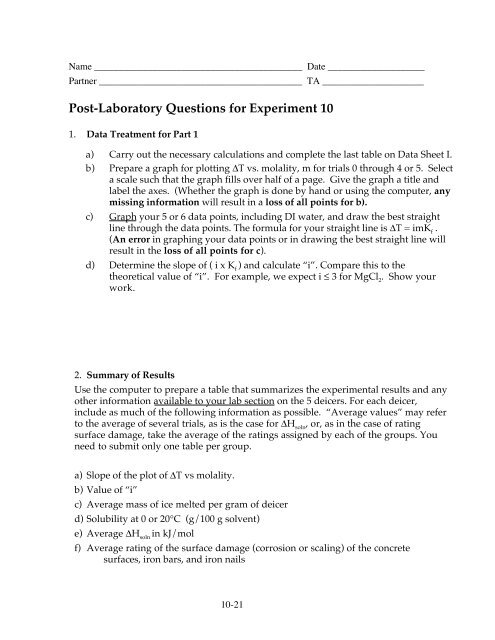
Name ___________________________________________ Date ____________________Partner __________________________________________ TA _____________________Post-Laboratory Questions for Experiment 101. Data Treatment for Part 1a) Carry out the necessary calculations and complete the last table on Data Sheet I.b) Prepare a graph for plott<strong>in</strong>g ∆T vs. molality, m for trials 0 through 4 or 5. Selecta scale such that the graph fills over half of a page. Give the graph a title andlabel the axes. (Whether the graph is done by hand or us<strong>in</strong>g the computer, anymiss<strong>in</strong>g <strong>in</strong>formation will result <strong>in</strong> a loss of all po<strong>in</strong>ts for b).c) Graph your 5 or 6 data po<strong>in</strong>ts, <strong>in</strong>clud<strong>in</strong>g DI water, and draw the best straightl<strong>in</strong>e through the data po<strong>in</strong>ts. The formula for your straight l<strong>in</strong>e is ∆T = imK f.(<strong>An</strong> error <strong>in</strong> graph<strong>in</strong>g your data po<strong>in</strong>ts or <strong>in</strong> draw<strong>in</strong>g the best straight l<strong>in</strong>e willresult <strong>in</strong> the loss of all po<strong>in</strong>ts for c).d) Determ<strong>in</strong>e the slope of ( i x K f) and calculate “i”. Compare this to thetheoretical value of “i”. For example, we expect i ≤ 3 for MgCl 2. Show yourwork.2. Summary of ResultsUse the computer to prepare a table that summarizes the experimental results and anyother <strong>in</strong>formation available to your lab section on the 5 deicers. For each deicer,<strong>in</strong>clude as much of the follow<strong>in</strong>g <strong>in</strong>formation as possible. “Average values” may referto the average of several trials, as is the case for ∆H soln, or, as <strong>in</strong> the case of rat<strong>in</strong>gsurface damage, take the average of the rat<strong>in</strong>gs assigned by each of the groups. Youneed to submit only one table per group.a) Slope of the plot of ∆T vs molality.b) Value of “i”c) Average mass of ice melted per gram of deicerd) Solubility at 0 or 20°C (g/100 g solvent)e) Average ∆H soln<strong>in</strong> kJ/molf) Average rat<strong>in</strong>g of the surface damage (corrosion or scal<strong>in</strong>g) of the concretesurfaces, iron bars, and iron nails10-21