Download PDF - Severstal
Download PDF - Severstal
Download PDF - Severstal

Create successful ePaper yourself
Turn your PDF publications into a flip-book with our unique Google optimized e-Paper software.
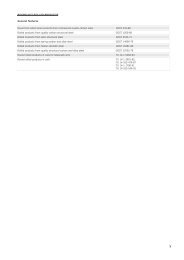
OAO <strong>Severstal</strong> and subsidiariesOAO <strong>Severstal</strong> and subsidiariesNotes to the consolidated financial statementsfor the years ended December 31, 2008, 2007 and 2006(Amounts expressed in thousands of US dollars, except as stated otherwise)24. Debt financeDecember 31,2008 2007 2006Eurobonds 2009 325,000 325,000 325,000Eurobonds 2013 1,250,000 - -Eurobonds 2014 375,000 375,000 375,000Other issued notes and bonds 14,150 - 113,934Bank financing 5,941,200 2,932,570 2,226,979Factoring of receivables 191,623 201,909 224,049Other financing 142,711 119,361 72,674Accrued interest 112,090 41,807 56,692Unamortized balance of transaction costs (96,257) (53,265) (48,172)8,255,517 3,942,382 3,346,156Total debt is denominated in the following currencies:US Dollars 4,957,298 1,960,275 1,426,895Rubles 653,339 547,866 470,143Euro 2,616,523 1,432,490 1,449,118Other currencies 28,357 1,751 -8,255,517 3,942,382 3,346,156Total debt is contractually repayable after the balance sheet date as follows:Less than one year 1,977,513 1,129,216 1,081,965Between one and five years 5,393,228 1,923,336 1,542,177After more than five years 884,776 889,830 722,0148,255,517 3,942,382 3,346,156Debt finance rose from banks and unused long term credit lines are secured by charges over:• US$ 2,837.0 million (December 31, 2007: US$ 1,142.0 million; December 31, 2006: US$ 701.4 million) of the netbook value of plant and equipment;• US$ 2,303.6 million (December 31, 2007: US$ 679.1 million; December 31, 2006: US$ 1,080.7 million) of currentassets and revenues from export contracts; and,• 50% ownership in Mountain State Carbon and investments in other associates and joint ventures in <strong>Severstal</strong>North America segment and 50% ownership in IPM, the Group’s subsidiary.Notes to the consolidated financial statementsfor the years ended December 31, 2008, 2007 and 2006(Amounts expressed in thousands of US dollars, except as stated otherwise)25. Other current liabilitiesDecember 31,2008 2007 2006Amounts payable to employees 400,791 248,231 187,330Advances received 105,611 221,612 236,565Provisions (Note 27) 69,540 43,974 12,011Onerous contracts 71,509 - -Accrued expenses 63,779 34,166 54,084Lease liabilities 23,182 9,753 2,579Derivative financial liabilities 19,110 - -Payable for acquisition of subsidiaries 7,320 - -Decommissioning liability (Note 27) 5,308 - -Deferred income 3,319 - -Bank customer accounts - - 31,143Other liabilities 36,150 62,633 30,832805,619 620,369 554,54426. Retirement benefit liabilitiesThe Group provides for its employees the following retirement benefits, which are actuarially calculated as definedbenefit obligation: lump sums payable to employees on retirement, monthly pensions, jubilee benefits, invalidityand death lump sums, burial expenses compensations, healthcare benefits, life insurance and other benefits.The following assumptions have been used to calculate the retirement benefit liability:December 31,2008 2007 2006Discount rates:Russia 8.5% to 10.6% 6.5% 6.5%USA 5.3% to 6.5% 5.3% 5.8%UK 6.7% 3.1% 4.9%Italy and France 4.4% to 5.3% 5.1% to 5.6% 4.6%Future rates of benefit increase:Russia 6.3% to 8.2% 5.8% to 6.2% 6.2%USA Fixed at 0% or 4.0% Fixed at 0% or 9.0% Fixed at 0%to 10.0%UK 2.7% 3.4% 2.8%Italy and France 3.0% to 6.0% 2.0% to 3.0% 3.0%A part of the Group’s debt financing is subject to certain covenants. The Group complied with all significant debtcovenants, including equity ratios, during the years ended December 31, 2008, 2007 and 2006.At the balance sheet date the Group had US$ 950.6 million (December 31, 2007: US$ 1,082.7 million; December 31,2006: US$ 717.9 million) of unused long term credit lines available to it.Present value of the defined benefit obligation less the fair value of plan assets is recognized as retirement benefitliability at the balance sheet.December 31,2008 2007 2006 2005 2004Present value of the defined benefit obligation 987,418 495,713 549,009 387,657 208,325Fair value of the plan assets (208,122) (108,315) (106,055) (49,171) (50,302)Retirement benefit liability 779,296 387,398 442,954 338,486 158,023146147