Download PDF - Severstal
Download PDF - Severstal
Download PDF - Severstal

You also want an ePaper? Increase the reach of your titles
YUMPU automatically turns print PDFs into web optimized ePapers that Google loves.
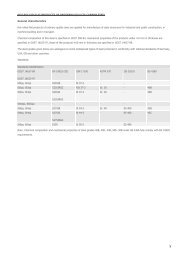
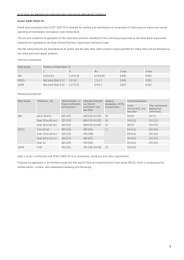
OAO <strong>Severstal</strong> and subsidiariesOAO <strong>Severstal</strong> and subsidiariesNotes to the consolidated financial statementsfor the years ended December 31, 2008, 2007 and 2006(Amounts expressed in thousands of US dollars, except as stated otherwise)Notes to the consolidated financial statementsfor the years ended December 31, 2008, 2007 and 2006(Amounts expressed in thousands of US dollars, except as stated otherwise)The movements in the defined benefit obligation are as follows:Year ended December 31,2008 2007 2006Opening balance 495,713 549,009 387,657Business combinations/(de-combinations) 526,630 (33,612) 39,328Reclassified to assets held for sale - (9,260) -Benefits p aid (60,698) (55,238) (33,547)Interest cost 33,065 27,589 24,962Service cost (Note 5) 27,602 18,640 18,767Actuarial loss/(gain) (Note 5) 25,889 (37,497) 68,573Foreign exchange (gain)/loss (60,783) 36,082 43,269Closing balance 987,418 495,713 549,009The overall expected rate of return on pension plan assets is calculated based on the expected long-terminvestment returns for each category of assets that forms the portfolio. The assessment of expected returns is basedon historical returns and predictions of the market for each category of assets in the portfolio in the next twelvemonths. Expected and actual rate of return on plan assets is presented in the table below:2008 2007 2006Actual Expected Actual Expected Actual ExpectedRussia 4.0% 16.0% 16.1% 17.0% 13.0% 12.0%USA -10.0% to 0% 0% to 3.0% n/a n/a n/a n/aUK -15.0% 3.6% 5.0% 5.0% 2.7% 2.7%The retirement benefit expenses recognized in the income statement are contained in the caption: ‘Cost of sales’,The movements in the plan assets are as follows:Year ended December 31,2008 2007 2006Opening balance 108,315 106,055 49,171Business combinations/(de-combinations) 117,215 (10,122) 28,566Contributions made during the year 38,637 11,534 13,424Benefits paid (28,232) (14,852) (12,356)Return on assets (Note 5) (1,045) 10,921 16,382Actuarial (loss)/gain (Note 5) (7,252) (441) 915Foreign exchange (loss)/gain (19,516) 5,220 9,953Closing balance 208,122 108,315 106,055Defined benefit obligation analysis is as follows:December 31,2008 2007 2006Wholly unfunded 497,129 258,926 284,485Partly funded 490,289 236,787 264,524Total 987,418 495,713 549,009‘General and administrative expenses’ allocated proportionally to related salary expenses, except for the interestcost, which is recognized in the caption ‘Interest expense’.27. Other non-current liabilitiesDecember 31,2008 2007 2006Decommissioning liability 246,147 108,961 128,209Provisions 139,625 66,902 67,139Amounts payable to employees 66,479 - -Lease liabilities 53,479 14,515 13,742Deferred income 31,590 29,660 29,588Derivative financial liabilities 11,183 - -Restructured tax liabilities 758 24,978 67,731Payable for acquisition of subsidiaries - - 29,428Other liabilities 42,029 79,636 23,761591,290 324,652 359,598Plan assets analysis is as follows:December 31,2008 2007 2006Equity instruments 38,161 44,448 44,450Deposits 14,946 3,037 1,980Shares in mutual funds 34,531 - -Cash 75,565 1,170 1,417Government bonds 11,557 28,548 28,850Corporate bonds 14,335 14,964 14,178Other investments 19,027 16,148 15,180Total 208,122 108,315 106,055The Group’s best estimate of contributions expected to be paid to the plan in 2009 is US$ 43.3 million.Decommissioning liabilityThe Group has environmental liabilities related to restoration of soil and other related works, which are due uponthe closures of its mines and production facilities. These costs are expected to be incurred between 2009 – 2050.The present value of expected cash outflows were estimated using existing technology, and discounted using a realdiscount rate. These rates, presented by segment, are as follows:Discount rates, %2008 2007 2006Minings egment:Russia 2.0 - 2.8 2.0 2.0Kazakhstan 1.0 n/a n/aUSA 2.4 - 6.8 n/a n/aBurkina Faso 3.8 n/a n/aNorth America 1.8 n/a n/a148149