Download PDF - Severstal
Download PDF - Severstal
Download PDF - Severstal

Create successful ePaper yourself
Turn your PDF publications into a flip-book with our unique Google optimized e-Paper software.
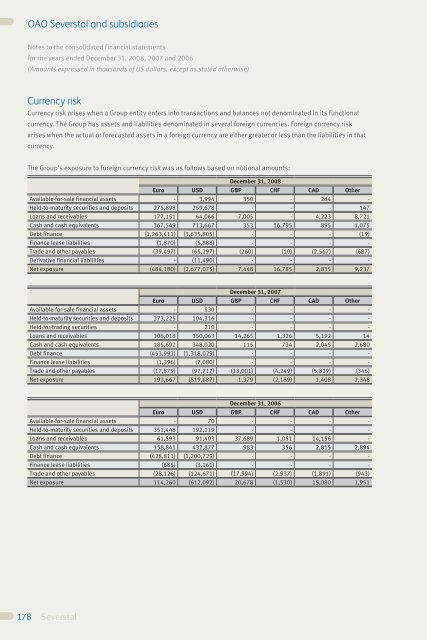
OAO <strong>Severstal</strong> and subsidiariesOAO <strong>Severstal</strong> and subsidiariesNotes to the consolidated financial statementsfor the years ended December 31, 2008, 2007 and 2006(Amounts expressed in thousands of US dollars, except as stated otherwise)Notes to the consolidated financial statementsfor the years ended December 31, 2008, 2007 and 2006(Amounts expressed in thousands of US dollars, except as stated otherwise)Currency riskCurrency risk arises when a Group entity enters into transactions and balances not denominated in its functionalcurrency. The Group has assets and liabilities denominated in several foreign currencies. Foreign currency riskarises when the actual or forecasted assets in a foreign currency are either greater or less than the liabilities in thatcurrency.Sensitivity analysisA 10 percent strengthening of the following currencies against the functional currency at December 31, 2008 wouldhave increased/(decreased) profit and equity by the amounts shown below. This analysis assumes that all othervariables, in particular interest rates, remain constant and no translation difference into the presentation currency isincluded. The analysis is performed on the same basis for 2007 and 2006.The Group’s exposure to foreign currency risk was as follows based on notional amounts:December 31, 2008Euro USD GBP CHF CAD OtherAvailable-for-sale financial assets - 3,994 350 - 284 -Held-to-maturity securities and deposits 275,898 259,678 - - - 147Loans and receivables 177,151 64,066 7,005 - 4,223 8,721Cash and cash equivalents 367,549 713,667 353 16,795 895 1,075Debt finance (1,263,411) (3,635,805) - - - (19)Finance lease liabilities (1,870) (5,888) - - - -Trade and other payables (39,497) (65,297) (260) (10) (2,567) (687)Derivative financial liabilities - (11,490) - - - -Net exposure (484,180) (2,677,075) 7,448 16,785 2,835 9,237December 31, 2007Euro USD GBP CHF CAD OtherAvailable-for-sale financial assets - 530 - - - -Held-to-maturity securities and deposits 373,225 104,316 - - - -Held-for-trading securities - 210 - - - -Loans and receivables 108,018 150,063 14,265 1,326 5,192 14Cash and cash equivalents 185,692 348,020 115 734 2,045 2,680Debt finance (453,993) (1,318,029) - - - -Finance lease liabilities (1,396) (7,080) - - - -Trade and other payables (17,879) (97,717) (13,001) (4,249) (5,829) (346)Net exposure 193,667 (819,687) 1,379 (2,189) 1,408 2,348Year ended December 31,2008 2007 2006Net profitEuro (36,798) 14,331 8,561USD (203,458) (65,482) (46,160)GBP 566 (22) 1,415CHF 1,276 (166) (116)CAD 215 94 1,010Other 702 178 148A 10 percent weakening of the following currencies against the functional currency at December 31, 2008 wouldhave had the equal but opposite effect on the above currencies to the amounts shown above, on the basis that allother variables remain constant.Interest rate riskInterest rates on the Group’s debt finance are either fixed or variable, at a fixed spread over LIBOR or Euribor for theduration of each contract. Changes in interest rates impact primarily loans and borrowings by changing either theirfair value (fixed rate debt) or their future cash flows (variable rate debt). Management does not have a formal policyof determining how much of the Group’s exposure should be to fixed or variable rates. However, at the time of raisingnew loans or borrowings management uses its judgment to decide whether it believes that a fixed or variable ratewould be more favorable to the Group over the expected period until maturity.December 31, 2006Euro USD GBP CHF CAD OtherAvailable-for-sale financial assets - 70 - - - -Held-to-maturity securities and deposits 351,448 192,119 - - - -Loans and receivables 61,593 91,403 37,689 1,051 14,156 -Cash and cash equivalents 158,841 432,877 983 356 2,815 2,894Debt finance (428,811) (1,200,729) - - - -Finance lease liabilities (685) (3,161) - - - -Trade and other payables (28,126) (124,671) (17,994) (2,937) (1,891) (943)Net exposure 114,260 (612,092) 20,678 (1,530) 15,080 1,951The Group’s interest-bearing financial instruments at variable rates were:December 31,2008 2007 2006Financial assets 414,398 434,600 383,058Financial liabilities (4,915,823) (2,357,826) (1,654,697)(4,501,425) (1,923,226) (1,271,639)Other Group’s interest-bearing financial assets and liabilities are at fixed rate.178179